. 2016 Oct;57(10):1568-1580.
doi: 10.1111/epi.13493. Epub 2016 Aug 30.

Dynamics of sensorimotor cortex activation during absence and myoclonic seizures in a mouse model of juvenile myoclonic epilepsy

Affiliations

Dynamics of sensorimotor cortex activation during absence and myoclonic seizures in a mouse model of juvenile myoclonic epilepsy

Li Ding et al. Epilepsia. 2016 Oct.

Abstract

Objective: Generalized epilepsy syndromes often confer multiple types of seizures, but it is not known if these seizures activate separate or overlapping brain networks. Recently, we reported that mice with a juvenile myoclonic epilepsy mutation (Gabra1[A322D]) exhibited both absence and myoclonic generalized seizures. Here, we determined the time course of sensorimotor cortex activation and the spatial distribution of spike voltage during these two seizures.

Methods: We implanted Gabra1+/A322D mice with multiple electroencephalography (EEG) electrodes over bilateral somatosensory cortex barrel fields (S1) and anterior (aM1) and posterior (pM1) motor cortices and recorded absence seizures/spike-wave discharges (SWDs) and myoclonic seizures. We used nonlinear-association analyses and cross-correlation calculations to determine the strength, leading regions, and time delays of cortical coupling from the preictal to ictal states and within the spike and interspike periods. The distribution of spike voltage was also measured in SWDs and myoclonic seizures.

Results: EEG connectivity among all electrode pairs increased at the onset of both SWDs and myoclonic seizures. Surprisingly, during spikes of both seizure types, S1 led M1 with similar delay times. Myoclonic seizure spikes started more focally than SWD spikes, with a significant majority appearing first only in S1 electrodes, whereas a substantial fraction of SWD spikes were detected first in S1 and at least one M1 electrode. The absolute voltage of myoclonic seizure spikes was significantly higher than that of SWD spikes, and there was a greater relative voltage over M1 during myoclonic seizure spikes than in the first one to two SWD spikes.

Significance: The leading sites in S1 and similar delay times suggest both SWDs and myoclonic seizures activate overlapping networks in sensorimotor cortex and thus, therapeutically targeting of this network could potentially treat both seizures. Spike focality, absolute voltage, and voltage distribution provide insight into neuronal activation during these two seizure types.

Keywords: Absence seizure; Electroencephalography; GABAA receptor; Generalized seizure; Network analysis.


Figures

Figure 1
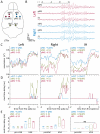
Figure 1. Corticocortical relationships in spontaneous SWDs
A) Scale diagram of a Gabra1+/A322D mouse brain indicates the location of the stereotactic placement of electrodes in the anterior motor cortex (aM1), posterior motor cortex (pM1), and somatosensory cortex barrel field (S1) as well as the location of the reference (Ref) and ground (Grd) electrodes. B) Example of a referential EEG recording of a SWD. The origin (t = 0s) of the time scale at the top of the panel is at the time of the first spike. C-E) Nonlinear association analyses was performed in overlapping windows starting from 1953 ms prior to first spike to 977 ms after the first spike among the electrodes in the left (left) and right (center) hemispheres as well as between the corresponding electrodes in each hemisphere (right). C) Plots of the mean nonlinear association constant (h2) at the start of each time window demonstrates that h2 increases in all electrode pairings at the time of the first spike and that the increase persists for at least the first 977 ms of the SWD. Panel D depicts the time delays between the pairs of electrodes at the start of each time window. Positive delays indicate that the EEG signal in the second electrode (to the right of the arrow) precedes the first electrode (to the left of the arrow). E) The median pre-ictal (t = −1953 to −1855 ms) and ictal (t = 244 to 342 ms) times are shown as a horizontal line within the box plots and the 25th to 75th percentile delay times are depicted by the box length. During the ictal, but not pre-ictal period, the median S1 to aM1 lag time was 2 ms (0 - 6 ms) on the left and 3 ms (1 – 7 ms) on the right. In addition, in the right hemisphere, S1 preceded pM1 by 2 ms (0 – 5 ms). There was no significant delay in EEG signal between corresponding electrodes in the left and right electrodes. Asterisks = Bonferroni-corrected P values, *** P < 0.001, ** P < 0.01, * P < 0.05, ns = nonsignificant. N = 30 SWDs from 4 mice.
Figure 2
Figure 2. Corticocortical relationships in myoclonic seizures
Stereotactic placement of electrodes is the same as in Figure 1A. A) Examples of referential EEG recordings of a myoclonic seizure with one (left), two (middle), and three (right) spikes. The 2-4 Hz slow and wave-spike activity seen before the single-spike myoclonic seizure and after the three-spike myoclonic seizure was seen frequently, but not universally, in the PTZ-treated mice. B-D) Nonlinear association analyses among the electrodes in the left (left) and right (center) hemispheres as well as between the corresponding electrodes in each hemisphere (right, IH) was performed in overlapping windows from 1953 ms prior to the ultimate spike (jerk spike) to 977 ms after the jerk spike. B) Plots of the mean nonlinear association constant (h2) at the start of each time window demonstrates that h2 increases in all electrode pairings starting approximately 500 ms prior to the jerk spike. Panel C depicts time delays between the pairs of electrodes; positive delays indicate that the EEG signal of the second electrode (to the right of the arrow) precedes the first electrode (to the left of the arrow). E) The median pre-ictal (t = −1953 to −1855 ms) and ictal (t = −98 to 0 ms) times are shown as a horizontal line within the box plots. During the ictal, but not pre-ictal period, the EEG signal in S1 significantly preceded that of the aM1 by a median of 2 ms (1 - 4 ms) on the left and 4 ms (4 – 5 ms) on the right. Right pM1 and S1 preceded the corresponding electrodes in the left hemisphere by 2 ms (pM1: 0 – 3 ms; S1: 0 – 5 ms). Asterisks mark Bonferroni-corrected P values, ***P < 0.001, **P < 0.01, *P < 0.05, ns = nonsignificant. N = 20 myoclonic seizures from 4 mice.
Figure 3
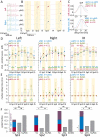
Figure 3. Corticocortical relationships during the spike and interspike periods of SWDs
Spontaneous SWDs were recorded with electrodes placed in the same regions as in Figure 1A. Panel A shows the EEG during a SWD. The region highlighted in the green box is depicted on an expanded time scale in panel B to show the first four spikes (Sp1-Sp4, yellow outline) and interspike periods (I1-I5). The vertical dashed lines through the spikes mark the leading spikes in the left (red) and right (blue) hemispheres and the lagging spikes in each hemisphere are marked by arrowheads that are outlined red (right) or blue (left) and filled with green to indicate a delay from S1 to aM1 or red to indicate a delay from S1 to pM1 . C) Cross-correlograms of the Sp4 spike from panel B among electrodes from the left (top) or right (bottom) hemispheres are shown with colored vertical dashed lines placed at the maximum of the corresponding R and projected to the time lag on the x-axis. D) Mean changes in R (ΔR ± 5-95% confidence intervals) between the pre-ictal period and either each spike or interspike period (Sp1-Sp4, I1-I5) among electrodes in the left and right hemisphere and between the corresponding electrodes in each hemisphere (interhemispheric, IH). Statistical significance is indicated by asterisks at the bottom of the plot. Panel E depicts the median lag times (error bars represent 25th and 75th percentiles); asterisks at the bottom of the graph indicate statistical significance relative to no lag (0 ms). In both hemispheres, there were significant lags in aM1 relative to S1 (green) in Sp2, Sp3, and Sp4. F) Graphs depict the fraction of spikes originating exclusively in S1, exclusively in M1, or diffusely in S1 and M1 (S1/M1). The portions of the S1 bars colored red, blue and purple represent the fraction of S1 spikes originating unilaterally from the left, right, and bilateral S1 regions, respectively. Bonferroni-corrected P values: ***P < 0.001, **P < 0.01, *P < 0.05, ns = nonsignificant. N = 35 SWDs from 4 mice.
Figure 4
Figure 4. Corticocortical relationships during the spike and interspike periods of myoclonic seizures
PTZ-evoked myoclonic seizures were recorded with electrodes placed in the same locations as in Figure 1A. A) EEG during a typical myoclonic seizure that is depicted on an expanded time scale in (B) showing the two spikes (Sp1, Sp2, yellow outline) and interspike periods (I1-I3) with dashed vertical lines (red = left; blue = right) placed through the leading spikes and arrowheads marking the trailing spikes outlined in red (right) or blue (left) and filled with green to indicate a delay from S1 to aM1 or red to indicate a delay from S1 to pM1. C) Cross-correlograms of the Sp1 and Sp2 spikes among electrodes from the left (top) or right (bottom) hemispheres are shown with colored vertical dashed lines placed at the maximum of the corresponding R and projected down to time lag producing the maximal R. D) Mean changes in R (ΔR ± 5-95% confidence intervals) between each spike/interspike period (I1-I3, Sp1,Sp2) and the pre-ictal period among electrodes in the left and right hemisphere and between the corresponding electrodes in each hemisphere (interhemispheric, IH). Statistical significance is indicated by asterisks at the bottom of the plot. Panel E depicts the median lag times (error bars depicting 25th and 75th percentiles) from the cross correlations shown in panel D; asterisks at the bottom of the graph indicate statistical significance relative to no lag (0 ms). F) Graphs depict the fraction of spikes originating in S1 or M1 brain regions or diffusely throughout the sensorimotor cortex (S1/M1). The portions of the S1 bars colored red, blue, and purple represent the fraction of S1 spikes originating from the left, right, and bilateral S1 regions, respectively. G) Comparison of the fraction of spikes initiating exclusively in S1 between SWDs (from Fig 3) and myoclonic seizure spikes. Bonferroni-corrected P values: ***P < 0.001, **P < 0.01, *P < 0.05, ns = nonsignificant. N = 33 myoclonic seizures form 4 mice.
Figure 5
Figure 5. Voltage changes in SWDs and myoclonic seizures
Panel A shows EEG samples from spontaneous SWDs (spikes 1-4, N = 33) and PTZ-evoked myoclonic seizures (spikes 1 and 2, N = 23). The EEG channels from the left anterior motor cortex (aM1, blue), posterior motor cortex (pM1, green), and somatosensory cortex (S1, red) are overlaid to demonstrate the similarities in spike duration and the differences in voltage. The plots in panel B depict the mean voltages (± 5-95% CI) from SWD spikes 1-4 and from myoclonic seizure spikes 1-2 in the left and right hemispheres. Graph bars are colored in sections corresponding to the voltages in aM1 (blue), pM1 (green), and S1 (red). A two-factor ANOVA compared the effects of spike (SWD spike 1-4 and myoclonic spikes 1-2) and brain region (aM1, pM1, S1) on voltage. Although there was no significant interaction between spike type with brain region on voltage (P ≥ 0.177), there were large independent effects (P < 0.001). In both hemispheres, myoclonic seizure spike 2 had higher voltage than SWD spikes 1-4 and myoclonic seizure spike 1 (P < 0.001). Myoclonic spike 1 also had greater voltage than the first two SWD spikes (P < 0.004) and, on the right, had greater voltage than the third and fourth SWD spike (P ≤ 0.011). SWD spike 1 had significantly lower voltage than spike 3 or 4 (P ≤ 0.007). For both SWD and myoclonic seizure spikes, the voltage in aM1 was significantly greater than that in pM1 or S1 (P ≤ 0.005). Panel C depicts the median voltage ratio between aM1 and S1 (top) and between pM1 and S1 (bottom). The ratio between pM1 and S1 was greater in myoclonic spike 2 than the first two SWD spikes in both hemispheres and the ratio between aM1 and S1 was greater in myoclonic spikes 1 and 2 than the first two SWD spikes on the left. Differences in the aM1 to S1 voltage ratios between the myoclonic and SWD seizure spikes on the right were not statistically significant (# P = 0.081).
Figure 6
Figure 6. Neuronal activation model in SWDs and myoclonic seizures
The gray crescents represent coronal sections through the S1 and M1 cortices. Blue arrows represent abundant S1 to M1 corticocortical connections. Triangles within the cortices depict populations of pyramidal neurons; red triangles indicate synchronously firing neurons and green triangles indicate relatively inactive neurons. Based on findings in rat SWDs, we placed the synchronously firing neurons in the lower cortical layers. The top row depicts seizure onset and the bottom row the spread of the seizure 2-5 ms after onset. Some SWDs (left column) and almost all myoclonic seizures (right column) start exclusively in S1 with populations of synchronously firing neurons only within this cortical region. After spread of the spike (2-5 ms later) synchronously firing neurons are present in M1. Other SWDs (middle column) have synchronously firing neurons in S1 and M1 at onset. The greater absolute voltage of myoclonic seizure spikes is represented by the increased number of synchronously firing neurons in the myoclonic seizure and the increased M1 to S1 ratio in myoclonic seizures is depicted by a higher ratio of synchronously firing neurons in M1 relative to S1.

Similar articles

Cited by

References

    1. Berg AT, Berkovic SF, Brodie MJ, et al. Revised terminology and concepts for organization of seizures and epilepsies: report of the ILAE Commission on Classification and Terminology, 2005-2009. Epilepsia. 2010;51:676–85. - PubMed
    1. Genton P, Thomas P, Kasteleijn-Nolst Trenite DG, Medina MT, Salas-Puig J. Clinical aspects of juvenile myoclonic epilepsy. Epilepsy Behav. 2013;28(Suppl 1):S8–14. - PubMed
    1. Martinez-Juarez IE, Alonso ME, Medina MT, et al. Juvenile myoclonic epilepsy subsyndromes: family studies and long-term follow-up. Brain. 2006;129:1269–80. - PubMed
    1. Senf P, Schmitz B, Holtkamp M, Janz D. Prognosis of juvenile myoclonic epilepsy 45 years after onset: Seizure outcome and predictors. Neurology. 2013;81:2128–33. - PubMed
    1. Mishra AM, Bai H, Gribizis A, Blumenfeld H. Neuroimaging biomarkers of epileptogenesis. Neurosci Lett. 2011;497:194–204. - PMC - PubMed

MeSH terms

LinkOut - more resources