. 2016 Oct;38(4):1055-62.
doi: 10.3892/ijmm.2016.2708. Epub 2016 Aug 18.

Hepatocyte growth factor inhibits hypoxia/reoxygenation-induced activation of xanthine oxidase in endothelial cells through the JAK2 signaling pathway

Affiliations

Hepatocyte growth factor inhibits hypoxia/reoxygenation-induced activation of xanthine oxidase in endothelial cells through the JAK2 signaling pathway

Ying Qian Zhang et al. Int J Mol Med. 2016 Oct.

Abstract

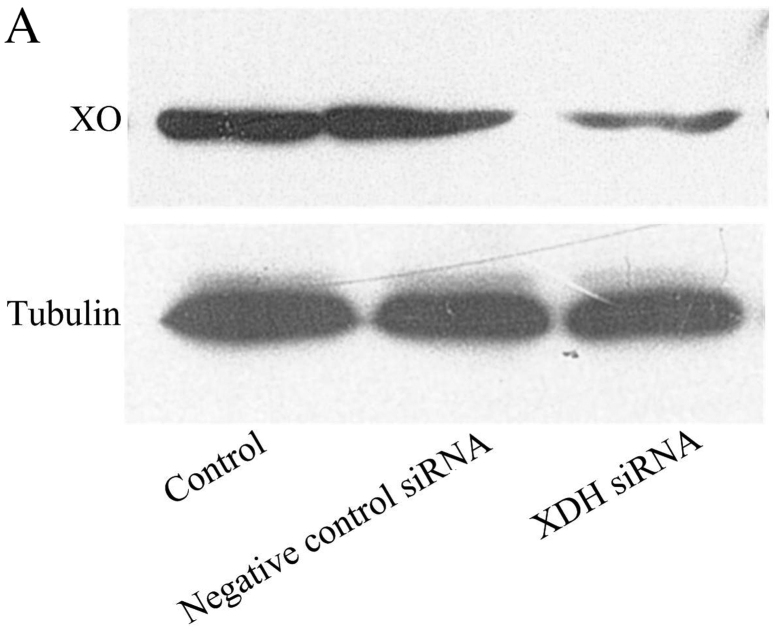
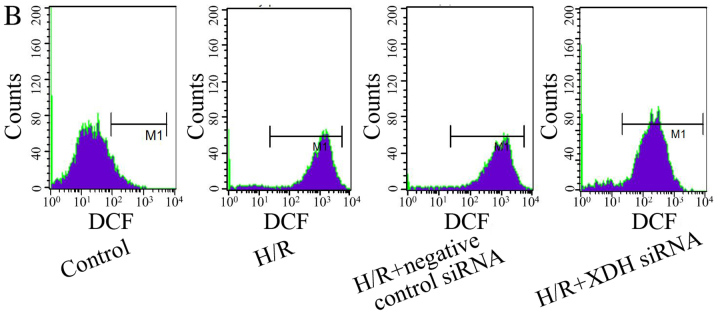
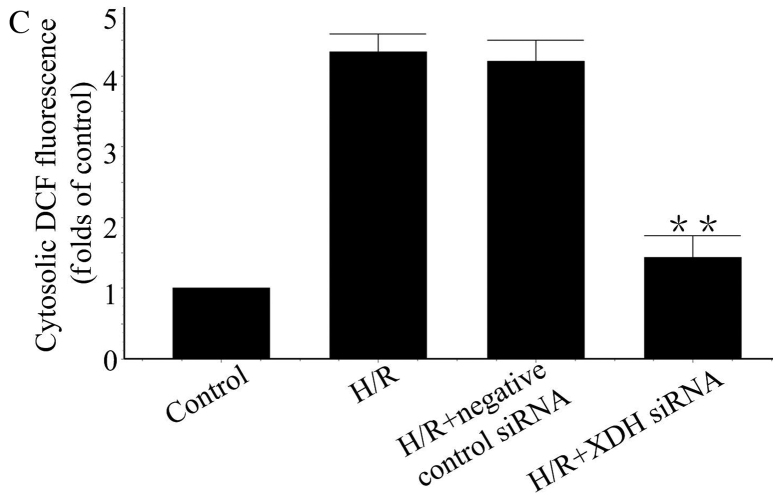
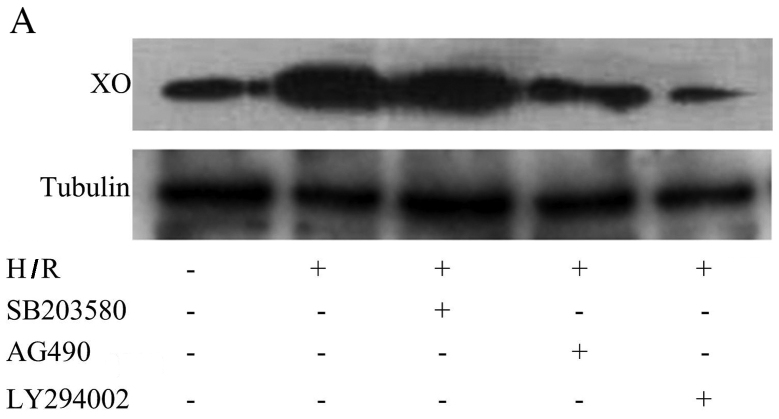
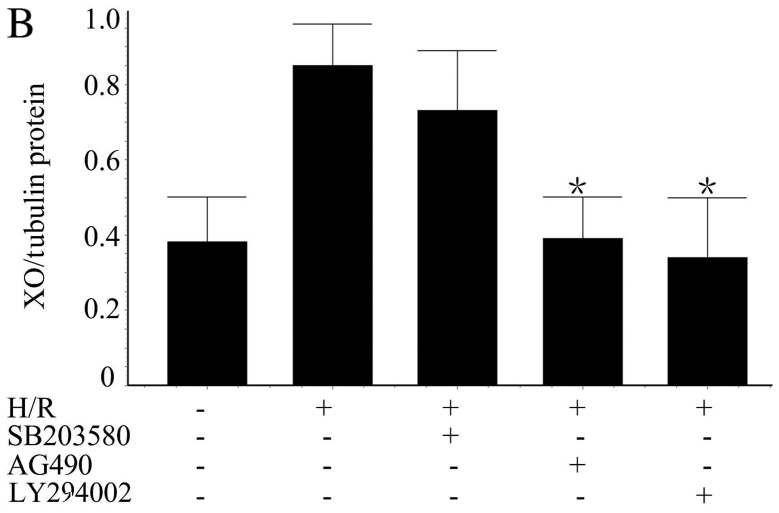
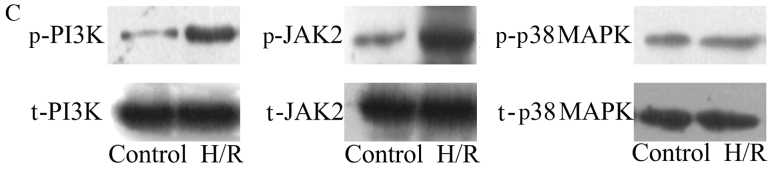
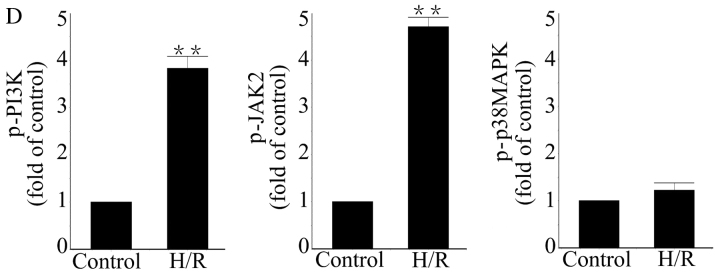
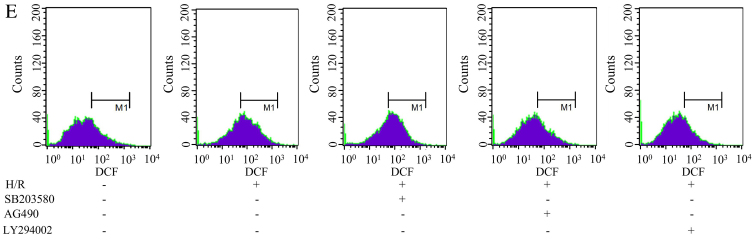
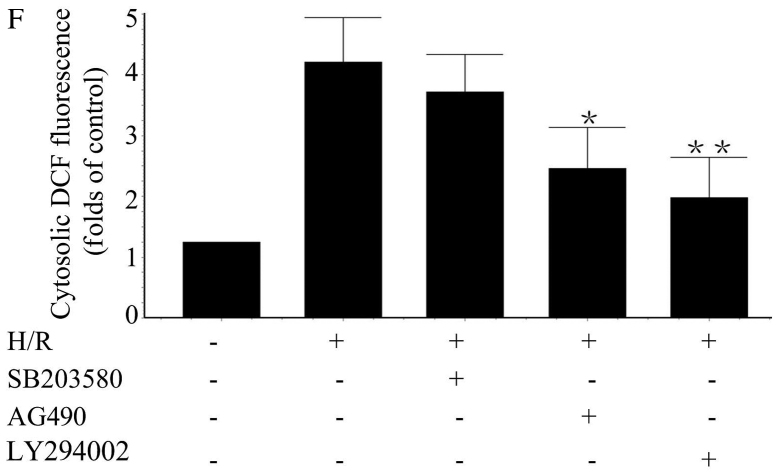
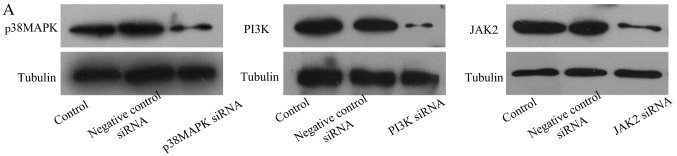
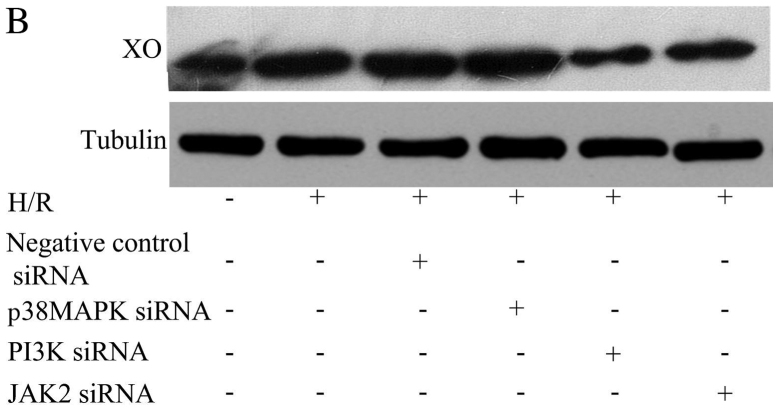
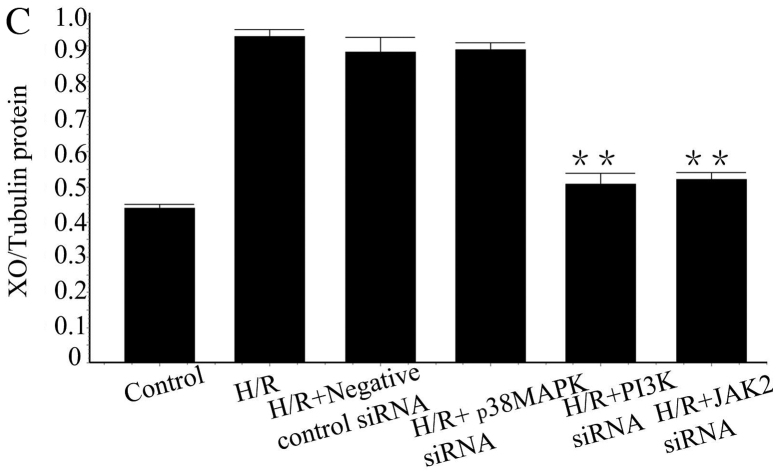
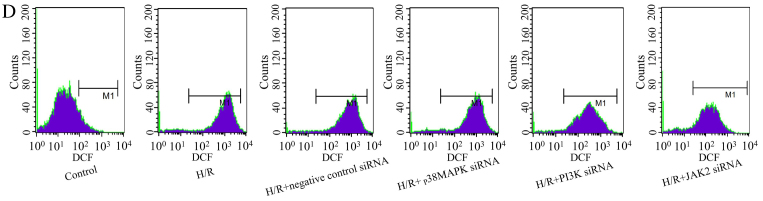
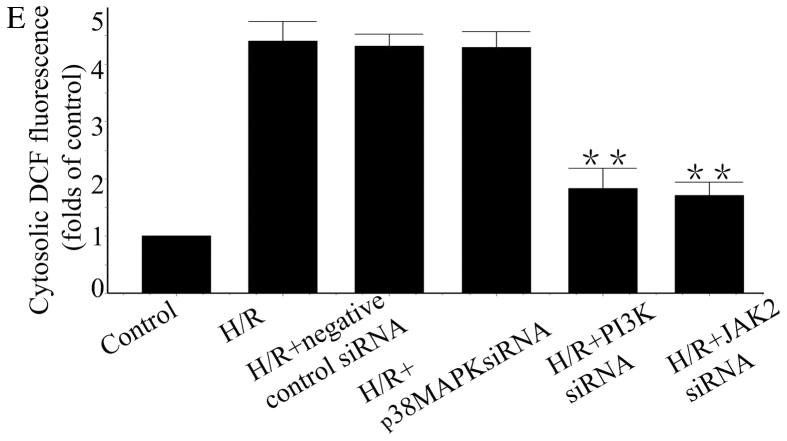
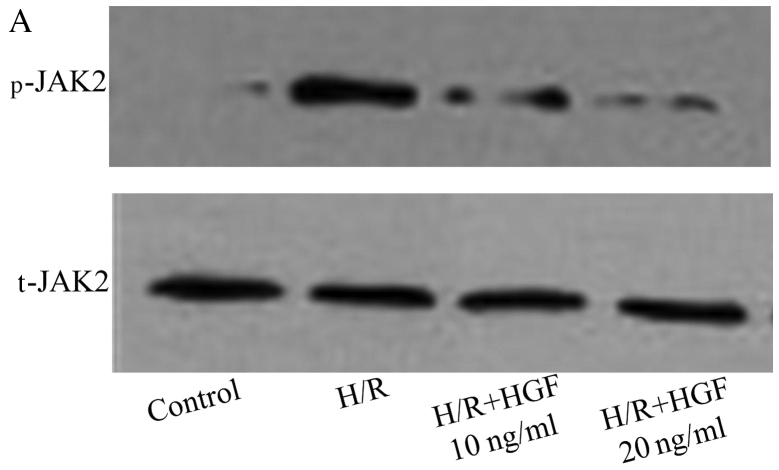
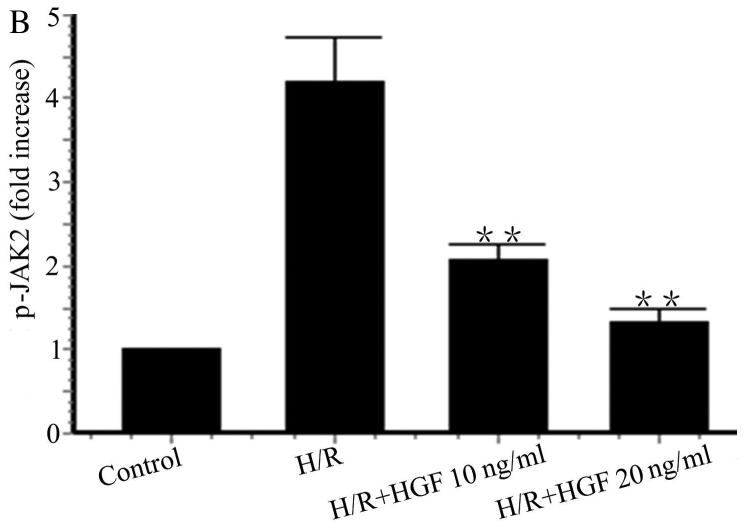
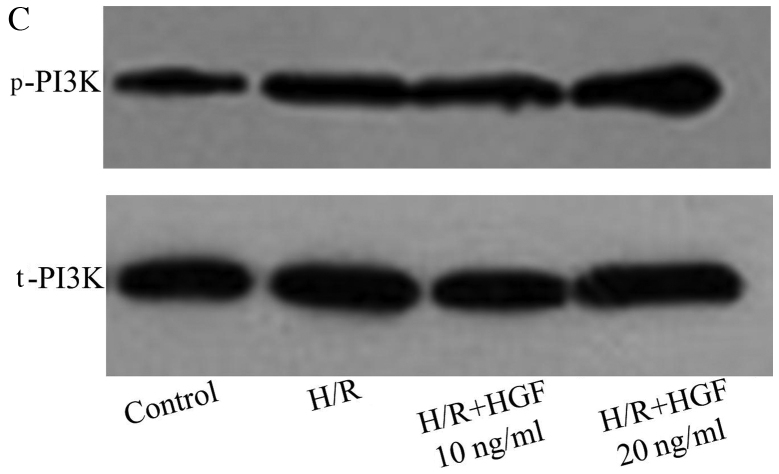
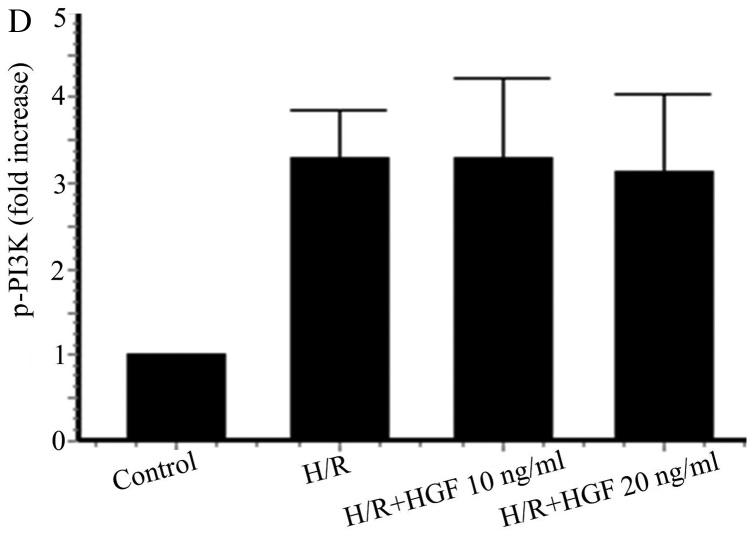
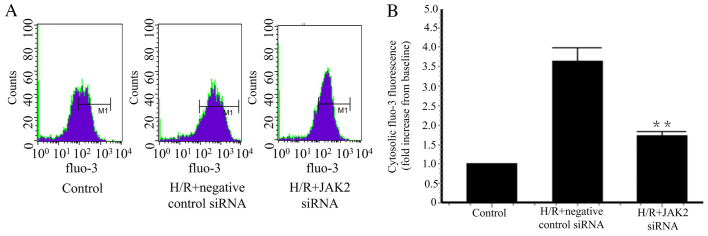
Vascular endothelial cells (ECs) appear to be one of the primary targets of hypoxia/reoxygenation (H/R) injury. In our previous study, we demonstrated that hepatocyte growth factor (HGF) exhibited a protective effect in cardiac microvascular endothelial cells (CMECs) subjected to H/R by inhibiting xanthine oxidase (XO) by reducing the cytosolic Ca2+ concentration increased in response to H/R. The precise mechanisms through which HGF inhibits XO activation remain to be determined. In the present study, we examined the signaling pathway through which HGF regulates Ca2+ concentrations and the activation of XO during H/R in primary cultured rat CMECs. CMECs were exposed to 4 h of hypoxia and 1 h of reoxygenation. The protein expression of XO and the activation of the phosphoinositide 3-kinase (PI3K), janus kinase 2 (JAK2) and p38 mitogen-activated protein kinase (p38 MAPK) signaling pathways were detected by western blot analysis. Cytosolic calcium (Ca2+) concentrations and reactive oxygen species (ROS) levels were measured by flow cytometry. The small interfering RNA (siRNA)‑mediated knockdown of XO inhibited the increase in ROS production induced by H/R. LY294002 and AG490 inhibited the H/R-induced increase in the production and activation of XO. The PI3K and JAK2 signaling pathways were activated by H/R. The siRNA‑mediated knockdown of PI3K and JAK2 also inhibited the increase in the production of XO protein. HGF inhibited JAK2 activation whereas it had no effect on PI3K activation. The siRNA-mediated knockdown of JAK2 prevented the increase in cytosolic Ca2+ induced by H/R. Taken together, these findings suggest that H/R induces the production and activation of XO through the JAK2 and PI3K signaling pathways. Furthermore, HGF prevents XO activation following H/R primarily by inhibiting the JAK2 signaling pathway and in turn, inhibiting the increase in cytosolic Ca2+.


Figures

Figure 1
Figure 1
Knockdown of xanthine oxidase (XO) attenuates the hypoxia/reoxygenation (H/R)-induced production of ROS. (A) Representative western blot of XO and tubulin expression in cardiac microvascular endothelial cells (CMECs) transfected with either no siRNA, negative control siRNA or xanthine dehydrogenase (XDH) siRNA. (B) Representative data for flow cytometric analysis of DCFH-DA-stained CMECs transfected with negative control siRNA or XDH siRNA, and compared with the H/R group. (C) Summary data (n=3 biological replicates) of flow cytometric analysis of DCFH-DA-stained CMECs under conditions of H/R transfected with negative control siRNA or XDH siRNA, and compared with the H/R group. **p<0.01 vs. H/R group.
Figure 1
Figure 1
Knockdown of xanthine oxidase (XO) attenuates the hypoxia/reoxygenation (H/R)-induced production of ROS. (A) Representative western blot of XO and tubulin expression in cardiac microvascular endothelial cells (CMECs) transfected with either no siRNA, negative control siRNA or xanthine dehydrogenase (XDH) siRNA. (B) Representative data for flow cytometric analysis of DCFH-DA-stained CMECs transfected with negative control siRNA or XDH siRNA, and compared with the H/R group. (C) Summary data (n=3 biological replicates) of flow cytometric analysis of DCFH-DA-stained CMECs under conditions of H/R transfected with negative control siRNA or XDH siRNA, and compared with the H/R group. **p<0.01 vs. H/R group.
Figure 2
Figure 2
PI3K and JAK2 signaling pathways are involved in the production and activation of xanthine oxidase (XO). (A) Representative western blot of XO and tubulin expression in cardiac microvascular endothelial cells (CMECs) following hypoxia/reoxygenation (H/R). LY294002 and AG490 significantly decreased the increase in the XO protein level induced by H/R. (B) Summary data (n=3 biological replicates) of western blot analysis of XO and tubulin expression in CMECs following H/R. LY294002, SB203580 and AG490 treatment group compared with H/R group. *p<0.05 vs. H/R group. PI3K and JAK2 signaling pathways are involved in the production and activation of xanthine oxidase (XO). (C) Representative western blots of phosphorylated (p-)PI3K, total (t-)PI3K, p-JAK2, t-JAK2, p-p38 MAPK and t-p38 MAPK expression in cardiac microvascular endothelial cells (CMECs) following hypoxia/reoxygenation (H/R). H/R activates the PI3K and JAK2 signaling pathways but not the p38 MAPK signaling pathway. (D) Summary data (n=3 biological replicates) of western blot analysis of p-PI3K, t-PI3K, p-JAK2, t-JAK2, p-p38 MAPK and t-p38 MAPK expression in CMECs. **p<0.01 vs. control group. (E) Representative data for flow cytometric analysis of DCFH-DA-stained CMECs following H/R. LY294002, SB203580 and AG490 treatment groups compared with H/R group. (F) Summary data (n=3 biological replicates) of flow cytometric analysis of DCFH-DA-stained CMECs following H/R. LY294002 (1 µM), SB203580 (30 µM) and AG490 (30 µM) treatment groups compared with H/R group. *p<0.05 vs. H/R group; **p<0.01 vs. H/R group.
Figure 2
Figure 2
PI3K and JAK2 signaling pathways are involved in the production and activation of xanthine oxidase (XO). (A) Representative western blot of XO and tubulin expression in cardiac microvascular endothelial cells (CMECs) following hypoxia/reoxygenation (H/R). LY294002 and AG490 significantly decreased the increase in the XO protein level induced by H/R. (B) Summary data (n=3 biological replicates) of western blot analysis of XO and tubulin expression in CMECs following H/R. LY294002, SB203580 and AG490 treatment group compared with H/R group. *p<0.05 vs. H/R group. PI3K and JAK2 signaling pathways are involved in the production and activation of xanthine oxidase (XO). (C) Representative western blots of phosphorylated (p-)PI3K, total (t-)PI3K, p-JAK2, t-JAK2, p-p38 MAPK and t-p38 MAPK expression in cardiac microvascular endothelial cells (CMECs) following hypoxia/reoxygenation (H/R). H/R activates the PI3K and JAK2 signaling pathways but not the p38 MAPK signaling pathway. (D) Summary data (n=3 biological replicates) of western blot analysis of p-PI3K, t-PI3K, p-JAK2, t-JAK2, p-p38 MAPK and t-p38 MAPK expression in CMECs. **p<0.01 vs. control group. (E) Representative data for flow cytometric analysis of DCFH-DA-stained CMECs following H/R. LY294002, SB203580 and AG490 treatment groups compared with H/R group. (F) Summary data (n=3 biological replicates) of flow cytometric analysis of DCFH-DA-stained CMECs following H/R. LY294002 (1 µM), SB203580 (30 µM) and AG490 (30 µM) treatment groups compared with H/R group. *p<0.05 vs. H/R group; **p<0.01 vs. H/R group.
Figure 3
Figure 3
PI3K siRNA and JAK2 siRNA downregulate the production and activation of xanthine oxidase (XO). (A) Representative western blots of p38 MAPK, PI3K, JAK2 and tubulin expression in cardiac microvascular endothelial cells (CMECs). (B) Representative western blot of XO and tubulin expression in CMECs following hypoxia/reoxygenation (H/R). PI3K siRNA-, p38 MAPK siRNA-, JAK2 siRNA- and negative control siRNA-transfected groups compared with H/R group. (C) Summary data (n=3 biological replicates) for western blot analysis of XO and tubulin expression in CMECs following H/R. PI3K siRNA-, p38 MAPK siRNA-, JAK2 siRNA- or negative control siRNA-transfected groups compared with H/R group. **p<0.01 vs. H/R group. (D) Representative flow cytometric analysis of DCFH-DA-stained CMECs after H/R. PI3K siRNA-, p38 MAPK siRNA-, JAK2 siRNA- or negative control siRNA-transfected groups compared with H/R group. (E) Summary data (n=3 biological replicates) for flow cytometric analysis of DCFH-DA-stained CMECs after H/R. PI3K siRNA-, p38 MAPK siRNA-, JAK2 siRNA- or negative control siRNA-transfected groups compared with H/R group. **p<0.01 vs. H/R group.
Figure 3
Figure 3
PI3K siRNA and JAK2 siRNA downregulate the production and activation of xanthine oxidase (XO). (A) Representative western blots of p38 MAPK, PI3K, JAK2 and tubulin expression in cardiac microvascular endothelial cells (CMECs). (B) Representative western blot of XO and tubulin expression in CMECs following hypoxia/reoxygenation (H/R). PI3K siRNA-, p38 MAPK siRNA-, JAK2 siRNA- and negative control siRNA-transfected groups compared with H/R group. (C) Summary data (n=3 biological replicates) for western blot analysis of XO and tubulin expression in CMECs following H/R. PI3K siRNA-, p38 MAPK siRNA-, JAK2 siRNA- or negative control siRNA-transfected groups compared with H/R group. **p<0.01 vs. H/R group. (D) Representative flow cytometric analysis of DCFH-DA-stained CMECs after H/R. PI3K siRNA-, p38 MAPK siRNA-, JAK2 siRNA- or negative control siRNA-transfected groups compared with H/R group. (E) Summary data (n=3 biological replicates) for flow cytometric analysis of DCFH-DA-stained CMECs after H/R. PI3K siRNA-, p38 MAPK siRNA-, JAK2 siRNA- or negative control siRNA-transfected groups compared with H/R group. **p<0.01 vs. H/R group.
Figure 4
Figure 4
Hepatocyte growth factor (HGF) inhibits activation of the JAK2 signaling pathway but has no effect on the PI3K signaling pathway. (A) Representative western blot of phosphorylated (p-)JAK2 and total (t-)JAK2 expression in cardiac microvascular endothelial cells (CMECs) following hypoxia/reoxygenation (H/R). HGF significantly decreased the H/R-induced activation of the JAK2 pathway. (B) Summary data (n=3 biological replicates) for western blot analysis of p-JAK2 and t-JAK2 in CMECs after H/R. HGF (10 and 20 ng/ml) treatment groups compared with H/R group. **p<0.01 vs. H/R group. (C) Representative western blot of p-PI3K and t-PI3K expression in CMECs after H/R. HGF had no effect on the PI3K signaling pathway. (D) Summary data (n=3 biological replicates) for western blot analysis of p-PI3K and t-PI3K expression in CMECs following H/R.
Figure 4
Figure 4
Hepatocyte growth factor (HGF) inhibits activation of the JAK2 signaling pathway but has no effect on the PI3K signaling pathway. (A) Representative western blot of phosphorylated (p-)JAK2 and total (t-)JAK2 expression in cardiac microvascular endothelial cells (CMECs) following hypoxia/reoxygenation (H/R). HGF significantly decreased the H/R-induced activation of the JAK2 pathway. (B) Summary data (n=3 biological replicates) for western blot analysis of p-JAK2 and t-JAK2 in CMECs after H/R. HGF (10 and 20 ng/ml) treatment groups compared with H/R group. **p<0.01 vs. H/R group. (C) Representative western blot of p-PI3K and t-PI3K expression in CMECs after H/R. HGF had no effect on the PI3K signaling pathway. (D) Summary data (n=3 biological replicates) for western blot analysis of p-PI3K and t-PI3K expression in CMECs following H/R.
Figure 5
Figure 5
JAK2 siRNA downregulates cytosolic calcium concentrations. (A) Representative data for flow cytometric analysis of fluo-3-stained cardiac microvascular endothelial cells (CMECs) following hypoxia/reoxygenation (H/R). JAK2 siRNA- or negative control siRNA-transfected groups compared with H/R group. (B) Summary data (n=3 biological replicates) for flow cytometric analysis of fluo-3-stained CMECs after H/R. JAK2 siRNA- or negative control siRNA-transfected group compared with H/R group. **p<0.01 vs. H/R group.

Similar articles

Cited by

References

    1. Yu G, Peng T, Feng Q, Tyml K. Abrupt reoxygenation of microvascular endothelial cells after hypoxia activates ERK1/2 and JNK1, leading to NADPH oxidase-dependent oxidant production. Microcirculation. 2007;14:125–136. doi: 10.1080/10739680601131218. - DOI - PubMed
    1. Zhang T, Yang D, Fan Y, Xie P, Li H. Epigallocatechin-3-gallate enhances ischemia/reperfusion-induced apoptosis in human umbilical vein endothelial cells via AKT and MAPK pathways. Apoptosis. 2009;14:1245–1254. doi: 10.1007/s10495-009-0391-1. - DOI - PubMed
    1. Dhar-Mascareño M, Cárcamo JM, Golde DW. Hypoxia-reoxygenation-induced mitochondrial damage and apoptosis in human endothelial cells are inhibited by vitamin C. Free Radic Biol Med. 2005;38:1311–1322. doi: 10.1016/j.freeradbiomed.2005.01.017. - DOI - PubMed
    1. Pearlstein DP, Ali MH, Mungai PT, Hynes KL, Gewertz BL, Schumacker PT. Role of mitochondrial oxidant generation in endothelial cell responses to hypoxia. Arterioscler Thromb Vasc Biol. 2002;22:566–573. doi: 10.1161/01.ATV.0000012262.76205.6A. - DOI - PubMed
    1. Jang H-J, Koo BK, Lee HS, Park JB, Kim JH, Seo MK, Yang HM, Park KW, Nam CW, Doh JH, Kim HS. Safety and efficacy of a novel hyperaemic agent, intracoronary nicorandil, for invasive physiological assessments in the cardiac catheterization laboratory. Eur Heart J. 2013;34:2055–2062. doi: 10.1093/eurheartj/eht040. - DOI - PubMed

MeSH terms