. 2016 Sep 19;213(10):2113-28.
doi: 10.1084/jem.20151613. Epub 2016 Aug 29.

Pyroptosis triggers pore-induced intracellular traps (PITs) that capture bacteria and lead to their clearance by efferocytosis

Affiliations

Pyroptosis triggers pore-induced intracellular traps (PITs) that capture bacteria and lead to their clearance by efferocytosis

Ine Jorgensen et al. J Exp Med. .

Abstract

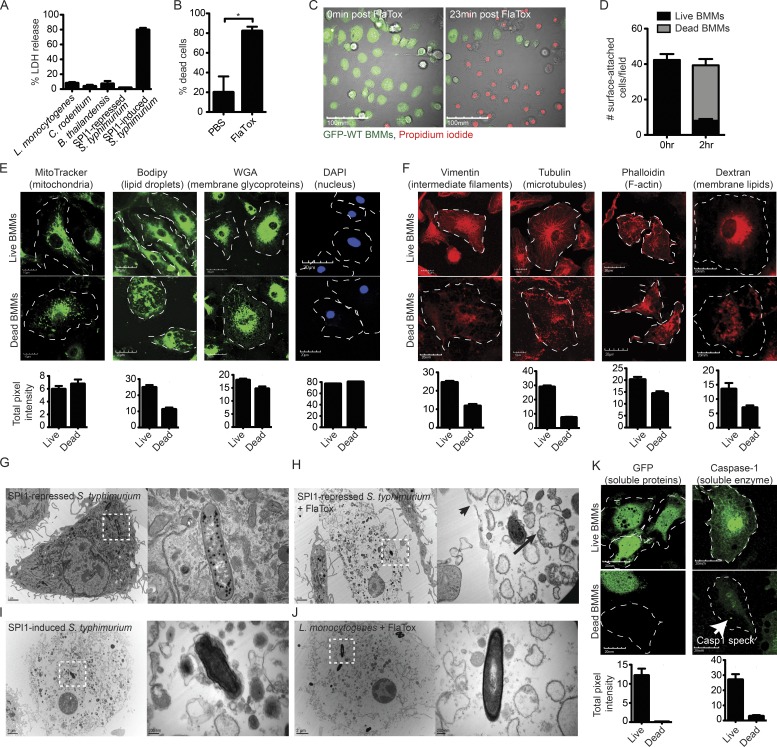
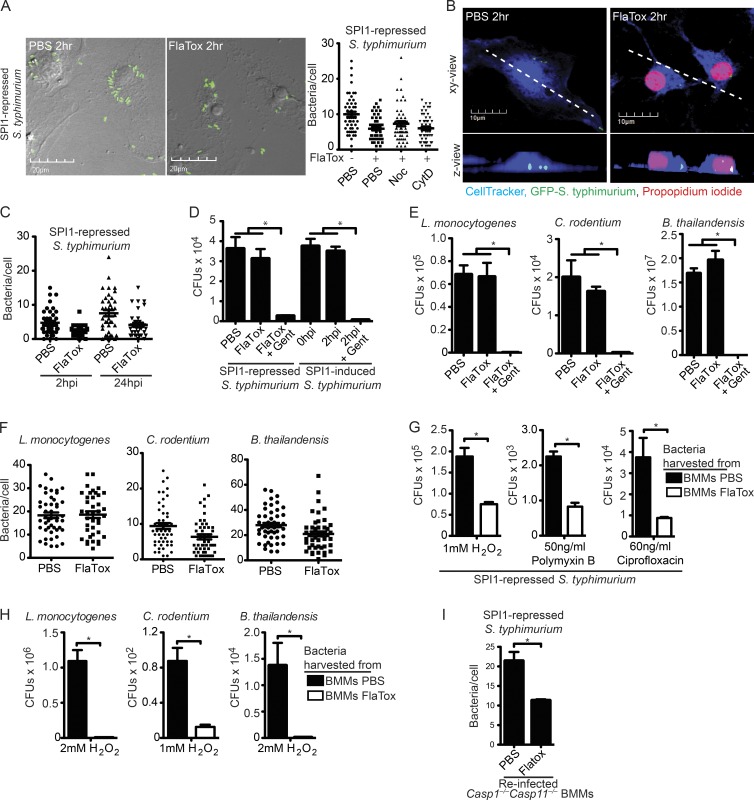
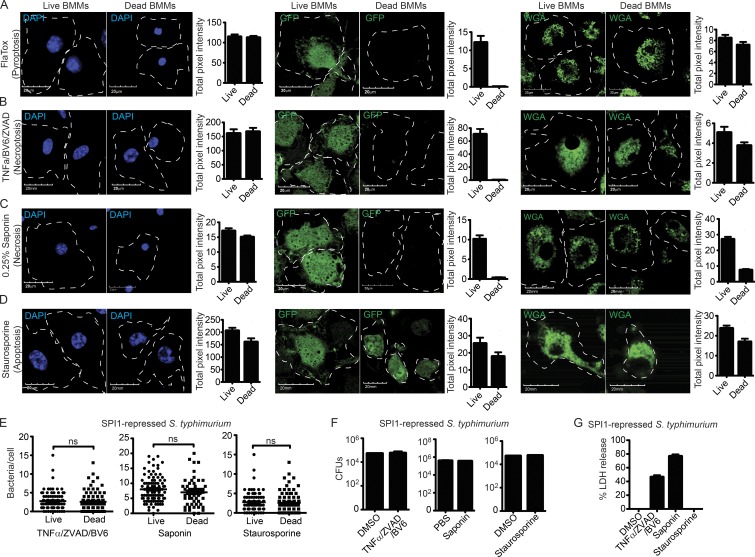
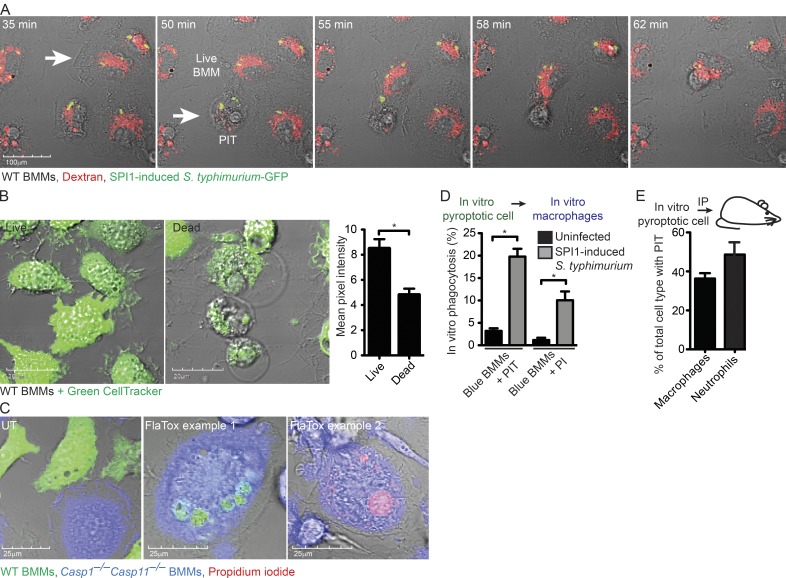
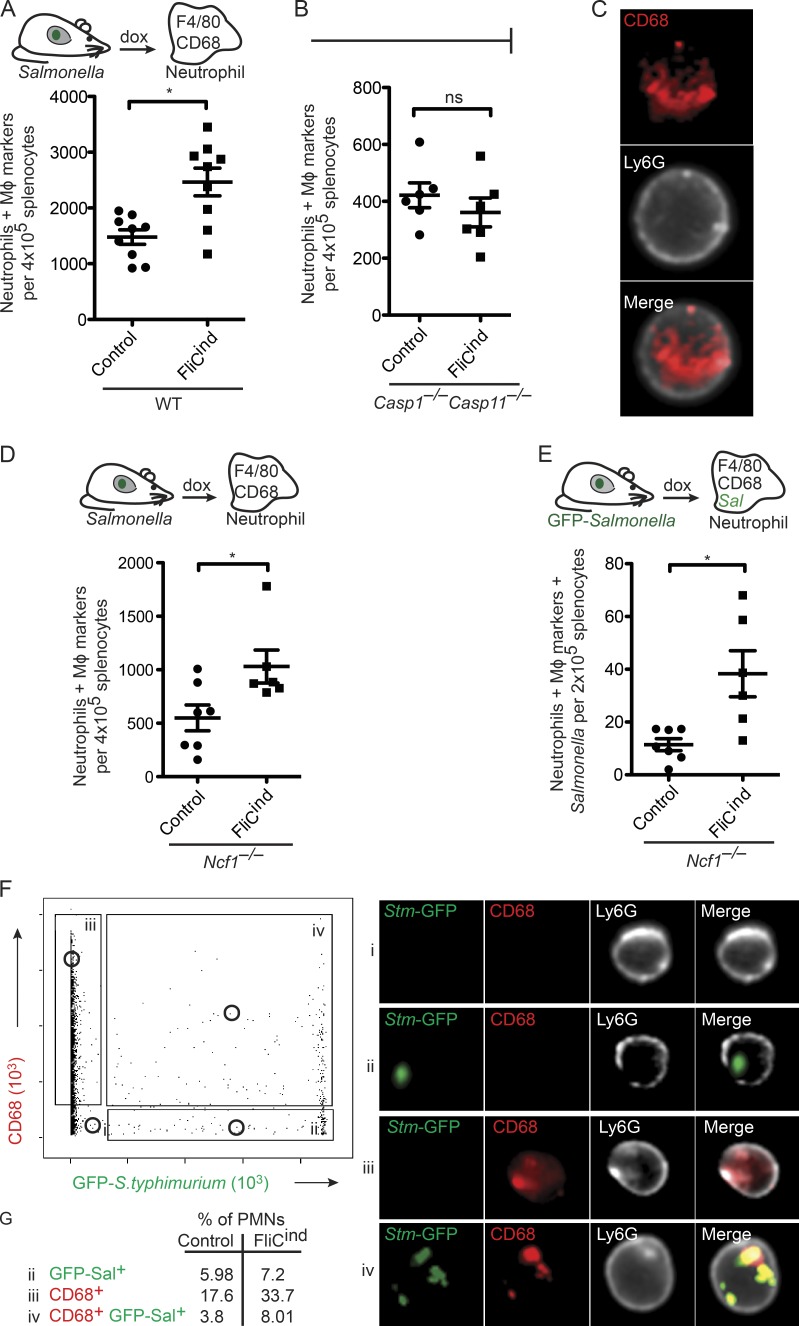
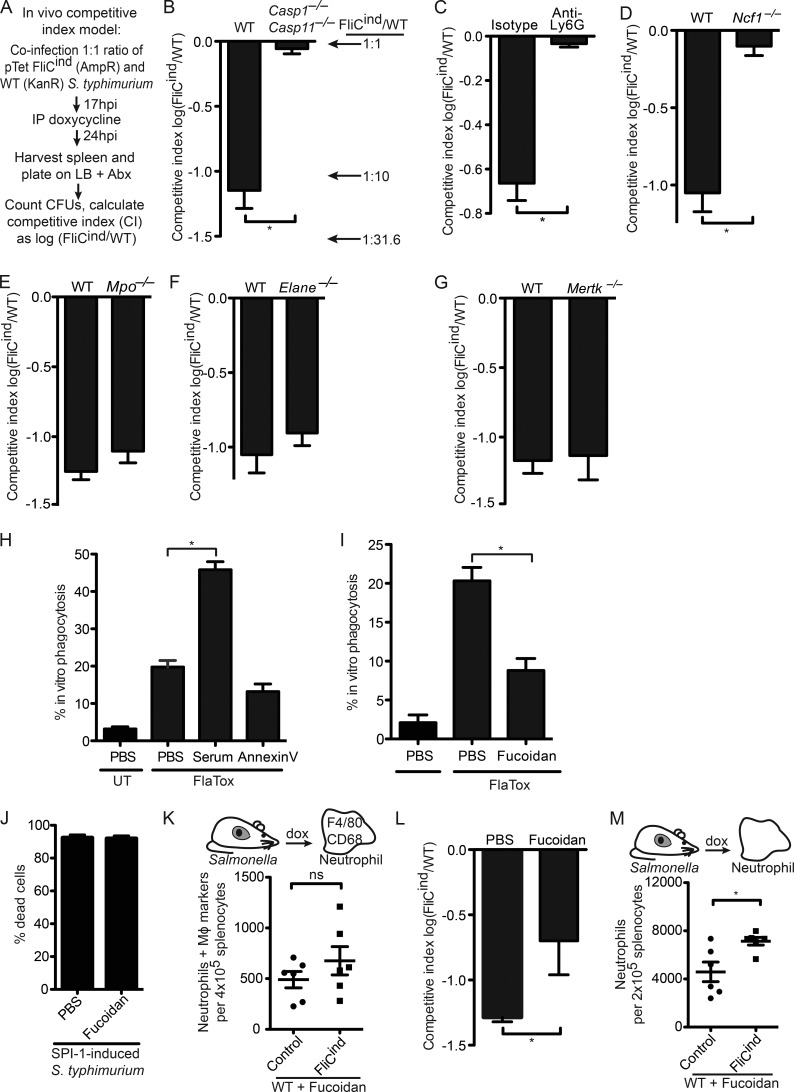
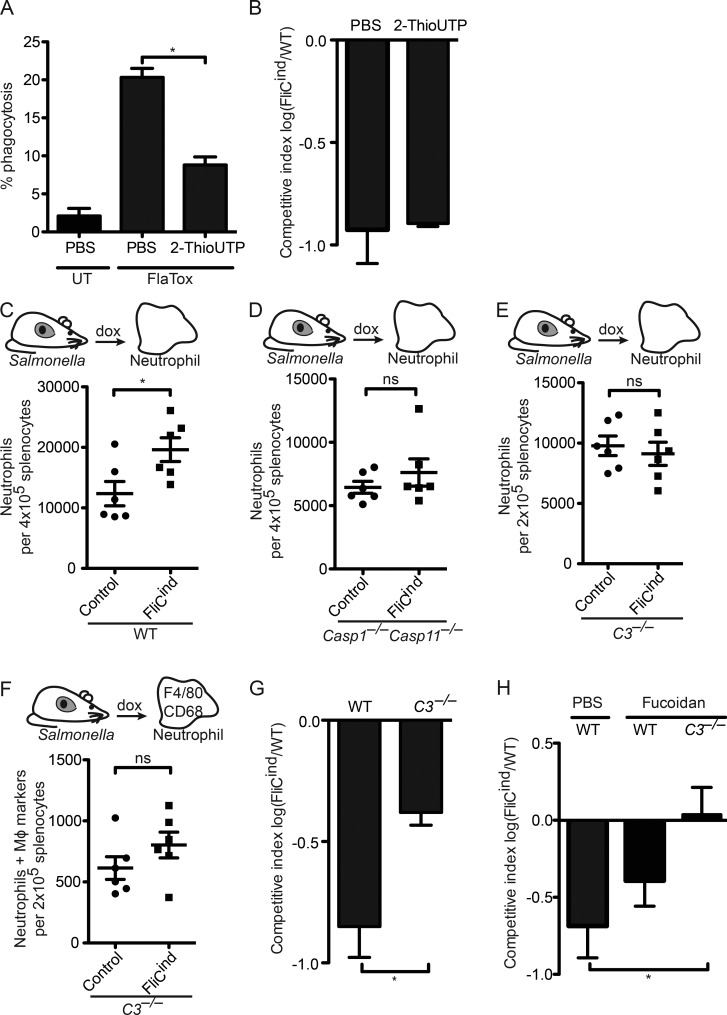
Inflammasomes activate caspase-1 in response to cytosolic contamination or perturbation. This inflammatory caspase triggers the opening of the GSDMD pore in the plasma membrane, resulting in lytic cell death called pyroptosis. We had previously assumed that pyroptosis releases intracellular bacteria to the extracellular space. Here, we find that viable bacteria instead remain trapped within the cellular debris of pyroptotic macrophages. This trapping appears to be an inevitable consequence of how osmotic lysis ruptures the plasma membrane, and may also apply to necroptosis and some forms of nonprogrammed necrosis. Although membrane tears release soluble cytosolic contents, they are small enough to retain organelles and bacteria. We call this structure the pore-induced intracellular trap (PIT), which is conceptually parallel to the neutrophil extracellular trap (NET). The PIT coordinates innate immune responses via complement and scavenger receptors to drive recruitment of and efferocytosis by neutrophils. Ultimately, this secondary phagocyte kills the bacteria. Hence, caspase-1-driven pore-induced cell death triggers a multifaceted defense against intracellular bacteria facilitated by trapping the pathogen within the cellular debris. Bona fide intracellular bacterial pathogens, such as Salmonella, must prevent or delay pyroptosis to avoid being trapped in the PIT and subsequently killed by neutrophils.


Figures

Figure 1.
Figure 1.
The pyroptotic cell corpse consists of insoluble cellular contents. (A) WT BMMs were infected at an MOI of 20–25 for 2.5 h with L. monocytogenes, C. rodentium, B. thailandensis, or SPI1-repressed S. Typhimurium (under conditions where minimal inflammasome detection is observed) or with SPI-1–induced S. Typhimurium (which activates the NLRC4 inflammasome). Cell lysis was determined by LDH release. (B) WT BMMs were treated with PBS or 3 µg/ml FlaTox for 2 h. Percentage cell death was determined by counting based on morphology in DIC microscopy, which was equivalent to counting based on PI positivity (not depicted; C–F and K). BMMs were infected with SPI1-induced WT S. Typhimurium for 2.5 h (E) or treated with 3 µg/ml FlaTox for 2 h (C, D, F, and K), and then imaged by confocal microscopy. MitoTracker, Bodipy, WGA, dextran, and GFP labels were endogenous or added before treatment, and live cells were imaged. For vimentin, tubulin, phalloidin, caspase-1, and DAPI, cells were fixed and stained before imaging. Caspase-1–positive-speck in dead BMMs is indicated by a white arrow (K). Dead BMMs were identified by PI-staining (E and K) or DIC (F). Images are representative; quantitation of cellular markers was done in ImageJ by measuring the total intensity of ∼50 individual live and dead BMMs at time 0 and 2.5 h after infection or 2 h after FlaTox. (D) To determine the number of surface-attached cells before and after pyroptosis, the number of GFP (live) and PI (dead) cells from (C) were counted at time 0 and 2 h after FlaTox. (G–J) Electron micrographs of WT BMMs were infected with SPI1-repressed S. Typhimurium or L. monocytogenes followed by 3 µg/ml FlaTox treatment (G, H, and J) or infected with SPI1-induced S. Typhimurium (I). Frank rupture of the plasma membrane (arrowhead) and mitochondria with collapsed cristae (arrow). Dotted squares show individual bacteria, with greater magnification on right panel. Data are representative of two (A–F and K) and one (G–J) experiments. Error bars represent SE. P-values were determined by a two-tailed Student’s t test; *, P < 0.05.
Figure 2.
Figure 2.
The pyroptotic cell corpse traps live bacteria. (A–I) WT BMMs were infected with the indicated inflammasome-nonactivating bacteria, followed by FlaTox as in Fig. 1. Alternately, they were infected with inflammasome-activating SPI-1–induced S. Typhimurium as in Fig. 1. (A, C, F, and I) To examine bacterial association with pyroptotic cell debris, the number of bacteria/cell within live (PBS) and dead (FlaTox) BMMs was quantified by counting cell-associated bacteria in ∼100 cells from six fields in a single plane of images acquired by confocal microscopy. (D, E, G, and H) To determine bacterial viability, CFUs were enumerated by plating. (A) Nocodazole or cytochalasin D were added during FlaTox treatment. (B) BMMs were labeled with CellTracker Blue. Z-stacks acquired by confocal-microscopy were used for 3D reconstruction of live and dead BMMs and to generate the z view. (C) Longer resident time within the BMM does not alter the bacterial viability after pyroptosis. (D–E) Gentamicin was added during FlaTox treatment. (G and H) Infected, treated cells were then lysed and cell lysates were added to LB media and incubated in the presence of 1 or 2 mM H2O2, 50 ng/ml Polymyxin B, or 60 ng/ml ciprofloxacin for 2 h, and CFUs were enumerated by plating. (I) Cells were collected by scraping, and then lysed with a 30-gauge needle. Casp1−/−Casp11−/− BMMs were infected with cellular lysates, washed, treated with gentamicin for 2 h, fixed, and imaged. The number of Casp1−/−Casp11−/− BMMs with GFP-containing bacteria was determined for ∼100 individual cells from 10 fields. All data are representative of three individual experiments. All error bars represent SE. P-values were determined by a two-tailed Student’s t test; *, P < 0.05.
Figure 3.
Figure 3.
Necrosis and necroptosis result in similar cell corpses. (A–G) WT BMMs were treated with (A) 3 µg/ml FlaTox, (B) 50 ng/ml TNF, 10 µM ZVAD, and 5 µM BV6, (C) 0.05% Saponin, or (D) 1 µM staurosporine for 2 h. (A–D) WGA-labeled, GFP-expressing, or fixed and DAPI-stained cells were imaged by confocal microscopy at 0 and 2 h after treatment. Quantitation of cellular markers was done in ImageJ by measuring the total intensity of ∼50 individual live and dead BMMs. (E–G) BMMs were infected with SPI-1 repressed GFP-expressing S. Typhimurium for 2.5 h before indicated treatment. (E) The number of bacteria/cell or viable CFU were determined as in Fig. 2. (G) Cell lysis by LDH release. Data are representative of two (A–D) and three (E–G) individual experiments. Error bars represent SE. P-values were determined by a two-tailed Student’s t test.
Figure 4.
Figure 4.
Efferocytosis of PIT and associated bacteria in vitro. (A) Dextran–Alexa Fluor 555–labeled WT BMMs were infected with SPI1-induced mCherry-expressing S. Typhimurium as in Video 4 and imaged by live cell microscopy. Images are stills from Video 4 at indicated time points after infection. White arrow indicated a live BMM that efferocytoses a pyroptotic BMM denoted by the arrowhead. (B) WT BMMs were treated with PBS or 3 µg/ml FlaTox for 2 h, labeled with Green CellTracker and quantitated in ImageJ by measuring the total intensity of ∼50 individual live and dead BMMs. (C and D) WT BMMs (Green CellTracker) and Casp1−/−Casp11−/− BMMs (Blue CellTracker) were co-cultured and treated with 3 µg/ml FlaTox in PI-containing media while imaged by live cell confocal microscopy. The in vitro percentage of phagocytosis was determined by quantifying the percentage of Casp1−/−Casp11−/− BMMs (Blue) that contain CellTracker Green–BMM debris or PI-positive nuclei. (E) CellTracker Orange–labeled and FlaTox-treated WT BMMs were injected i.p into Casp1−/−Casp11−/− mice (n = 5). The percentage of live peritoneal macrophages (CD45+ CD11b+ Ly6G F4/80+) and neutrophils (CD45+ CD11b+ Ly6G+ F4/80) with CellTracker Orange-positive debris was determined by staining and analyzing the peritoneal wash by flow cytometry. All data are representative of three individual experiments. Error bars represent SE. P-values were determined by a two-tailed Student’s t test; *, P < 0.05.
Figure 5.
Figure 5.
Efferocytosis of PIT and entrapped bacteria in vivo. Spleens from mice infected i.p. with control or FliCind GFP–S. Typhimurium for 24 h and treated with doxycycline for 3.5 h, were harvested, prepared for flow cytometry, and stained. Neutrophils with intracellular macrophage (MΦ) markers (CD45+ CD11b+ Ly6G+high CD68+ F4/80+; A, B, and D), and neutrophils with intracellular MΦ markers and GFP–S. Typhimurium (CD45+ CD11b+ Ly6G+high CD68+ F4/80+ GFP+; E) were identified by flow cytometry on an LSR II. (C, F, and G) Neutrophils were isolated by purification of Ly6G+ cells from spleen, stained, and analyzed by Amnis ImageStream. Experimental data from WT (six mice per group) and Ncf1−/− mice (seven per control group and six per FliCind group) was pooled from two individual experiments. Data from six Casp1−/−Casp11−/− mice is representative of two individual experiments. The numbers of mice in all groups are noted in figure. Five Casp1−/−Casp11−/− mice were used per group and six animals per group were used for all other experiments. Control and FliCind GFP–S. Typhimurium strains are flagellin (flgB) mutants. Gating was performed using FlowJo (A, B, D, and E) or IDEAS (C, F, and G). P-values were determined by a two-tailed Student’s t test; *, P < 0.05.
Figure 6.
Figure 6.
SRs mediate efferocytosis of PITs in vivo. (A–G and L) Mice were infected with 1:1 ratio of FliCind AmpR and WT KanR S. Typhimurium i.p. for 17 h, and treated with doxycycline. Spleens were harvested 7 h later. (C) Mice were injected with isotype or anti-Ly6G antibodies and infected 12 h after antibody treatment. (L) Mice were treated with Fucoidan at the same time as doxycycline. (H and I) WT BMMs (CellTracker Green) and Casp-1−/−Casp-11−/− BMMs (CellTracker Blue) were co-cultured, imaged and analyzed as in Fig. 4 C, and treated with serum (H), Annexin V (H), or fucoidan (I). (J) WT BMMs were infected with SPI1-induced S. Typhimurium as in Fig. 1 and treated with PBS or fucoidan for 2 h. Percentage dead cells was determined as in Fig. 1 B. (K and M) Spleens from mice (six animals per group) infected i.p with control or FliCind GFP–S. Typhimurium for 24 h and treated with doxycycline and fucoidan for 3.5 h, were harvested, prepared for flow cytometry and stained. Neutrophils with intracellular macrophage markers (CD45+ CD11b+ Ly6G+high CD68+ F4/80+) were identified by flow cytometry. All gating was performed using FlowJo. Data are representative of three individual experiments (A–J and L) or was pooled from two individual experiments (K and M). All error bars represent SE. P-values were determined by a two-tailed Student’s t test; *, P < 0.05.
Figure 7.
Figure 7.
Complement facilitates efferocytosis of PITs in vivo. (A) WT BMMs (CellTracker Green) and Casp-1−/−Casp-11−/− BMMs (CellTracker Blue) were co-cultured, imaged, and analyzed as in Fig. 4 C, and treated with 2-ThioUTP. (B, G, and H) Mice (five animals per group) were infected with 1:1 ratio of FliCind AmpR and WT KanR S. Typhimurium IP for 17 h before doxycycline, fucoidan, and 2-ThioUTP injection; organs were harvested 7 h later. (C–F) Spleens from mice (six animals per group) infected IP with control or FliCind GFP–S. Typhimurium for 24 h and treated with doxycycline and fucoidan for 3.5 h were harvested and prepared for flow cytometry. Neutrophils (CD45+ CD11b+ Ly6G+high; C–E) and neutrophils with intracellular macrophage markers (CD45+ CD11b+ Ly6G+high CD68+ F4/80+; F) were identified by flow cytometry. All gating was performed using FlowJo. All data are representative of two. All error bars represent SE. P-values were determined by a two-tailed Student’s t test (G–I) or two-way ANOVA (D–E); *, P < 0.05.

Similar articles

Cited by

References

    1. Aachoui Y., Leaf I.A., Hagar J.A., Fontana M.F., Campos C.G., Zak D.E., Tan M.H., Cotter P.A., Vance R.E., Aderem A., and Miao E.A.. 2013. Caspase-11 protects against bacteria that escape the vacuole. Science. 339:975–978. 10.1126/science.1230751 - DOI - PMC - PubMed
    1. Aachoui Y., Kajiwara Y., Leaf I.A., Mao D., Ting J.P., Coers J., Aderem A., Buxbaum J.D., and Miao E.A.. 2015. Canonical inflammasomes drive IFN-γ to prime caspase-11 in defense against a cytosol-invasive bacterium. Cell Host Microbe. 18:320–332. 10.1016/j.chom.2015.07.016 - DOI - PMC - PubMed
    1. Brennan M.A., and Cookson B.T.. 2000. Salmonella induces macrophage death by caspase-1-dependent necrosis. Mol. Microbiol. 38:31–40. 10.1046/j.1365-2958.2000.02103.x - DOI - PubMed
    1. Brinkmann V., Reichard U., Goosmann C., Fauler B., Uhlemann Y., Weiss D.S., Weinrauch Y., and Zychlinsky A.. 2004. Neutrophil extracellular traps kill bacteria. Science. 303:1532–1535. 10.1126/science.1092385 - DOI - PubMed
    1. Canton J., Neculai D., and Grinstein S.. 2013. Scavenger receptors in homeostasis and immunity. Nat. Rev. Immunol. 13:621–634. 10.1038/nri3515 - DOI - PubMed

Publication types

Substances