. 2016 Sep 13;113(37):E5501-10.
doi: 10.1073/pnas.1606951113. Epub 2016 Aug 29.

Dopaminergic inputs in the dentate gyrus direct the choice of memory encoding

Affiliations

Dopaminergic inputs in the dentate gyrus direct the choice of memory encoding

Huiyun Du et al. Proc Natl Acad Sci U S A. .

Abstract

Rewarding experiences are often well remembered, and such memory formation is known to be dependent on dopamine modulation of the neural substrates engaged in learning and memory; however, it is unknown how and where in the brain dopamine signals bias episodic memory toward preceding rather than subsequent events. Here we found that photostimulation of channelrhodopsin-2-expressing dopaminergic fibers in the dentate gyrus induced a long-term depression of cortical inputs, diminished theta oscillations, and impaired subsequent contextual learning. Computational modeling based on this dopamine modulation indicated an asymmetric association of events occurring before and after reward in memory tasks. In subsequent behavioral experiments, preexposure to a natural reward suppressed hippocampus-dependent memory formation, with an effective time window consistent with the duration of dopamine-induced changes of dentate activity. Overall, our results suggest a mechanism by which dopamine enables the hippocampus to encode memory with reduced interference from subsequent experience.

Keywords: channelrhodopsin-2; dopamine; temporal difference learning; theta oscillation.


Conflict of interest statement

The authors declare no conflict of interest.

Figures
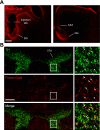
Fig. S1.
Fig. S1.
Photomicrographs of FG retrogradely traced neurons double-labeled by TH immunohistochemistry. (A, Left) FG signals at the injection site in the hippocampus. (Right) Image was taken from a section slightly ventral to the injection site. (Scale bar: 200 μm.) (B, Top Left) Sample image of FG-traced neurons. (Middle Left) The same horizontal section of TH+ neurons in the midbrain. (Bottom Left) Merged image showing colocalization of FG label with TH staining. (Right) Higher magnification of the boxed region in each left panel. Arrows show double-labeled cells. (Scale bar: 500 μm.)
Fig. 1.
Fig. 1.
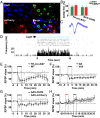
Optical stimulation of dopaminergic terminals in the DG induces LTD-like changes at PP–DG synapses. (A) Representative images showing coexpression of ChR2–mCherry and TH in the VTA of TH-Cre mice infected with AAV-DIO–ChR2–mCherry. (B) Quantification showing the overlap of ChR2+TH+ cells with TH+ or ChR2+ cells in the VTA (from seven TH-cre;Ai27 mice and seven AAV–ChR2 mice). Error bars indicate SEM. (C) Typical superimposed spike waveforms of one ChR2-expressing neuron in the VTA activated by blue light. (Scale bars: 20 μV and 200 μS.) (D) Single-unit recordings in the VTA. (Upper) The raster plot shows the spike times for five optical stimulation trials (473 nm, 5 ms, 20 Hz). (Lower) The peristimulus time histogram shows the averaged response across all repetitions (50-ms bins). (E) Summary data of the effects of light stimulation (5-ms pulses at 20 Hz for 5 min; black horizontal bar) in the DG of TH-cre;Ai27 mice and their control littermates (ANOVA: P < 0.0001; TH-cre;Ai27: n = 7, WT: n = 4). Data represent the fEPSP amplitudes normalized by the mean values before optical stimulation and averaged over 2-min bins for each experiment. Error bars indicate SEM. (F) Summary plot of changes in fEPSPs evoked by PP stimulation after DA or vehicle (Veh) infusion (black horizontal bar) into the DG of WT animals (ANOVA: P < 0.0001; DA: n = 11, vehicle: n = 8). Data represent the fEPSP amplitudes normalized by the mean values before DA or vehicle infusion and averaged over 2-min bins for each experiment. Error bars indicate SEM. (G) Summary data of the effects of light stimulation (5-ms pulses at 20 Hz for 5 min; black horizontal bar) in the DG of TH-cre mice infused with AAV–ChR2 or control viral vectors (ANOVA: P < 0.0001; AAV–ChR2: n = 5, AAV–mCherry: n = 6). Data are presented as in E. (H) Photostimulation (black horizontal bar) following infusion of DA receptor antagonists (red horizontal bar) into the DG does not induce significant changes in the fEPSP amplitude (n = 7). Data are presented as in E.
Fig. S2.
Fig. S2.
Stimulation and recording positions in the DG of anesthetized mice. (A) Confocal images showing the presence of ChR2-tdTomato–expressing terminals (arrowheads) in the DG. (Scale bars: 40 μm.) (B) Sample images showing the tracks of stimulating electrode (Left) and tetrode-optic fiber assembly in the DG (Right). Arrowheads indicate the electrode tips. (Scale bars: 400 μm.)
Fig. S3.
Fig. S3.
NE effect and ChR2 expression in noradrenergic neurons. (A) In comparison with time-matched saline controls, bath application of NE (black horizontal bar) induces a small potentiation of PP-evoked fEPSPs in the DG (ANOVA: P < 0.0001; NE group, n = 5; vehicle group, n = 4). Data represent the fEPSP slopes normalized against the average of baseline traces (dotted line) and binned over 2-min spans. Error bars indicate ± SEM. (B) Representative images showing coexpression of ChR2-tdTomato and DβH in the LC of TH-cre;Ai27 mice. (Scale bar: 20 μm.) (C) Quantification showing the overlap of ChR2+DβH+ cells with DβH+ or ChR2+ cells in the LC. Error bars indicate SEM.
Fig. 2.
Fig. 2.
Prelearning optical stimulation causes changes in DG network oscillations and impairs memory formation. (A) Averaged power spectrogram of LFPs in WT littermates exposed to light stimulation (n = 9). The white curve indicates the total power of the theta band LFP signal (4–12 Hz). Dashed lines mark the time of blue light delivery (5-ms pulses at 20 Hz for 5 min). The horizontal white bar marks the time periods used for quantitative comparison of LFP powers between 4 and 12 Hz. (B) Averaged power spectrogram of LFPs in TH-Cre mice transduced with AAV-DIO–mCherry exposed to light stimulation (n = 11). Data are presented as in A. (C) Averaged power spectrogram of LFPs in TH-cre;Ai27 mice exposed to light stimulation (n = 8). Data are presented as in A. (D) Averaged power spectrogram of LFPs in TH-Cre mice transduced with AAV-DIO–ChR2–mCherry exposed to light stimulation (n = 11). Data are presented as in A. (E) Histogram showing LFP power (4–12 Hz) change measured during the interval indicated in A relative to a 10-min baseline segment before stimulation (t test: TH-cre;Ai27 vs. WT, P = 0.12; AAV–ChR2 vs. AAV–mCherry, P = 0.02). *P < 0.05. (F) Control but not TH-cre;Ai27 mice undergoing photostimulation before context preexposure freeze significantly longer in context A than in context B (ANOVA: group × context interaction, F1,17 = 7.069, P = 0.0165; post hoc for WT vs. TH-cre;Ai27, context A, P > 0.05; context B, P > 0.05; post hoc for context A vs. context B: WT, P < 0.001, n = 10; TH-cre;Ai27, P > 0.05, n = 9). Mice in the AAV–mCherry group and AAV–ChR2 mice freeze similarly in context A and B (ANOVA: group × context interaction, F1,21 = 6.160, P = 0.0216; post hoc for AAV–mCherry vs. AAV–ChR2, context A, P > 0.05; context B, P > 0.05; post hoc for context A vs. context B: AAV–mCherry, P < 0.001, n = 12; AAV–ChR2, P > 0.05, n = 11). ***P < 0.001. (G) The discrimination index is significantly lower in the TH-cre;Ai27 and AAV–ChR2 groups than in their respective control groups (t test: WT vs. TH-cre;Ai27, t17 = 2.609, P = 0.018; AAV–mCherry vs. AAV–ChR2, t21 = 2.482, P = 0.022). *P < 0.05.
Fig. S4.
Fig. S4.
Sites for optical stimulation and recording in freely moving mice. (A) Schematic drawing of electrode and optic fiber placement in the DG. (B) Sample images showing the tracks of an implanted microdrive consisting of an optetrode (Left) and an optic fiber (Right) in the DG. Arrowheads indicate the tips of the optetrode and optic fiber. (Scale bars: 200 μm.)
Fig. S5.
Fig. S5.
Optical stimulation induces a reduction of theta power in anesthetized animals. (A) Averaged power spectrogram of LFPs in TH-cre;Ai27 mice exposed to light stimulation. Data are presented as in Fig. 2A. The horizontal white bar marks the time period used for quantitative comparison of LFP powers between 4 and 12 Hz. (B) Pretreatment with DA antagonists prevents light-induced changes in total power of LFPs in TH-cre;Ai27 mice. (C) Averaged power spectrogram of LFPs in WT littermates exposed to light stimulation. (D) Averaged power spectrogram of LFPs in TH-Cre mice transduced with AAV-DIO–ChR2–mCherry exposed to light stimulation. (E) Averaged power spectrogram of LFPs in TH-Cre mice transduced with AAV-DIO–mCherry exposed to light stimulation. (F) Histogram showing change in LFP power (4–12 Hz) measured during the interval indicated in A relative to the 10-min baseline segment before stimulation (t test: TH-cre;Ai27 vs. WT, P = 0.077; DA antagonist vs. WT, P = 0.908; AAV–ChR2 vs. AAV–mCherry, P = 0.016). *P < 0.05.
Fig. S6.
Fig. S6.
Photostimulation before the context preexposure does not change the exploratory behavior. (A) The average motion of TH-cre;Ai27 mice is not significantly different from that of their WT littermates (ANOVA: no significant light × time interaction, F1,9 = 0.7993, P = 0.6174; no significant light effect, F1,170 = 0.6478, P = 0.422; main time effect, F9,170 = 5.413, P < 0.0001; TH-cre;Ai27 group, n = 9; control group, n = 10). (B) The average motion of AAV–ChR2 mice is not significantly different from that of AAV–mCherry mice (ANOVA: no significant light × time interaction, F1,9 = 0.4, P = 0.934; no significant light effect, F1,200 = 0.0032, P = 0.9552; main time effect, F9,200 = 12.8, P < 0.0001; AAV–ChR2 group, n = 12; AAV–mCherry group, n = 11).
Fig. 3.
Fig. 3.
Pretraining elevation of the hippocampal DA level is sufficient to cause a learning deficit. (A, Upper) Experimental scheme. On the first day, mice were infused with DA and ∼1 h later were allowed to explore context A. The next day, mice received an immediate foot shock in context A′. The fear behavior of mice then was tested in context A and B in a counterbalanced order. (Lower) Infusion of DA into the hippocampus before training causes a deficit in learning. (Left) The mice infused with control solution but not with DA freeze more in context A than in context B (ANOVA: group × context interaction, F1,21 = 5.134, P = 0.035; post hoc for control vs. DA, context A, P < 0.05; context B, P > 0.05; post hoc for context A vs. context B: control group, P < 0.001, n = 12; DA group, P > 0.05, n = 11). (Right) The discrimination index is significantly lower in the DA group than in the control group (t test, t21 = 2.266, P = 0.035). Data are presented as mean ± SEM. *P < 0.05. (B) DA infusion in the hippocampus does not change exploration during preexposure. The average motion of the mice that were infused with DA 1 h before preexposure is not significantly different from that of the control mice (ANOVA: no significant DA × time interaction, F1,9 = 0.5464, P = 0.83; no significant DA effect, F1,189 = 1.390, P = 0.25; main time effect, F9,189 = 4.461, P < 0.0001; DA group, n = 11; vehicle group, n = 12).
Fig. 4.
Fig. 4.
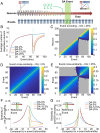
Implementation of DA in a simple neurogenic two-layer neural network. (A) Schematic of model. The neural network consists of an input layer of excitatory and inhibitory neurons and a neurogenic second layer that is initialized with no neurons. At each time step, the network is trained with a new event, and two immature neurons are added to the network. At time steps 65 through 70 (shaded green), DA is added to the network. Each plot below represents an average of 5,000 model runs. (B) DA (presented during shaded events) suppresses model output considerably. Even a relatively weak effect on excitatory synapses can greatly suppress network activity. (C) Strong DA suppression limits the population of responding neurons to only a subset of the youngest neurons in the network. Inactivity above the diagonal is indicative of neurons not yet having been born. (D) Cross-similarity plot of network encoding of events without DA; events are associated symmetrically in time because of neurogenesis. (E) Cross-similarity plot of network encoding of events with strong DA during events 65–70. Pre-DA and post-DA events are encoded using essentially distinct populations of neurons. (F) Events preceding DA are temporally associated with one another but show greatly reduced associations with events during (shaded area) and after DA. (G) Events following DA (shaded area) are temporally associated with other post-DA events. In F and G, note the symmetry of associations in the non-DA condition (blue).
Fig. S7.
Fig. S7.
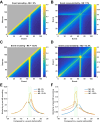
Implementation of NE in a simple neurogenic two-layer neural network. (A) Weak NE-induced LTP (+5% strength) broadly activates model DG output. (B) Events with 5% NE-induced LTP are weakly correlated with a broad range of temporally distant events. (C) Moderate NE-induced LTP (+12.5% strength) greatly activates model DG output. (D) Events with 12.5% NE-induced LTP are strongly correlated with a broad range of temporally distant events. Pre-NE and post-NE events are not differentially encoded using essentially distinct populations of neurons. (E) NE-induced LTP leads to strong correlation of events preceding NE with events during NE. (F) Events following NE (shaded area) are more strongly temporally associated with pre-NE events than events encoded without NE. In E and F, note the symmetry of associations in the non-NE condition (blue).
Fig. 5.
Fig. 5.
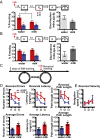
A natural reward transiently impairs spatial memory formation. (A) Appetitive reward treatment 1 h before training causes compromised learning. Control mice display significantly more freezing behavior in context A than do the milk-treated mice (ANOVA: group × context interaction, F1,39 = 6.966, P = 0.012; post hoc: context A, P < 0.05, context B, P > 0.05; water group, n = 20; milk group, n = 21). Milk-treated mice have a significant lower discrimination index than the control mice (t test, t39 = 2.069, P = 0.045). (B) Reward treatment 6 h before training has no effect on learning. Both groups of mice show significantly more freezing behavior in context A than in context B (ANOVA: group × context interaction, F1,40 = 2.641, P = 0.11; n = 21 in each group). There is no significant difference in the discrimination index between milk-treated mice and the control mice (t test, t40 = 1.625, P = 0.11). (C) Experimental scheme of Barnes maze experiment. (D) Milk-treated mice are impaired in reversal learning compared with control mice. (Upper Left) Errors made before reaching the target location (two-way ANOVA: group effect, F1,45 = 6.077, P = 0.0176; training effect, F2,45 = 3.159, P = 0.052, training × group interaction, F1,45 = 0.8962, P = 0.41). (Lower Left) Average number of errors during reversal training (Mann–Whitney test, P = 0.0301). (Upper Center) Latency to reach the target location (two-way ANOVA: group effect, F1,45 = 5.672, P = 0.0215; training effect, F2,45 = 3.409, P = 0.0418, training × group interaction, F1,45 = 0.5787, P = 0.56). (Lower Center) Average latency during reversal training (Mann–Whitney test, P = 0.0208). (Upper Right) Path length (two-way ANOVA: group effect, F1,45 = 3.734, P = 0.0596; training effect, F2,45 = 3.075, P = 0.056, training × group interaction, F1,45 = 1.03, P = 0.36). (Lower Right) Average path length during reversal training (Mann-Whitney test, P = 0.036). (E) Milk reward has no effect on navigation speed (two-way ANOVA: group effect, F1,45 = 0.2218, P = 0.64; training effect, F2,45 = 1.379, P = 0.26, training × group interaction, F1,45 = 0.6077, P = 0.54). Data are presented as mean ± SEM. In A, B, and D, *P < 0.05.
Fig. S8.
Fig. S8.
Reward has no effect on contextual conditioning if the reward is received immediately after preexposure, before immediate foot shock, or before memory test. (A) A posttraining reward does not affect contextual fear conditioning. In the fear test mice treated with sweetened condensed milk perform similarly to control mice (ANOVA: no significant treatment × context interaction, F1,1 = 0.002353, P = 0.96; no significant treatment effect, F1,44 = 0.1221, P = 0.72; main context effect, F1,44 = 23.85, P < 0.0001; Bonferroni post hoc test, water group, P < 0.01, n = 24; milk group, P < 0.01, n = 22). (B) Sweetened milk reward received before shock or before testing does not alter fear behavior of mice (ANOVA: no significant treatment × context interaction, F2,1 = 0.03321, P = 0.96; no significant reward effect, F2,46 = 0.3762, P = 0.68; main context effect, F1,46 = 21.34, P < 0.0001; n = 17 for the water group, n = 15 for the milk shock group, n = 17 for the milk test group). *P < 0.05.
Fig. S9.
Fig. S9.
Pretest reward does not change the exploratory or anxiety-related behaviors in either the open field test or the light–dark choice test. (A) The open field test. The exploratory behavior, as indicated by ambulatory path length (unpaired t test, t22 = 1.692, P = 0.10, n = 12 mice in each group) and vertical counts (unpaired t test, t22 = 0.3711, P = 0.71), is not affected by reward received about 1 h before the test. Receiving the reward does not affect the anxiety-like behavior, as indicated by the percentage of ambulatory length in the center (unpaired t test, t22 = 0.0, P = 1.000) and the percentage of time spent in the center (unpaired t test, t22 = 0.05182, P = 0.95). (B) The light–dark test. The anxiety-like behavior, as indicated by the percentage of ambulatory length in the light compartment (unpaired t test, t22 = 0.1361, P = 0.89, n = 12 in each group), the time spent in the light compartment (unpaired t test, t22 = 0.3029, P = 0.76), and the number of entries to the light compartment (unpaired t test, t22 = 0.5222, P = 0.60), is not affected by a reward received about 1 h before the test. The exploratory behavior is not affected by reward, as indicated by similar total ambulatory path lengths (unpaired t test, t22 = 0.5389, P = 0.59).
Fig. S10.
Fig. S10.
Prelearning reward does not change the exploratory behavior of mice during the context preexposure. (A) Changes in satiety affect the exploratory behavior during preexposure. The average motion of starved mice is significantly different from that of satiated ones (ANOVA: significant treatment × time interaction, F1,9 = 2.743, P = 0.0071; no significant treatment effect, F1,90 = 0.3803, P = 0.55; main time effect, F9,90 = 3.972, P = 0.0003; starved group, n = 5; satiated group, n = 7). *P < 0.05. (B) Reward received ∼1 h before learning does not affect exploratory behavior during preexposure. The average motion of milk-treated mice is not significantly different from that of water-treated ones (ANOVA: no significant treatment × time interaction, F1,9 = 1.605, P = 0.11; no significant treatment effect, F1,207 = 0.2018, P = 0.65; main time effect, F9,207 = 1.993, P = 0.042; milk group, n = 12; water group, n = 13).
Fig. 6.
Fig. 6.
Appetitive reward occludes ensuing ex vivo DA-induced LTD within a certain time window. (A) A slice recording is made to examine the effect of exogenous DA on synaptic transmission from the PP to the DG immediately after the mouse receives a reward of sweetened condensed milk. (B) Summary of results obtained from GCs treated with two identical DA perfusions with a 50-min interval (black horizontal bars). LTD of PP-driven excitatory postsynaptic currents (EPSCs) induced by the first drug administration is not increased further by the second drug administration. Data represent the EPSC amplitudes normalized by the mean values before drug perfusion (dashed line) and averaged over 2-min bins for each experiment. Error bars indicate ± SEM. (C) DA fails to induce LTD in vitro within a critical time window after a milk reward. Summary data of the effects of DA perfusion on GCs in the outer GC layer in slices from control (gray) and milk-treated (black) mice. All recordings were made between 2 and 4 h after delivery of milk reward. Data are presented as in B. (D) Exogenous DA induces LTD again >4 h after milk reward. As in C except that all recordings were made >4 h after milk delivery. (E) Summary results of the effects of DA perfusion on GFP-labeled adult-generated GCs at 4–6 wpi in slices from control (gray in green) and milk-treated (green) mice. All recordings were made between 2 and 4 h after delivery of milk reward. Data are presented as in B. (F) As in E except that all recordings were made >4 h after milk delivery. (G) Comparison of DA actions on PP-elicited responses of mature GCs in brain slices from mice treated with milk (black) and animals i.p. preinjected with either sulpiride (open box) or SCH 23390 (gray) before milk reward. Data are presented as in B.
Fig. 7.
Fig. 7.
Region-specific dopaminergic regulation in the hippocampus. (A, Left) Location of stimulating and recording electrodes for extracellular field recordings from the SC (red) and TA (blue) pathways in area CA1. A cut was placed between the DG and the CA3 (dotted line) to avoid polysynaptic activation. (Right) Average traces of 30 consecutive sweeps of fEPSPs in response to SC or TA stimulation recorded before and within 10 min after bath application of DA. (B) In comparison with time-matched saline controls (Veh), DA administration (black horizontal bar) induces a significant STD in fEPSPs at TA–CA1 synapses but does not affect the strength of SC–CA1 synapses. Data represent the fEPSP amplitudes normalized against the average of baseline traces (dashed line) and binned over 2-min spans. Error bars indicate ± SEM. (C) DA attenuates PP- but not A/C-evoked fEPSPs in area CA3. Data are presented as in B. (D) DA causes an LTD of PP-elicited fEPSPs in the DG. (E) Comparison of DA effects on responses to cortical inputs in distinct hippocampal subfields. (F) No difference in DA-induced depression of TA–CA1 synaptic responses is observed in slices from control and milk-treated mice.

Similar articles

Cited by

References

    1. Shohamy D, Adcock RA. Dopamine and adaptive memory. Trends Cogn Sci. 2010;14(10):464–472. - PubMed
    1. Wise RA. Dopamine, learning and motivation. Nat Rev Neurosci. 2004;5(6):483–494. - PubMed
    1. Bao S, Chan VT, Merzenich MM. Cortical remodelling induced by activity of ventral tegmental dopamine neurons. Nature. 2001;412(6842):79–83. - PubMed
    1. Yagishita S, et al. A critical time window for dopamine actions on the structural plasticity of dendritic spines. Science. 2014;345(6204):1616–1620. - PMC - PubMed
    1. Burgess N, Maguire EA, O’Keefe J. The human hippocampus and spatial and episodic memory. Neuron. 2002;35(4):625–641. - PubMed

Publication types

LinkOut - more resources