. 2016 Sep 13;113(37):10430-5.
doi: 10.1073/pnas.1603481113. Epub 2016 Aug 29.

Land-use change reduces habitat suitability for supporting managed honey bee colonies in the Northern Great Plains

Affiliations

Land-use change reduces habitat suitability for supporting managed honey bee colonies in the Northern Great Plains

Clint R V Otto et al. Proc Natl Acad Sci U S A. .

Abstract

Human reliance on insect pollination services continues to increase even as pollinator populations exhibit global declines. Increased commodity crop prices and federal subsidies for biofuel crops, such as corn and soybeans, have contributed to rapid land-use change in the US Northern Great Plains (NGP), changes that may jeopardize habitat for honey bees in a part of the country that supports >40% of the US colony stock. We investigated changes in biofuel crop production and grassland land covers surrounding ∼18,000 registered commercial apiaries in North and South Dakota from 2006 to 2014. We then developed habitat selection models to identify remotely sensed land-cover and land-use features that influence apiary site selection by Dakota beekeepers. Our study demonstrates a continual increase in biofuel crops, totaling 1.2 Mha, around registered apiary locations in North and South Dakota. Such crops were avoided by commercial beekeepers when selecting apiary sites in this region. Furthermore, our analysis reveals how grasslands that beekeepers target when selecting commercial apiary locations are becoming less common in eastern North and South Dakota, changes that may have lasting impact on pollinator conservation efforts. Our study highlights how land-use change in the NGP is altering the landscape in ways that are seemingly less conducive to beekeeping. Our models can be used to guide future conservation efforts highlighted in the US national pollinator health strategy by identifying areas that support high densities of commercial apiaries and that have exhibited significant land-use changes.

Keywords: Apis mellifera; apiary selection models; land use; land-cover trends; pollinators.


Conflict of interest statement

The authors declare no conflict of interest.

Figures

Fig. 1.
Fig. 1.
Location of 18,363 registered apiaries (red dots) in North and South Dakota. Gray counties are in the Prairie Pothole Region, and white counties are in the Badlands and Plains Region. The Missouri River, which separates the two regions, is in blue. An apiary density map can be found in Fig. S1.
Fig. S1.
Fig. S1.
Map representing the density of registered apiaries in North Dakota and South Dakota. Dark red represents areas with a relatively higher density of registered apiaries, and light red represents lower densities. Density map was created using the Point Density tool in the Spatial Analyst extension of ArcGIS, release 10.3.1 (48). The value for each map pixel was determined by the number of apiary points within a circular neighborhood of a defined radius. The value displayed in each county represents the number of registered apiaries per 10,000 ha.
Fig. 2.
Fig. 2.
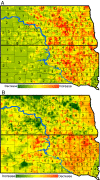
Heat maps representing the spatial distribution of corn and soybean fields in (A) 2006 and (B) 2014. Maps were created using interpolation and data from 18,363 registered apiary locations in North and South Dakota. Color ranges from green to yellow to red, with red representing the areas of more corn and soybean production.
Fig. 3.
Fig. 3.
Heat maps representing the annual rate of change in (A) corn and soybean or (B) grassland area from 2006 to 2014. Maps were created using interpolation and data from 18,363 registered apiary locations in North and South Dakota. (A) Red represents regions with the greatest annual increase of corn and soybean area surrounding commercial apiaries. (B) Red represents regions with the greatest annual loss of grassland area surrounding commercial apiaries. Values within county boundaries represent the average number of registered apiaries per 10,000 ha.
Fig. 4.
Fig. 4.
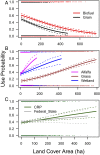
Apiary site use probability estimates explained as a function of land-cover and land-use covariates for North and South Dakota, 2006. (A) COMMODITY crop model including biofuels (red) and small grains (black). (B) HABITAT model including alfalfa (magenta), grassland (brown), and open water (blue). (C) CONSERVATION model including USDA Conservation Reserve Program land (green) and other federal and state conservation lands (gray). Dashed lines are 95% credible intervals. Colored dots represent raw data used to populate models.
Fig. S2.
Fig. S2.
Pearson correlation coefficients (Upper Right) and bivariate plots (Lower Left) of land-use and land-cover variables used to create apiary selection models. The name of each variable is shown on the diagonal in alphabetical order. Units for all axes are hectares.
Fig. S3.
Fig. S3.
Land-cover area surrounding 583 apiaries in eastern North and South Dakota used by commercial beekeepers from 2005 to 2007. Area calculations were derived using 2006 remotely sensed land-cover data within 1.6 km of the apiary location.
Fig. S4.
Fig. S4.
Model validation results for three resource selection models created for 196 validation apiaries in eastern North Dakota and South Dakota. Smoothed lines and raw values for ROC curves are provided for each model: COMMODITY (red), HABITAT (black), and CONSERVATION (green). Sensitivity is the true positive rate (i.e., site used as an apiary, correctly identified as such), and specificity is the true negative rate (i.e., validation sites not used as an apiary, correctly identified as such). A 1:1 correspondence line (45° line) represents a hypothetical model with no predictive power.

References

    1. Kearns CA, Inouye DW, Waser NM. Endangered mutualisms: The conservation of plant-pollinator interactions. Annu Rev Ecol Syst. 1998;29(1):83–112.
    1. Calderone NW. Insect pollinated crops, insect pollinators and US agriculture: Trend analysis of aggregate data for the period 1992-2009. PLoS One. 2012;7(5):e37235. - PMC - PubMed
    1. Klein A-M, et al. Importance of pollinators in changing landscapes for world crops. Proc Biol Sci. 2007;274(1608):303–313. - PMC - PubMed
    1. Aizen MA, Harder LD. The global stock of domesticated honey bees is growing slower than agricultural demand for pollination. Curr Biol. 2009;19(11):915–918. - PubMed
    1. Potts SG, et al. Global pollinator declines: Trends, impacts and drivers. Trends Ecol Evol. 2010;25(6):345–353. - PubMed

Publication types

LinkOut - more resources