. 2016 Sep 13;113(37):E5444-53.
doi: 10.1073/pnas.1604256113. Epub 2016 Aug 29.

IL2Rβ-dependent signals drive terminal exhaustion and suppress memory development during chronic viral infection

Affiliations

IL2Rβ-dependent signals drive terminal exhaustion and suppress memory development during chronic viral infection

Jean-Christophe Beltra et al. Proc Natl Acad Sci U S A. .

Abstract

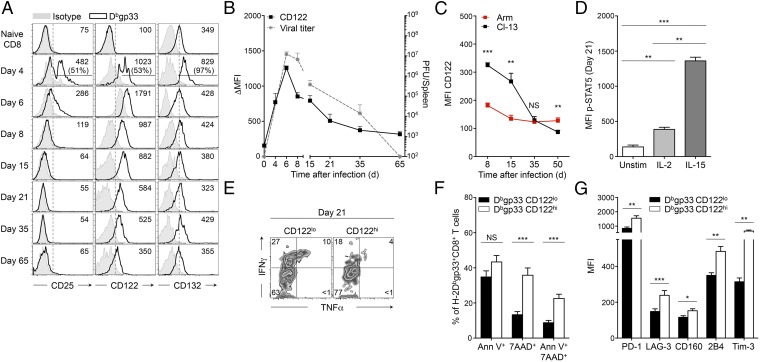
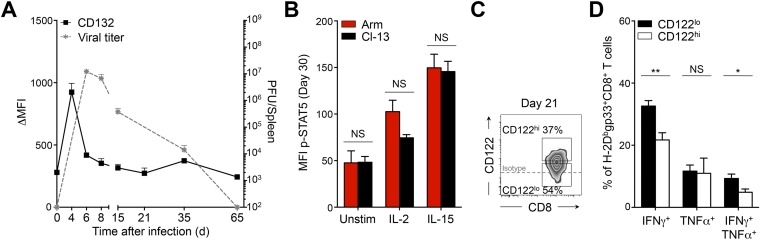
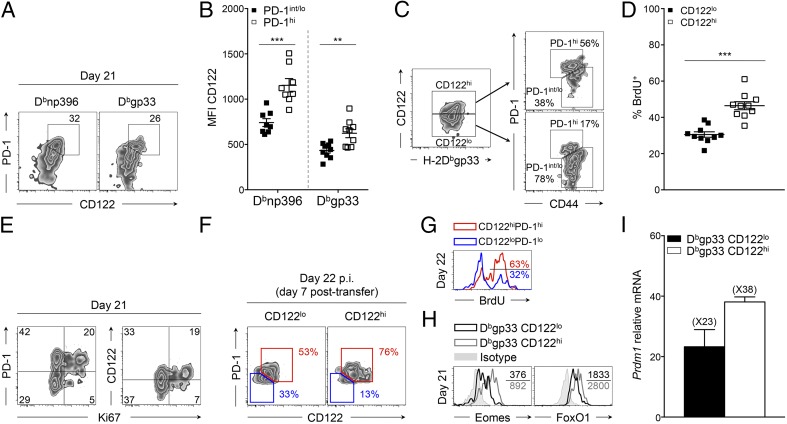
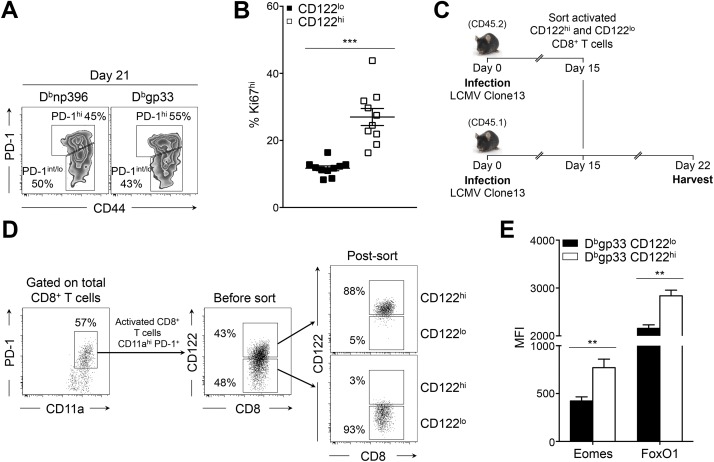
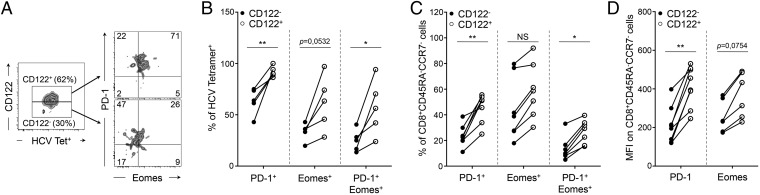
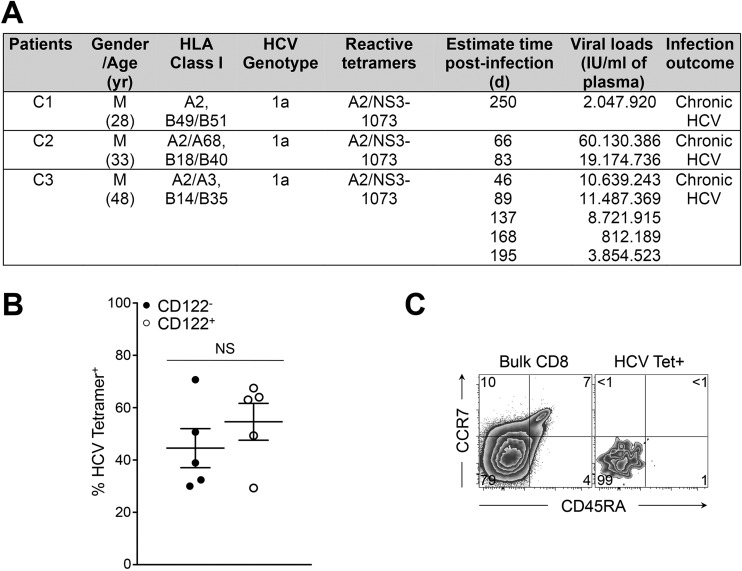
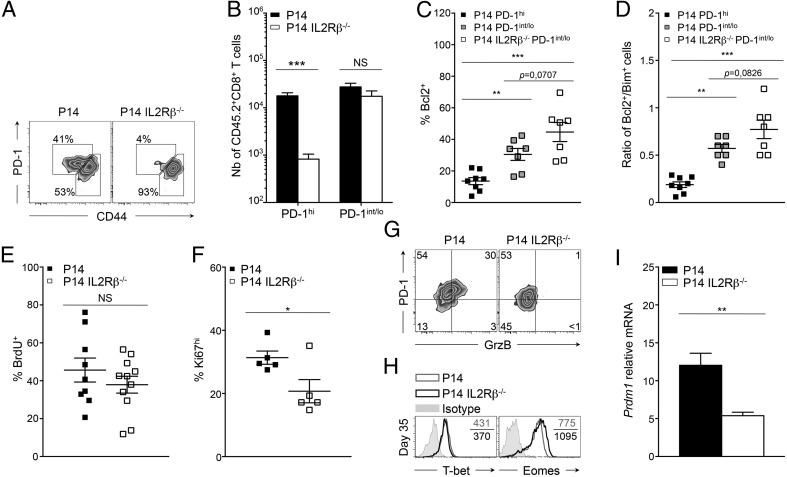
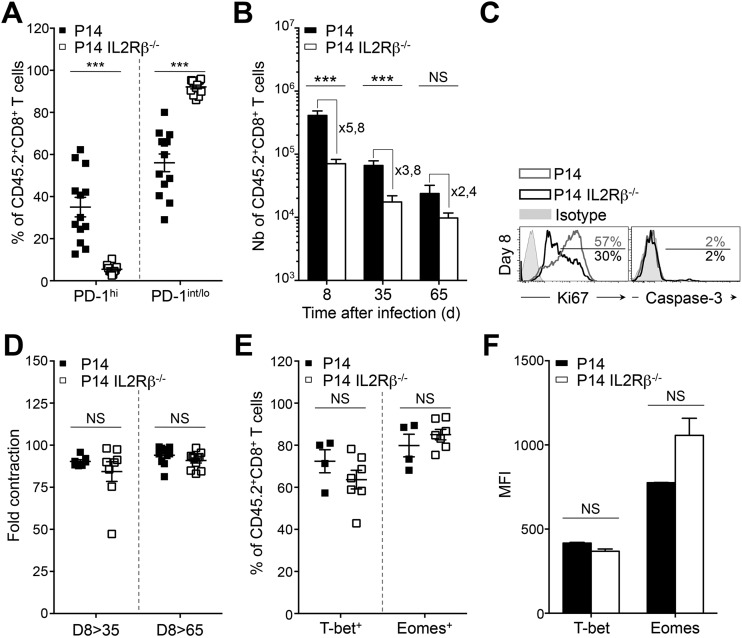
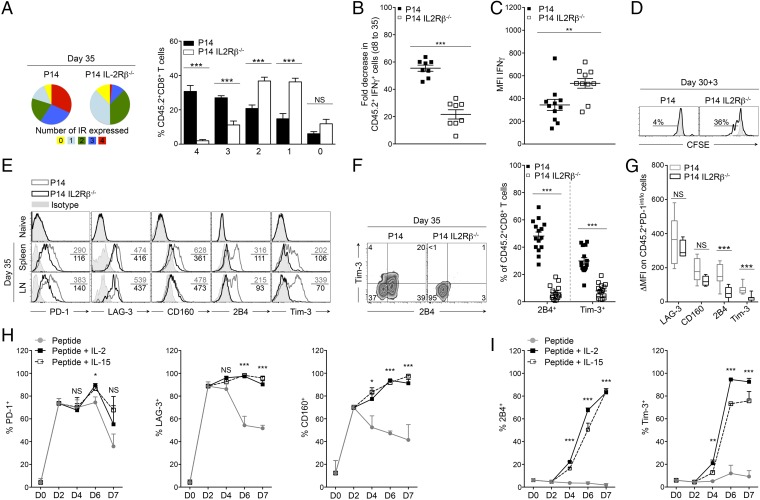
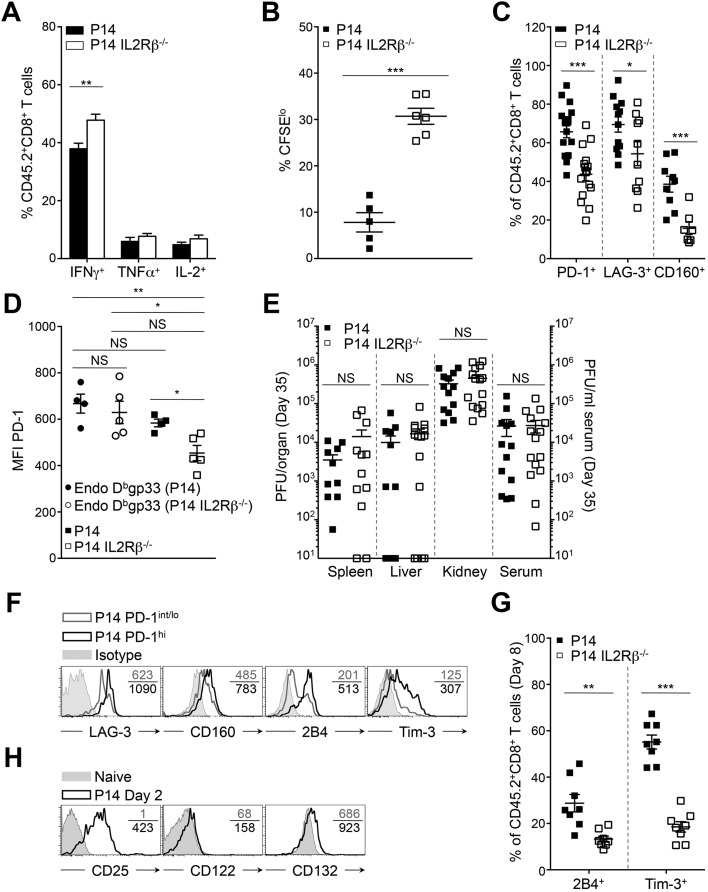
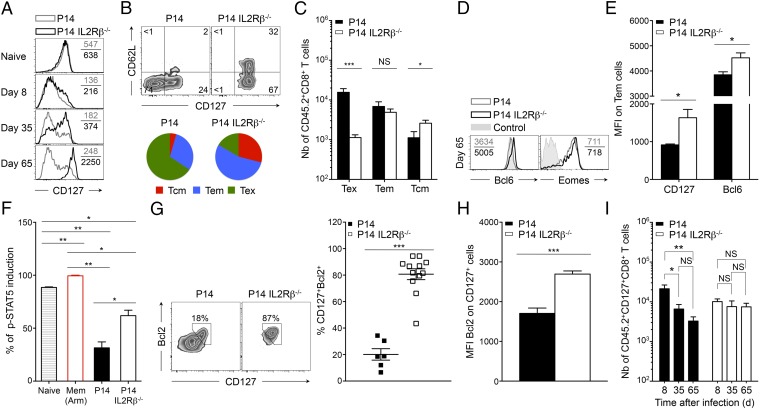
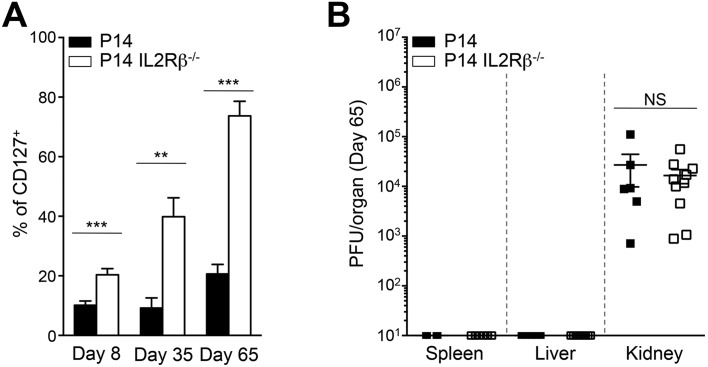
Exhaustion of CD8(+) T cells severely impedes the adaptive immune response to chronic viral infections. Despite major advances in our understanding of the molecular regulation of exhaustion, the cytokines that directly control this process during chronicity remain unknown. We demonstrate a direct impact of IL-2 and IL-15, two common gamma-chain-dependent cytokines, on CD8(+) T-cell exhaustion. Common to both cytokine receptors, the IL-2 receptor β (IL2Rβ) chain is selectively maintained on CD8(+) T cells during chronic lymphocytic choriomeningitis virus and hepatitis C virus infections. Its expression correlates with exhaustion severity and identifies terminally exhausted CD8(+) T cells both in mice and humans. Genetic ablation of the IL2Rβ chain on CD8(+) T cells restrains inhibitory receptor induction, in particular 2B4 and Tim-3; precludes terminal differentiation of highly defective PD-1(hi) effectors; and rescues memory T-cell development and responsiveness to IL-7-dependent signals. Together, we ascribe a previously unexpected role to IL-2 and IL-15 as instigators of CD8(+) T-cell exhaustion during chronic viral infection.

Keywords: CD8 T cell; IL-15; IL-2; exhaustion; memory T cell.


Conflict of interest statement

The authors declare no conflict of interest.

Figures

Fig. 1.
Fig. 1.
CD122 expression is maintained on CD8+ T cells and identifies severely exhausted cells. C57BL/6 (B6) mice were infected with LCMV Cl-13; analyses were performed in spleens on LCMV-specific H-2Dbgp33+CD8+ T cells at day 21 p.i., unless otherwise indicated. (A) Cell-surface expression of CD25, CD122, and CD132 at distinct time points after infection. Values in quadrants indicate MFI (and frequency of highly positive cells on Day 4); gray-filled histograms are isotype controls. (B) Cell-surface expression of CD122 [left y axis; filled squares represent Δ MFI (MFI minus isotype control MFI)] and viral titers (right y axis; dotted gray line) at indicated time points. (C) Cell-surface expression of CD122 on H-2Dbgp33+CD8+ T cells isolated at indicated time points from mice infected with LCMV Arm (acute infection; red squares) or LCMV Cl-13 (chronic infection; black squares). (D) Intracellular expression of p-STAT5 in activated (CD11a+) CD8+ T cells following stimulation with the indicated cytokines. Unstim, unstimulated control. (E) Intracellular production of IFNγ and TNFα in CD122lo H-2Dbgp33+CD8+ T cells (Left) and CD122hi H-2Dbgp33+CD8+ T cells (Right). Values indicate the frequency of cells in each quadrant. (F) Frequency of CD122lo H-2Dbgp33+CD8+ T cells (black bars) and CD122hi H-2Dbgp33+CD8+ T cells (white bars) positive for Annexin V and/or 7AAD. (G) Expression of the indicated inhibitory receptors on CD122lo H-2Dbgp33+CD8+ T cells (black bars) and CD122hi H-2Dbgp33+CD8+ T cells (white bars). Bars represent the MFI. *P < 0.05; **P < 0.005; ***P < 0.0005; NS P ≥ 0.05 (two-tailed unpaired Student’s t test). Data are pooled from two (C and G) or three (B and F) independent experiments with at least five mice per group or are representative of three independent experiments (A, D, and E) with similar results (n = 2 or 3 mice per group in each). Error bars in BD, F, and G indicate mean ± SEM.
Fig. S1.
Fig. S1.
CD122 expression on CD8+ T cells identifies severely exhausted cells. C57BL/6 (B6) mice were infected with LCMV Cl-13; analyses were performed in spleens on day 21 p.i. unless otherwise indicated. (A) Cell-surface expression of CD132 (left y axis; filled squares represent Δ MFI) and viral titers (right y axis; dashed gray line) at the indicated time points. (B) Intracellular expression of p-STAT5 in activated (CD11a+) CD8+ T cells following stimulation with the indicated cytokines from animals infected with LCMV Arm (acute infection; red bars) or LCMV Cl-13 (chronic infection; black bars) at day 30 p.i.; Unstim, level in unstimulated control. (C) Gating strategy for CD122hi H-2Dbgp33+CD8+ T cells (upper gate) and CD122lo H-2Dbgp33+CD8+ T cells (lower gate). Gates are set above and below the center of the population. CD122int/lo cells include cells negative for CD122. Values indicate the frequency in each gate. (D) Frequency of CD122lo (black bars) and CD122hi (white bars) H-2Dbgp33+CD8+ T cells producing IFNγ, TNFα, or both IFNγ and TNFα simultaneously. *P < 0.05; **P < 0.005; ***P < 0.0005; NS P ≥ 0.05; two-tailed unpaired Student’s t test. Data are pooled from two (A) or three (D) independent experiments with four to eight mice per group or are representative of three (C) or four (B) independent experiments with similar results (two to three mice per group in each). Error bars in A, B, and D indicate mean ± SEM.
Fig. 2.
Fig. 2.
Lineage relationship between CD122hi cells and PD-1hi cells. Mice were infected and analyzed as in Fig. 1. (A) Cell-surface expression of CD122 and PD-1 on H-2Dbnp396+CD8+ T cells (Left) and H-2Dbgp33+CD8+ T cells (Right). Values indicate the frequency of CD122hiPD-1hi cells. (B) Expression of CD122 on PD-1int/lo (filled squares) and PD-1hi (open squares) H-2Dbnp396+ CD8+ T cells (Left) and H-2Dbgp33+ CD8+ T cells (Right). (C) Expression of PD-1 and CD44 on CD122hi (Upper Right) and CD122lo (Lower Right) H-2Dbgp33+CD8+ T cells. Values indicate the frequency of PD-1hiCD44int and PD-1int/loCD44hi cells in each panel. (D) Frequency of CD122lo (filled squares) and CD122hi (open squares) H-2Dbgp33+CD8+ T cells that incorporated BrdU between day 15 and 30 p.i. (E) Cell-surface expression of CD122, PD-1, and intracellular Ki67 in H-2Dbgp33+CD8+ T cells. Values indicate the frequency of cells in each gate. (F) Cell-surface expression of CD122 and PD-1 on CD122lo (Left) and CD122hi (Right) transferred cells (CD45.2+) at day 22 p.i. (7 d posttransfer). Values indicate the frequency of CD122hiPD-1hi (red) and CD122loPD-1lo (blue) cells. (G) BrdU incorporation (day 15–22 p.i.) by CD122hiPD-1hi CD45.2+ cells (red histogram) and CD122loPD-1lo CD45.2+ cells (blue histogram) recovered from mice adoptively transferred with CD122lo (CD45.2+) cells. Values indicate the frequency of positive cells. (H) Intracellular Eomes and FoxO1 expression in CD122lo (black histograms) and CD122hi (gray histograms) H-2Dbgp33+CD8+ T cells. Values indicate the MFI; gray-filled histograms are isotype controls. (I) Expression of Prdm1 assessed by quantitative RT-QPCR analysis in sorted CD122lo (black bar) and CD122hi (white bar) H-2Dbgp33+CD8+ T cells. Values indicate the fold increase relative to naive P14 CD8+ T cells. **P < 0.005; ***P < 0.0005; two-tailed unpaired Student’s t test. Data are pooled from two (I) or three (B) independent experiments with at least eight mice per group or are representative of one (G), two (F and H), or three (A and C) independent experiments with similar results (n = 2 or 3 mice per group). Data in D and E are representative of one experiment with 10 mice per group. Error bars in B, D, E, and I indicate mean ± SEM.
Fig. S2.
Fig. S2.
CD122hi cells share functional and transcriptional features with PD-1hi cells. Mice were infected and analyzed as in Fig. S1. (A) Gating strategy for PD-1hi (upper gates) and PD-1int/lo (lower gates) H-2Dbnp396+ CD8+ T cells (Left) and H-2Dbgp33+ CD8+ T cells (Right). Values indicate the frequency of cells in each gate. (B) Cumulative frequency of CD122lo H-2Dbgp33+CD8+ T cells (filled squares) and CD122hi H-2Dbgp33+CD8+ T cells (open squares) expressing high levels of Ki67. Data are representative of one experiment with 10 mice per group. (C and D) Experimental approach (C) and sorting strategy (D) for adoptive transfer experiments of CD122lo and CD122hi cells. Splenocytes were harvested from CD45.2+ donor mice at day 15 p.i. Activated CD11a+ PD-1+ CD8+ T cells were sorted based on high (CD122hi) or intermediate/low (CD122lo) expression of CD122 and were infused i.v. in distinct CD45.1+ infection-matched recipient mice. Recipient mice were given BrdU daily from day 15–22 p.i., and CD45.2+ transferred cells were harvested at day 22 and analyzed for surface markers and BrdU incorporation. (E) Intracellular Eomes and FoxO1 expression in CD122lo H-2Dbgp33+CD8+ T cells (black bars) and CD122hi H-2Dbgp33+CD8+ T cells (white bars). **P < 0.005; ***P < 0.0005; two-tailed unpaired Student’s t test. Data are pooled from two independent experiments with at least six mice per group (E) or are representative of three independent experiments with similar results (n = 2 or 3 mice per group) (A). Error bars in B and E indicate mean ± SEM.
Fig. 3.
Fig. 3.
CD122 identifies exhausted cells in individuals infected with HCV. PBMCs were collected during the first year of HCV infection from individuals who had high viral titers and developed persistent viremia as described in Fig. S3A. (A) Expression of extracellular PD-1 and intracellular Eomes in CD122+ (Upper Right) and CD122 (Lower Right) HCV-specific CD8+ T cells. Gates for CD122+ and CD122 cells are set based on fluorescence minus one (FMO) controls. Values indicate the frequency of cells in each quadrant. (B) Frequency of CD122 (filled circles) and CD122+ (open circles) HCV-specific CD8+ T cells positive for the indicated molecules. (C) Frequency of CD122 (filled circles) and CD122+ (open circles) CD45RACCR7 effector memory CD8+ T cells positive for the indicated molecules. (D) Expression of PD-1 and Eomes in CD122 (filled circles) and CD122+ (open circles) CD45RACCR7 effector memory CD8+ T cells represented by their MFI. *P < 0.05; **P < 0.005; NS P ≥ 0.05; two-tailed unpaired Student’s t test. Data are pooled from five to eight distinct time points from two to three infected patients processed independently.
Fig. S3.
Fig. S3.
Chronically infected patients with HCV. PBMCs were collected during the first year of HCV infection from individuals who had high viral titers and had developed persistent viremia. (A) Patients' characteristics. (B) Frequency of CD122 HCV-specific CD8+ T cells (filled circles) and CD122+ HCV-specific CD8+ T cells (open circles). (C) Expression of CCR7 and CD45RA on total CD8+ T cells (Left) and HCV-specific CD8+ T cells (Right). Values indicate the frequency of cells in each gate. Data are representative of five to eight samples from three infected patients processed independently.
Fig. 4.
Fig. 4.
IL2Rβ deficiency abrogates PD-1hi terminal differentiation. Tg P14 or P14 IL2Rβ−/− (CD45.2) cells were adoptively transferred into recipient mice (CD45.1.2) before LCMV Cl-13 infection. Tg cells (CD45.2) were compared in the spleen at day 35 p.i. (A) Representative dot plots of PD-1hi and PD-1int/lo P14 cells (Left) and P14 IL2Rβ−/− cells (Right). Values indicate the frequency of cells in each gate. (B) Absolute numbers of PD-1hi (Left) and PD-1int/lo (Right) splenic cells from P14 (black bars) and P14 IL2Rβ−/− (white bars) chimeric mice. (C) Frequency of cells expressing Bcl2 in P14 PD-1hi cells (filled squares), P14 PD-1int/lo cells (gray squares), and P14 IL2Rβ−/− PD-1int/lo cells (open squares). (D) Frequency of Bcl2+ cells over frequency of Bim+ cells in P14 PD-1hi cells (filled squares), P14 PD-1int/lo cells (gray squares), and P14 IL2Rβ−/− PD-1int/lo cells (open squares). (E) Frequency of P14 cells (filled squares) and P14 IL2Rβ−/− cells (open squares) that incorporated BrdU between day15 and 30 p.i. (F) Frequency of Ki67hi P14 cells (filled squares) and P14 IL2Rβ−/− cells (open squares). Data represent one experiment with five mice per group. (G) Expression of PD-1 and intracellular granzyme B in P14 cells (Left) and P14 IL2Rβ−/− cells (Right). Values indicate the frequency of cells in each gate. (H) Intracellular T-bet and Eomes expression in P14 cells (gray histograms) and P14 IL2Rβ−/− cells (black histograms). Values indicate the MFI; gray-filled curves are isotype controls. (I) Prdm1 levels assessed by quantitative RT-QPCR analysis in sorted P14 cells (black bar) and P14 IL2Rβ−/− cells (white bar) relative to naive P14 cells. *P < 0.05; **P < 0.005; ***P < 0.0005; NS P ≥ 0.05; two-tailed unpaired Student’s t test. Data are pooled from two (C, D, and I) or three (B and E) independent experiments with at least seven mice per group or are representative of two (G and H) or three (A) independent experiments with similar results (n = 2–4 mice per group in each). Error bars in BF and I indicate mean ± SEM.
Fig. S4.
Fig. S4.
IL2Rβ deficiency abrogates PD-1hi terminal differentiation. Tg P14 or P14 IL2Rβ−/− (CD45.2) CD8+ T cells, specific for the H-2Dbgp33 epitope of LCMV, were adoptively transferred into recipient mice (CD45.1.2) before LCMV Cl-13 infection. Development of Tg CD8+CD45.2+ PD-1hi and PD-1int/lo cells in the two groups of chimeric mice was compared at day 35 p.i. (A) Cumulative frequencies of PD-1hi (Left) and PD-1int/lo (Right) P14 cells (filled squares) and P14 IL2Rβ−/− cells (open squares). (B) Absolute numbers of CD8+CD45.2+ P14 splenic cells (black bars) and P14 IL2Rβ−/− splenic cells (white bars) calculated based on H-2Dbgp33 tetramer and CD45.2 congenic marker staining at the indicated time points. Values indicate the fold difference in the absolute numbers of P14 cells over P14 IL2Rβ−/− cells at that precise time point. (C) Intracellular expression of Ki67 (Left) and active-caspase 3 (Right) in CD8+CD45.2+ P14 cells (gray histograms) and P14 IL2Rβ−/− cells (black histograms) at day 8 p.i. Values indicate the frequency of Ki67hi or active caspase-3+ cells. (D) Fold contraction in the number of P14 cells (filled squares) and P14 IL2Rβ−/− cells (open squares) in the indicated time frames. (E and F) Frequency (E) and MFI (F) of intracellular T-bet and Eomes in P14 cells (filled squares in E and black bars in F) and P14 IL2Rβ−/− cells (open squares in E and white bars in F) at day 35 p.i. ***P < 0.0005; NS P ≥ 0.05; two-tailed unpaired Student’s t test. Data are pooled from two (E and F), three (A and D), or four (B) independent experiments with 3–10 mice per group or are representative of three (C) independent experiments with similar results (n = 3 mice per group). Error bars in A, B, and DF indicate mean ± SEM.
Fig. 5.
Fig. 5.
IL2Rβ-dependent signals regulate the levels of inhibitory receptor expression. (AG) P14 or P14 IL2Rβ−/− chimeric mice were generated and analyzed as described in Fig. 4. (A) Frequency of P14 cells (left pie chart and black bars) and P14 IL2Rβ−/− cells (right pie chart and white bars) coexpressing PD-1, LAG-3, 2B4, and CD160. Numbers 1–4 represent the number of inhibitory receptors expressed simultaneously. (B) Fold decrease in the frequency of P14 cells (filled squares) and P14 IL2Rβ−/− cells (open squares) producing IFNγ between days 8 and 35 p.i. (C) Production of IFNγ (as shown by MFI) in CD8+CD45.2+ P14 cells (filled squares) and P14 IL2Rβ−/− cells (open squares). (D) Proliferation of P14 cells (Left) and P14 IL2Rβ−/− cells (Right) in response to gp33 stimulation. Proliferation is represented as CFSE dilution over 3 d with values indicating the frequency of CFSEint cells. Gray-filled histograms are unstimulated controls. (E) Expression of inhibitory receptors on P14 cells (gray histograms) and P14 IL2Rβ−/− cells (black histograms). Values indicate the MFI; gray-filled histograms are isotype controls. (F, Left) Cell-surface expression of 2B4 and Tim-3 on P14 cells and P14 IL2Rβ−/− cells. Values indicate the frequency of cells in each quadrant. (Right) Cumulative frequencies of 2B4+ and Tim-3+ P14 cells (filled squares) and P14 IL2Rβ−/− cells (open squares). (G) Expression of inhibitory receptors on PD-1int/lo P14 cells (gray boxes) and P14 IL2Rβ−/− cells (black boxes) represented by their Δ MFI. (H and I) Frequency of P14 cells expressing the indicated inhibitory receptors during coculture with gp33 peptide alone (gray lines) or with additional IL-2 (black lines) or IL-15 (dashed lines). Data are pooled from five independent experiments performed in triplicate. *P < 0.05; **P < 0.005; ***P < 0.0005; NS P ≥ 0.05; two-tailed unpaired Student’s t test (AG) or one-way ANOVA non parametric tests; Dunnett’s t (G and H). Data are pooled from two (A), three (B, C, and G), or four (F) independent experiments with 5–16 mice per group or are representative of two (D) or five (E) independent experiments with similar results (n = 2–5 mice per group in each). Error bars in AC and FI indicate mean ± SEM.
Fig. S5.
Fig. S5.
IL2Rβ-dependent signals regulate the level of inhibitory receptor expression and the associated cellular dysfunctions. P14 or P14 IL2Rβ−/− chimeric mice were generated as described in Fig. S4, and cells were analyzed at day 35 p.i. (A) Intracellular production of the indicated cytokines by CD8+CD45.2+ P14 cells (black bars) and P14 IL2Rβ−/− cells (white bars). (B) Cumulative frequency of P14 cells (filled squares) and P14 IL2Rβ−/− cells (open squares) proliferating in response to gp33 peptide stimulation, as assessed by a CFSE dilution assay. (C) Cumulative frequencies of PD-1+ (Left), LAG-3+ (Center), and CD160+ (Right) P14 cells (filled squares) and P14 IL2Rβ−/− cells (open squares) at day 35 p.i. (D) Cumulative cell-surface expression of PD-1 on endogenous CD45.1.2+H-2Dbgp33+CD8+ T cells from chimeric mice transferred with P14 cells (filled circles) or P14 IL2Rβ−/− cells (open circles). Tg P14 (filled squares) and Tg P14 IL2Rβ−/− (open squares) CD45.2+H-2Dbgp33+CD8+ T cells are also represented. (E) Viral titers in the indicated organs (left axis) and in the serum (right axis) at day 35 p.i. from P14 (filled squares) and P14 IL2Rβ−/− (open squares) chimeric mice. (F) Expression of the indicated inhibitory receptors on P14 PD-1int/lo cells (gray histograms) and P14 PD-1hi cells (black histograms). Values indicate the MFI; gray-filled histograms are isotype controls. (G) Cumulative frequencies of 2B4+ (Left) and Tim-3+ (Right) P14 cells (filled squares) and P14 IL2Rβ−/− cells (open squares) at day 8 p.i. (H) Expression of CD25, CD122, and CD132 on P14 cells after 2 d of in vitro stimulation with dendritic cells loaded with gp33-41. Values indicate the MFI; gray-filled histograms are isotype controls. *P < 0.05; **P < 0.005; ***P < 0.0005; NS P ≥ 0.05; two-tailed unpaired Student’s t test. Data are pooled from one (D), two (B), three (A, E, and G), or five (C) independent experiments with 4–18 mice per group or are representative of one (H) or three (F) independent experiments with similar results (n = 2–4 mice per group). Error bars in AE and G indicate mean ± SEM.
Fig. 6.
Fig. 6.
IL2Rβ deficiency restores CD8+ memory T-cell development. P14 or P14 IL2Rβ−/− chimeric mice were generated as described in Fig. 4. Cells were analyzed in the spleen at day 65 p.i. unless otherwise indicated. (A) CD127 expression on P14 cells (gray histograms) and P14 IL2Rβ−/− cells (black histograms) at the indicated time points. Values indicate the MFI. (B, Upper) Contour plots show the expression of CD62L and CD127 on P14 cells (Left) and P14 IL2Rβ−/− cells (Right). Values in each quadrant indicate the frequency. (Lower) Pie charts show the cumulative frequency of Tcm (CD62LhiCD127hi; red), Tem (CD62LloCD127hi; blue), and Tex (CD62LloCD127lo; green) cells in P14 cells (Left) and P14 IL2Rβ−/− cells (Right). (C) Absolute numbers of Tex (CD62LloCD127lo) (Left), Tem (CD62LloCD127hi (Center), and Tcm (CD62LhiCD127hi) (Right) cells in P14 cells (filled bars) and P14 IL2Rβ−/− cells (open bars). (D) Intracellular expression of Bcl6 and Eomes in P14 cells (gray histograms) and P14 IL2Rβ−/− cells (black histograms). Values indicate the MFI; gray-filled histograms are isotype controls (Eomes) and TCRβ cells (Bcl6). (E) Expression of CD127 (Left) and Bcl6 (Right) on P14 Tem cells (black bars) and P14 IL2Rβ−/− Tem cells (white bars). (F) Induction of p-STAT5 in P14 cells (black bar) and P14 IL2Rβ−/− cells (white bar) following stimulation with IL-7. Naive P14 cells are represented by the striped bar; antigen-specific memory cells are represented by the red bar. (G, Left) Expression of CD127 and Bcl2 in P14 cells and P14 IL2Rβ−/− cells. Values in contour plots indicate the frequency of double-positive cells. (Right) Cumulative frequency of CD127+Bcl2+ cells in P14 cells (filled squares) and P14 IL2Rβ−/− cells (open squares). (H) Expression of Bcl2 in CD127+ P14 cells (black bar) and P14 IL2Rβ−/− cells (white bar). (I) Absolute numbers of CD127+ P14 cells (Left) and CD127+ P14 IL2Rβ−/− cells (Right) at the indicated time points. *P < 0.05; **P < 0.005; ***P < 0.0005; NS P ≥ 0.05; two-tailed unpaired Student’s t test. Data are pooled from two (G and H) or three (C and I) independent experiments with 6–17 mice per group or are representative of two (D and F) or three (A, B, and E) independent experiments with similar results (n = 2–7 mice per group). Error bars in C and EI indicate mean ± SEM.
Fig. S6.
Fig. S6.
IL2Rβ deficiency restores CD127 expression. P14 or P14 IL2Rβ−/− chimeric mice were generated as described in Fig. S4. (A) Frequency of CD127+ P14 cells (black bars) and P14 IL2Rβ−/− cells (white bars) at the indicated time points. (B) Viral titers in the indicated organs at day 65 p.i. from P14 (filled squares) and P14 IL2Rβ−/− (open squares) chimeric mice. **P < 0.005; ***P < 0.0005; NS P ≥ 0.05; two-tailed unpaired Student’s t test. Data are pooled from two (B) or three (A) independent experiments with 5–10 mice per group. Error bars indicate mean ± SEM.

Similar articles

Cited by

References

    1. Gray SM, Kaech SM, Staron MM. The interface between transcriptional and epigenetic control of effector and memory CD8⁺ T-cell differentiation. Immunol Rev. 2014;261(1):157–168. - PMC - PubMed
    1. Zhang N, Bevan MJ. CD8(+) T cells: Foot soldiers of the immune system. Immunity. 2011;35(2):161–168. - PMC - PubMed
    1. Decaluwe H, et al. Gamma(c) deficiency precludes CD8+ T cell memory despite formation of potent T cell effectors. Proc Natl Acad Sci USA. 2010;107(20):9311–9316. - PMC - PubMed
    1. Zehn D, Wherry EJ. Immune memory and exhaustion: Clinically relevant lessons from the LCMV model. Adv Exp Med Biol. 2015;850:137–152. - PubMed
    1. Wherry EJ, Kurachi M. Molecular and cellular insights into T cell exhaustion. Nat Rev Immunol. 2015;15(8):486–499. - PMC - PubMed

Publication types

MeSH terms