. 2016 Sep 13;113(37):10275-80.
doi: 10.1073/pnas.1604134113. Epub 2016 Aug 29.

Controlling water evaporation through self-assembly

Affiliations

Controlling water evaporation through self-assembly

Kevin Roger et al. Proc Natl Acad Sci U S A. .

Abstract

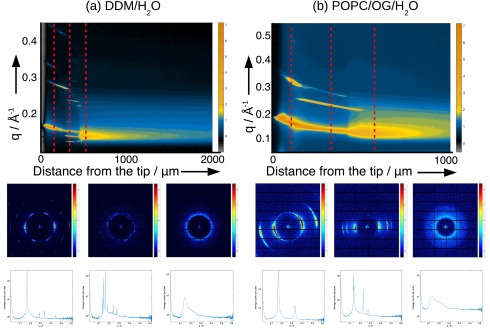
Water evaporation concerns all land-living organisms, as ambient air is dryer than their corresponding equilibrium humidity. Contrarily to plants, mammals are covered with a skin that not only hinders evaporation but also maintains its rate at a nearly constant value, independently of air humidity. Here, we show that simple amphiphiles/water systems reproduce this behavior, which suggests a common underlying mechanism originating from responding self-assembly structures. The composition and structure gradients arising from the evaporation process were characterized using optical microscopy, infrared microscopy, and small-angle X-ray scattering. We observed a thin and dry outer phase that responds to changes in air humidity by increasing its thickness as the air becomes dryer, which decreases its permeability to water, thus counterbalancing the increase in the evaporation driving force. This thin and dry outer phase therefore shields the systems from humidity variations. Such a feedback loop achieves a homeostatic regulation of water evaporation.

Keywords: evaporation; gradient; homeostatic; regulation; self-assembly.


Conflict of interest statement

The authors declare no conflict of interest.

Figures

Fig. 1.
Fig. 1.
Variation of the evaporation rate with the air RH for various systems, measured by a gravimetric method or taken from the literature [pure water, in vivo study of beech (Fagus sylvatica L.) leaf discs (4), in vitro study of rat stratum corneum (7), in vitro study of human stratum corneum (6), in vivo study of human skin (5), and DDM/water and POPC/OG/water model systems]. For each system, the evaporation rate is normalized by its value at the lowest RH of 0.5%. (A) In all cases (skin, leaves, and solutions of amphiphiles), the evaporation rate is reduced compared with pure water. As an example, the evaporation from the DDM/water system is 20 times slower than from pure water after 1 h of drying. (B) Evaporation through beech leaves depends linearly on the humidity, which is typical of a passive barrier. On the contrary, for the stratum corneum and model systems, the evaporation rate is constant over most of the RH range. The latter systems behave like responding membranes such as a stack of lipid bilayers as modeled by Sparr and Wennerström (8).
Fig. 2.
Fig. 2.
Multitechnique characterization on two model systems: (A) DDM/water system and (B) POPC/OG/water system. The upper panels correspond to observation of the flat capillaries through optical microscopy using crossed polarizers. Birefringent anisotropic phases appear bright, whereas isotropic phases appear black. Phase boundaries are visible as lines parallel to the capillary edge. Superimposed with the microscopy images are quantitative data of the gradient in water content (red lines), as obtained from infrared microscopy measurements (spatial resolution, 20 μm). The middle panels show structural maps obtained through SAXS (spatial resolution, 20 μm). The color scale corresponds to the logarithm of the scattered intensity. The map displays the spatial variation of the scattering vector magnitude, q, which gives the structure correlation length. Bright lines correspond to structure peaks that characterize the type of self-assembly structure. The lower panels show simplified structural illustrations of the identified phases.
Fig. 3.
Fig. 3.
Picture and scheme of the capillary setup. A small capillary is connected to a nearly infinite reservoir (Right). The tip of this capillary faces the tip of a larger capillary, which blows air of controlled and known humidity.
Fig. S1.
Fig. S1.
Water loss as a function of time obtained by gravimetric measurements and a multicapillary cell in air of controlled humidity. (A) DDM/water system: the water loss is independent of RH up to RH > 80%. (B) POPC/OG/water system: the water loss is independent of RH up to 95%.
Fig. S2.
Fig. S2.
Water volume fractions, plotted as percentage, over time and position monitored by near-infrared microscopy for (A) DDM/water system, (B) POPC/OG/water system at RH = 0.5%. These measurements show the buildup of a concentration gradient varying linearly between steps, which correspond to phase transitions. The phase boundaries correspond to given water concentrations and only their locations changed over time as the gradient spread over the capillary.
Fig. S3.
Fig. S3.
Kinetic monitoring of the structural gradient by mapping the 1D spectra along the capillary. The color code corresponds to the logarithm of the scattered intensity. The characteristic sequence remains unchanged over time. Only the resolution increases as the gradient spreads over the capillary.
Fig. S4.
Fig. S4.
Comparison of structural maps, corresponding to the same drying duration, for two different humidities. (A) DDM/water system: only the edge spectra of the capillary, for which resolution is poor due to edge roughness, are modified by a humidity change. This corresponds to the disappearance of the thin phase that shields the rest of the system from humidity variations up to RH = 85%. Otherwise, the structural maps are the same. (B) POPC/OG/water system: in this case also, only the edge spectra are modified by a thinning of the external phase upon increasing humidity, whereas the rest of the map is independent of the humidity.
Fig. S5.
Fig. S5.
SAXS spectra at the edge of the capillary for the DDM/water system. (A) Spectrum taken under dry conditions RH = 1%. Similarly to the data displayed on Fig. S4, a double peak is systematically observed. (B) After blowing humid air (RH = 90%), the double peak disappears and is replaced by a single peak. This is also consistent with Fig. S4 as only a single peak is observed at the edge when the drying occurs under humid conditions. This shows the existence of a phase transition at the air–liquid interface between dry and humid conditions, as expected from the calorimetry data displayed in Fig. S7.
Fig. S6.
Fig. S6.
Examples of 2D patterns and 1D spectra for (A) the DDM/water system and (B) the POPC/OG/water system. Anisotropic phases are strongly oriented in the capillary. The hexagonal phases align with their cylinders orthogonal to the flux, whereas the lamellar phases align with the lamellae orthogonal to the flux.
Fig. 4.
Fig. 4.
The increase in thickness of different phases in the interfacial layer as a function of time, as obtained from the optical microscopy images (Top) (DDM/water system). The air RH varies between 0% and 95%. (A) The thickness of the external lamellar phase in contact with air depends on RH, and this phase disappears for RH > 85%. (B) The thickness of the hexagonal phase is independent of RH until the disappearance of the outer lamellar phase at RH > 85%. (C) The thickness of the micellar cubic phase is always independent of RH.
Fig. 5.
Fig. 5.
The increase in thickness of different phases in the interfacial layer as a function of time, as obtained from the optical microscopy images (Top) (POPC/OG/water system). The air RH varies between 0% and 95%. (A) The thickness of the external lamellar phase in contact with air depends on RH. (B) The thickness of the hexagonal phase is independent of RH.
Fig. S7.
Fig. S7.
Water composition vs. water activity (expressed as a RH) and sorption enthalpy vs. water content for (A and C) DDM/water and (B and D) POPC/OG/water obtained through isothermal sorption calorimetry at 23 °C. The DDM/water system displays a change in slope around 85% RH (A), indicative of a phase transition. This step in water uptake is associated with an endothermic heat effect, which is consistent with a hexagonal to lamellar phase transition. The weaker exothermic heat effect at lower water content has been previously observed for other alkylmaltoside systems and associated to a glass transition (30). No signs of phase transitions were observed for the POPC/OG/water system (B and D) over the range of water contents investigated.

References

    1. Schreiber L, et al. Effect of humidity on cuticular water permeability of isolated cuticular membranes and leaf disks. Planta. 2001;214(2):274–282. - PubMed
    1. Elias PM, Friend DS. The permeability barrier in mammalian epidermis. J Cell Biol. 1975;65(1):180–191. - PMC - PubMed
    1. Butovich IA, Millar TJ, Ham BM. Understanding and analyzing meibomian lipids—a review. Curr Eye Res. 2008;33(5):405–420. - PMC - PubMed
    1. Hoad S, Grace J, Jeffree C. Humidity response of cuticular conductance of beech (Fagus sylvatica L.) leaf discs maintained at high relative water content. J Exp Bot. 1997;48(11):1969–1975.
    1. Cravello B, Ferri A. Relationships between skin properties and environmental parameters. Skin Res Technol. 2008;14(2):180–186. - PubMed

Publication types

LinkOut - more resources