. 2016 Sep 13;113(37):E5399-407.
doi: 10.1073/pnas.1607327113. Epub 2016 Aug 29.

Reg4+ deep crypt secretory cells function as epithelial niche for Lgr5+ stem cells in colon

Affiliations

Reg4+ deep crypt secretory cells function as epithelial niche for Lgr5+ stem cells in colon

Nobuo Sasaki et al. Proc Natl Acad Sci U S A. .

Abstract

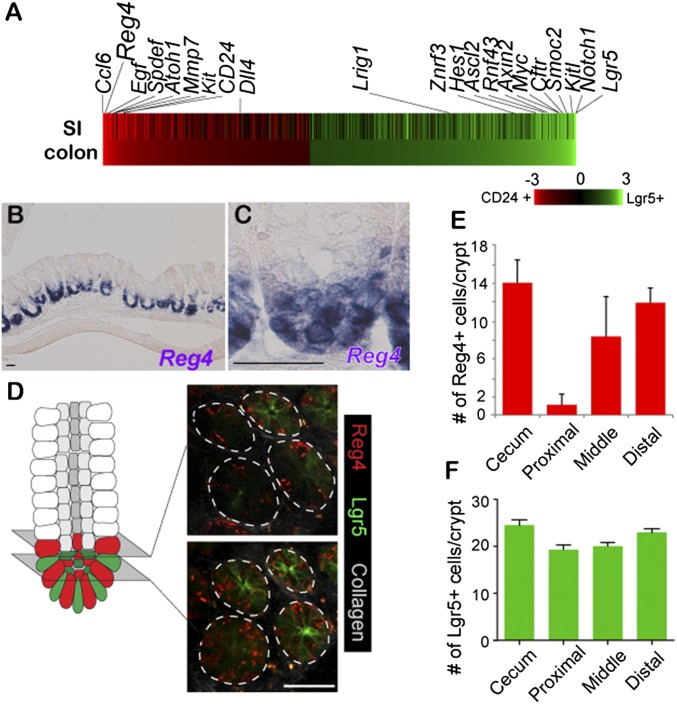
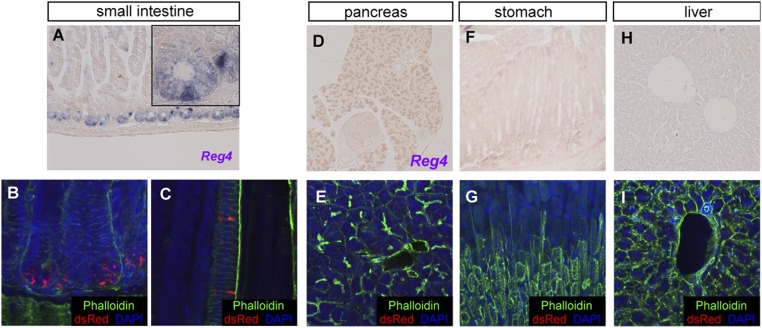
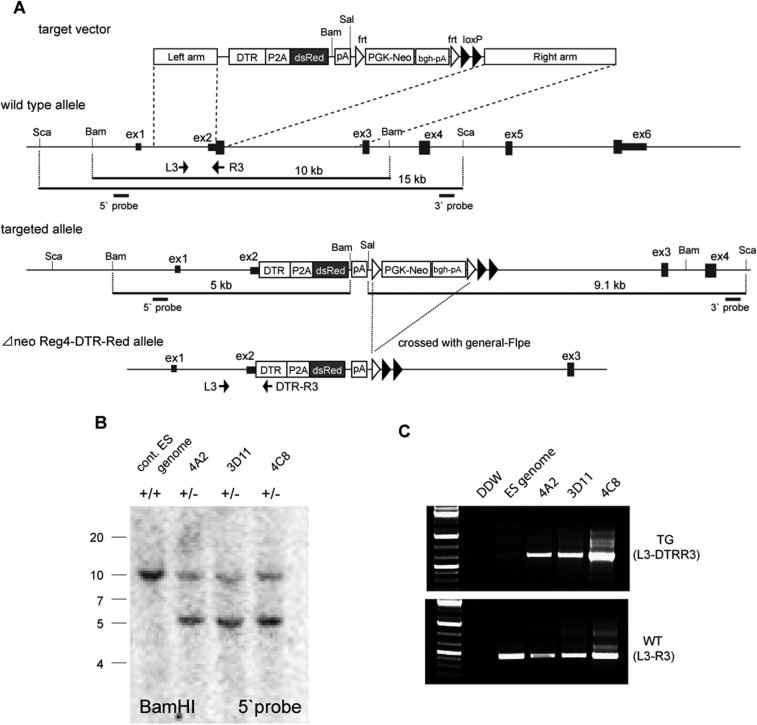
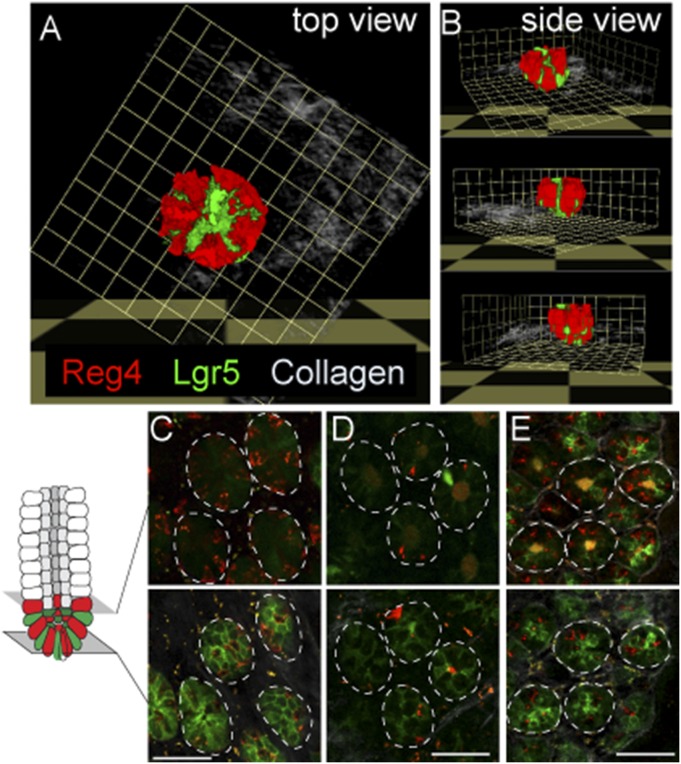
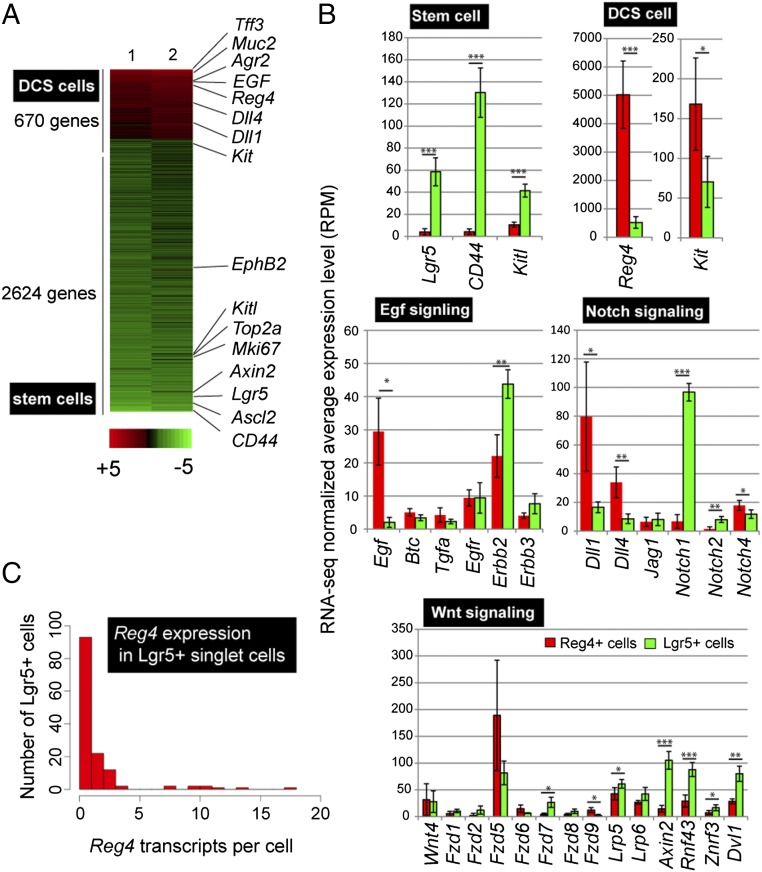
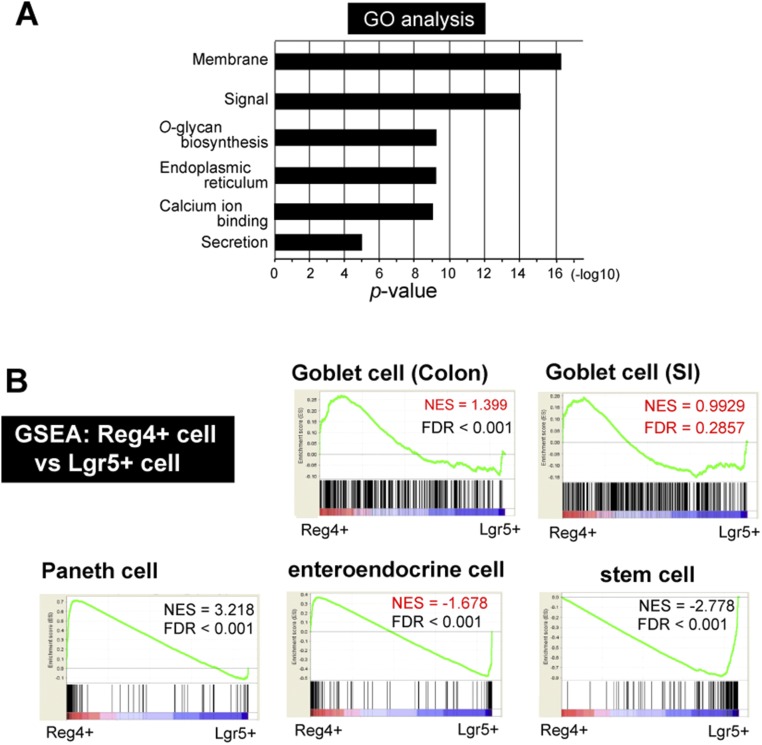
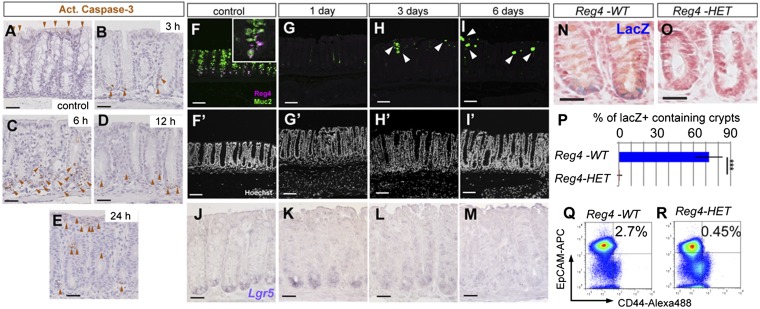
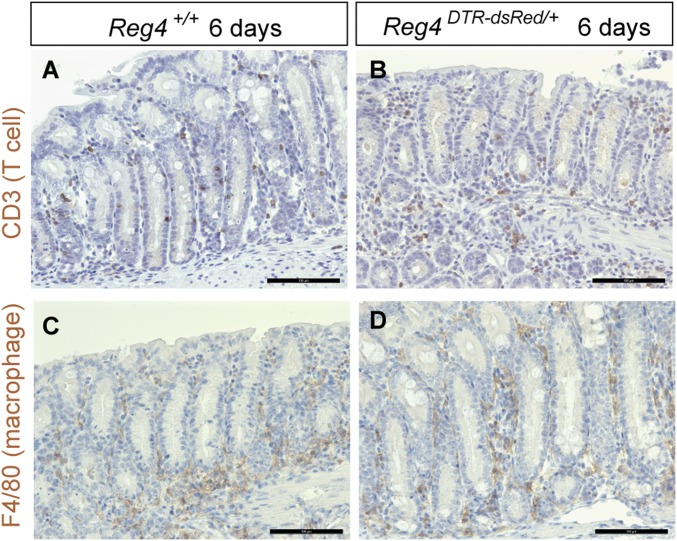
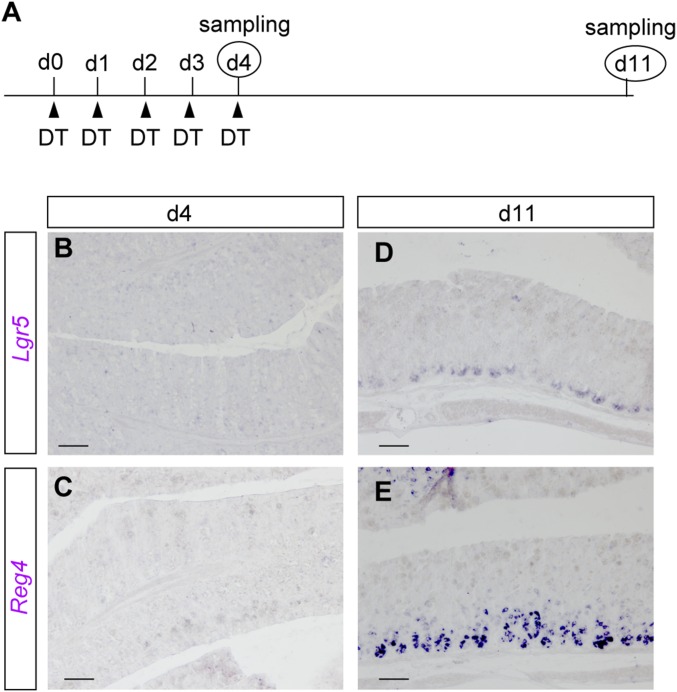
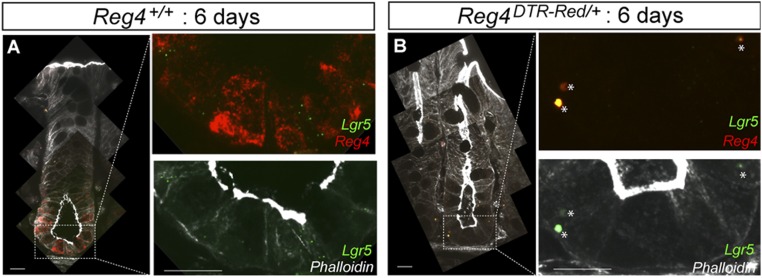
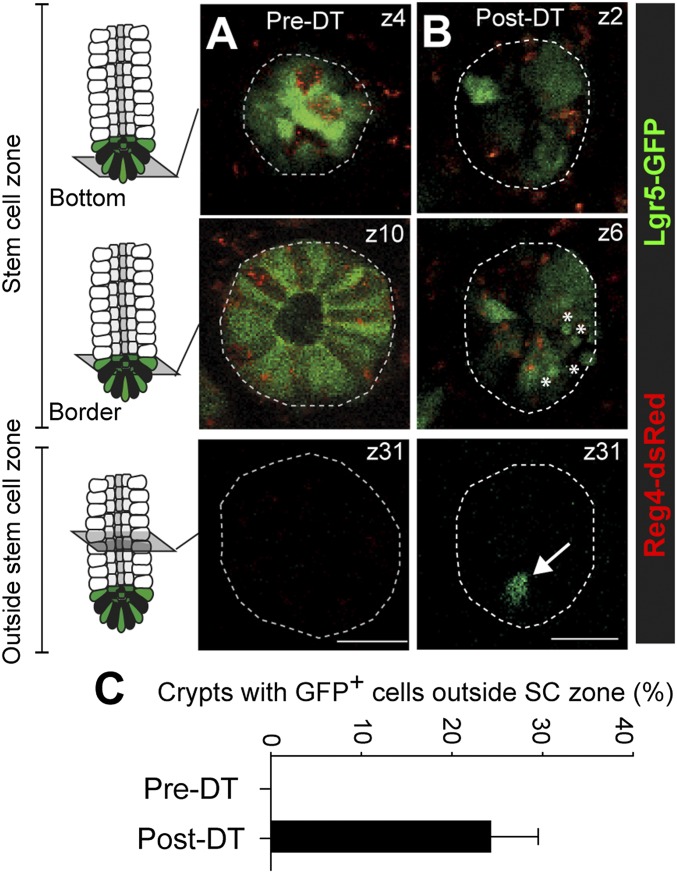
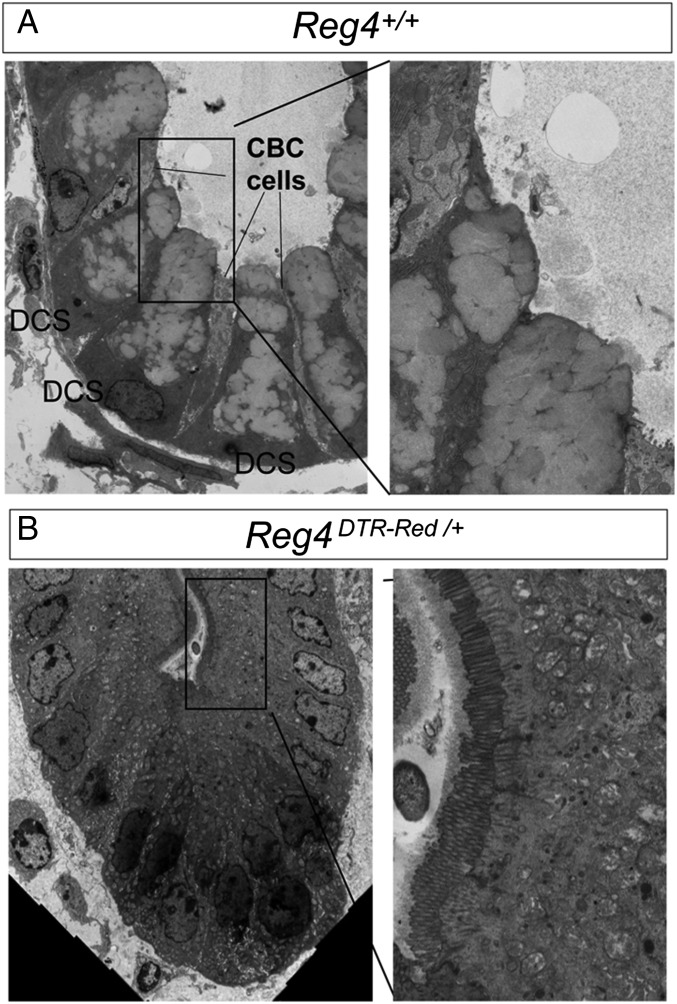
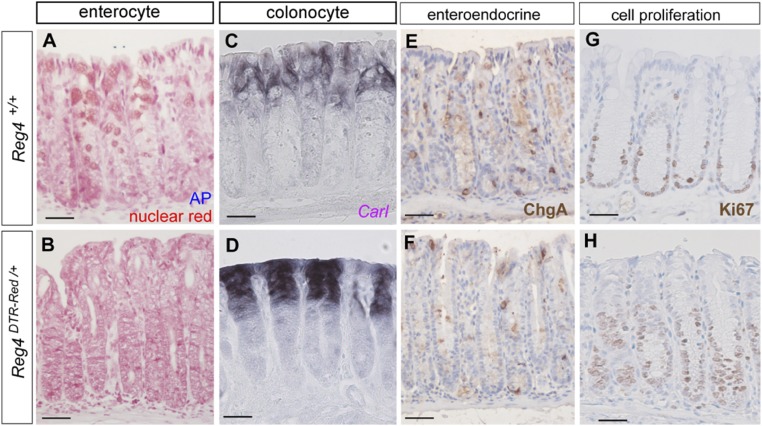
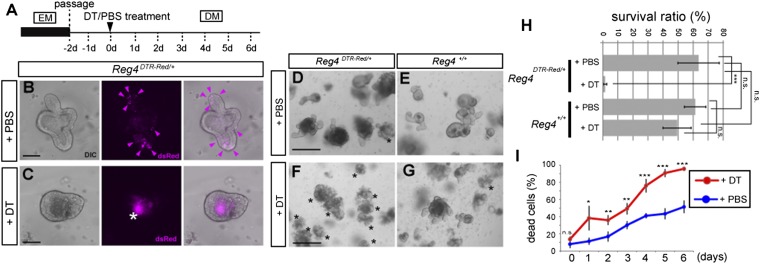
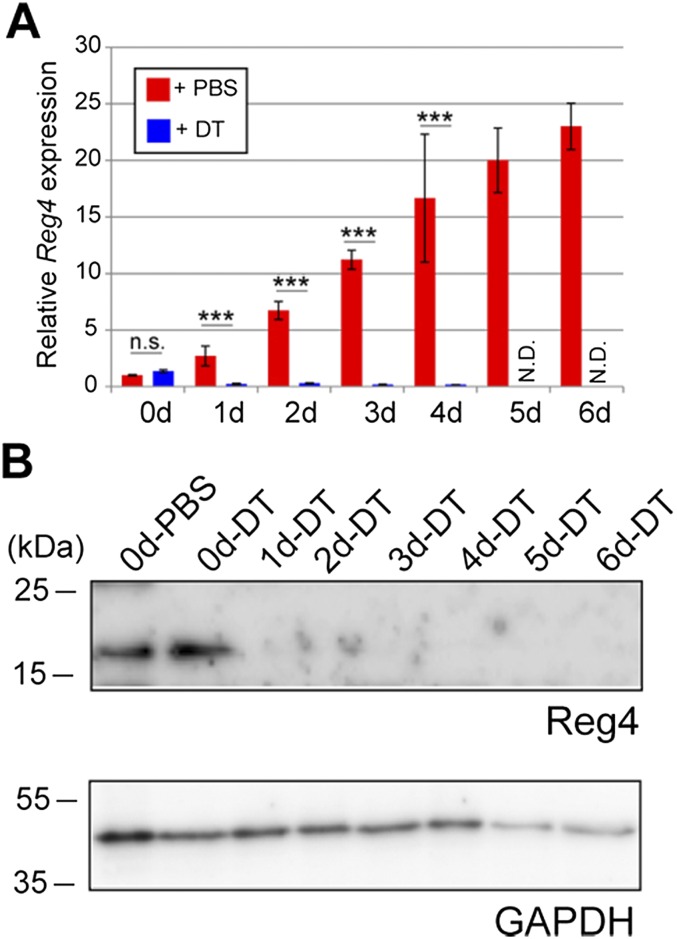
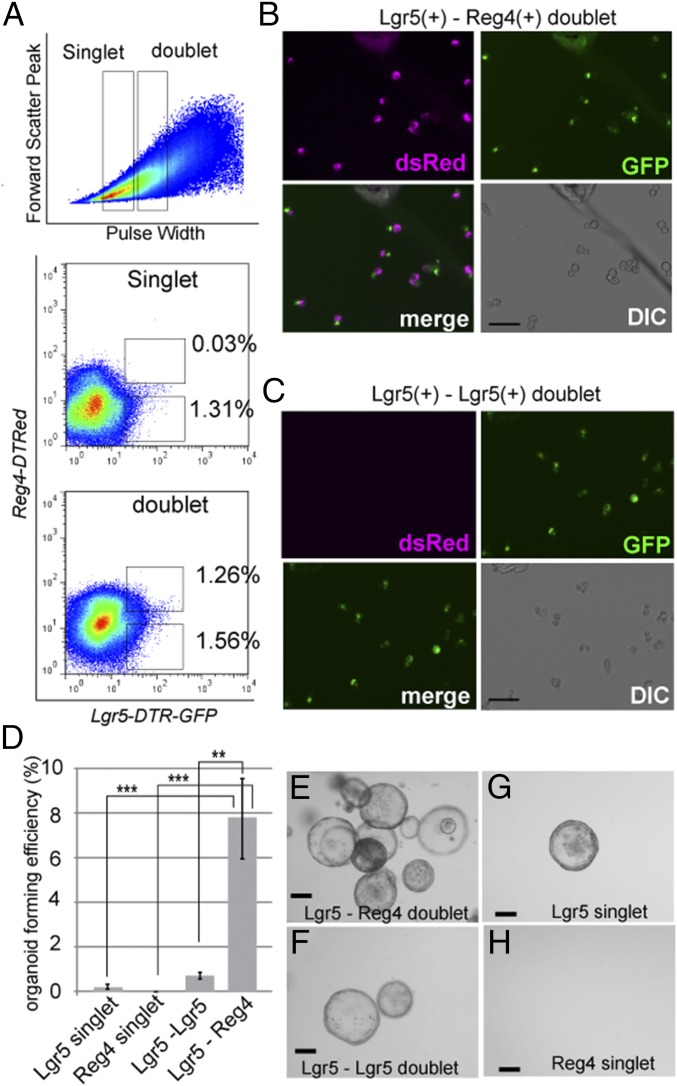
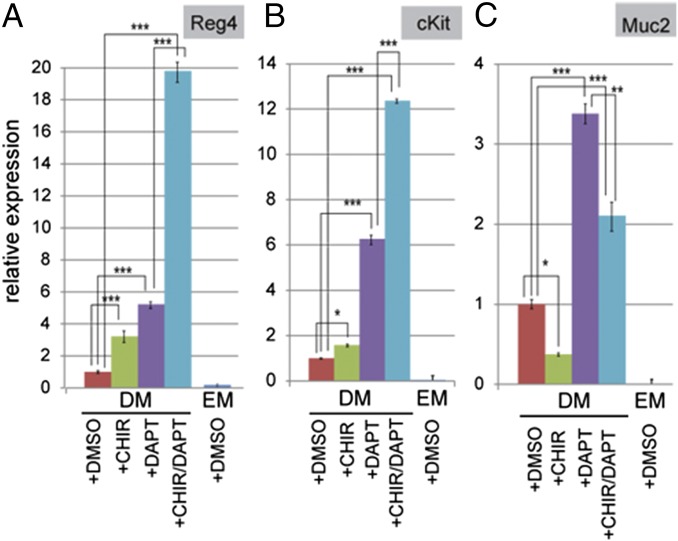
Leucine-rich repeat-containing G-protein coupled receptor 5-positive (Lgr5(+)) stem cells reside at crypt bottoms of the small and large intestine. Small intestinal Paneth cells supply Wnt3, EGF, and Notch signals to neighboring Lgr5(+) stem cells. Whereas the colon lacks Paneth cells, deep crypt secretory (DCS) cells are intermingled with Lgr5(+) stem cells at crypt bottoms. Here, we report regenerating islet-derived family member 4 (Reg4) as a marker of DCS cells. To investigate a niche function, we eliminated DCS cells by using the diphtheria-toxin receptor gene knocked into the murine Reg4 locus. Ablation of DCS cells results in loss of stem cells from colonic crypts and disrupts gut homeostasis and colon organoid growth. In agreement, sorted Reg4(+) DCS cells promote organoid formation of single Lgr5(+) colon stem cells. DCS cells can be massively produced from Lgr5(+) colon stem cells in vitro by combined Notch inhibition and Wnt activation. We conclude that Reg4(+) DCS cells serve as Paneth cell equivalents in the colon crypt niche.

Keywords: Lgr5; Reg4; deep crypt secretory cells; intestinal stem cell; niche.


Conflict of interest statement

The authors declare no conflict of interest.

Figures

Fig. 1.
Fig. 1.
Reg4 is a marker for DCS cells in colonic crypts. (A) Heat map of microarray expression experiments performed from sorted CD24+ cells versus Lgr5+ stem cells from SI and colon, respectively. (B and C) In situ hybridization performed on colon by using Reg4 mRNA probe, revealing Reg4 at bottoms of colon crypts (B); enlarged in C (n = 4 mice). (D) Intravital imaging of Reg4-DTR-dsRed/Lgr5-GFP living mouse at middle part of colon. Reg4+ DCS cells is defined by dsRed (red), and stem cells are visualized by GFP fluorescence (green) at the border (Upper Right), and at the central region of the stem cell niche (Lower Right). (E and F) Number of Reg4+ DCS cells and Lgr5+ stem cells per crypts in cecum, proximal, middle, and distal of colon. (n > 20). Error bars represent SD. (Scale bars: 50 µm.)
Fig. S1.
Fig. S1.
Reg4 is specifically expressed in the intestinal epithelium. Reg4 mRNA expression as detected by in situ hybridization (A, D, F, and H) and confocal dsRed (red) imaging counterstained with the Phalloidin (F-actin, green) and DNA dye (DAPI, blue) in Reg4-DTR-dsRed mouse (B, C, E, G, and I) confirms that Reg4 expression is observed in intestinal tissue (AE) but not the other tissues such as the pancreas (D and E), stomach (F and G), and liver (H and I). Reg4+dsRed expression is restricted in Paneth cells at the bottom of SI crypts and is observed in enteroendocrine cells in villus that has been reported by Grün et al. (19).
Fig. S2.
Fig. S2.
A knock-in strategy to generate Reg4DTR-Red mice. (A) The top boxes depict the structure of the targeting vector, the second line represents the genomic region of the Reg4 gene, and the third line is the predicted structure of the Reg4 locus following homologous recombination. Reg4 exons are shown in black boxes on the second line, and white boxes indicate the translated region of Reg4. The translation initiation codon of Reg4 was replaced with DTR-P2A-dsRed-poly(A), flanked with a floxed neo cassette and poly(A) signal. The PGK-neo cassette was removed by crossing with the Flpe mouse, which ubiquitously expresses FLP recombinase. (B) Southern blot of BamH digests showing clones 4A2, 3D11, 4C8, and wild-type clone with no insertion, using the 5′ probe shown in A. The lower band (10 kb) represents the correctly targeted ES clone containing the insertion. The WT Reg4 allele (15 kb) was present in each positive clone and wild type. (C) PCR screening of ES cells confirmed the presence of DTR. At the 5′ end, a sense primer (L3) was paired with an antisense Reg4 gene exon primer (R3). These primers amplified 447 bp from wild type (Lower). The sense primer (L3) was also paired with an antisense DTR cDNA primer (DTR-R3). These primers amplified 657 bp (Upper).
Fig. S3.
Fig. S3.
Relationship between Reg4+ DCS cells and Lgr5+ stem cells in each part of colon. (A and B) Three-dimension reconstruct of Lgr5+ GFP (green) and Reg4+ dsRed (red) in crypt bottom of middle-colon from lateral projection of a z stack and representative views from top (A) and side (B). (CE) Intravital imaging of Reg4+ DCS (red) and Lgr5+ GFP (green) in a different region of colon, cecum (C), proximal (D), and distal (E), respectively. (Scale bars: CE, 50 µm.)
Fig. 2.
Fig. 2.
Transcriptome analysis of Reg4+ DCS cells. (A) Comprehensive gene expression pattern analysis by RNA-seq using sorted Reg4+ DCS and Lgr5+ stem cells. Heat map was generated by using genes with a minimal mean fold change of 2 between the two cell types, after which 3,294 genes were left. DCS cell genes are indicated in red and stem cell genes are shown in green. (B) Average (RPM) value of genes encoding marker for DCS cells, stem cells, and pathway components of Egf signaling, Notch signaling and Wnt signaling in Reg4+ cells (red) and Lgr5+ cells (green). Mean and SD are shown (n = 4). P values from two-tailed Student’s t test: *P < 0.05, **P < 0.01, ***P < 0.001. (C) Histogram shows the number of detected Reg4 transcripts in Lgr5+ sorted single cells. Transcriptomes of all cells with >1,500 transcripts were downsampled to 1,500 total transcripts.
Fig. S4.
Fig. S4.
Characterization of gene signature of Reg4+ DCS cells in RNA-seq. (A) GO enrichment analysis for differentially expressed genes in Reg4+ DCS cells. The y axis shows the P value (−log10). (B) GSEA. Genes significantly enriched in Reg4+ (red, Left) and Lgr5+ (blue, Right) population are given on the x axis. Input gene sets were generated from public datasets: “Goblet cells in colon” and “Goblet cells in SI” were defined as the 200 most highly expressed in CD45/CD24/CK18+/UEA-1+ Goblet cells (GEO: GSE52418), 200 most differentially expressed genes in “Paneth cells genes” from sorted Paneth cells vs.Lgr5+ stem cells, in “enteroendocrine (ee) cells” from sorted ee cells vs. Lgr5+ stem cells (GEO: GSE25109), and “stem cell genes” in Lgr5-GFP high stem cells vs. Lgr5-GFP low daughter cells (GSE25109). FDR, false discovery rate; NES, normalized enrichment score. Reference of Goblet cell of Colon and SI; highly expressed in CD24 CK18+ UEA-1+ population (top 200 genes) Knoop et al. (24), Paneth, and enteroendocrine cell; genes enriched in sorted Paneth or enteroendocrine cells versus sorted Lgr5 stem cells (top 200 genes) Sato et al. (8), stem cell; Lgr5-GFP high versus low (top 200 genes) Muñoz et al. (25).
Fig. 3.
Fig. 3.
Lgr5+ colonic stem cells are lost upon ablation of DCS cells. (AE) Active caspase-3 staining on DT-injected Reg4+/+ control mouse (A, n = 8 mice) and DT-injected Reg4DTR-Red mice at 3 h (B, n = 2 mice), 6 h (C, n = 2 mice), 12 h (D, n = 2 mice), and 24 h (E, n = 2). Apoptic cells were detected at the bottoms of crypts after administration of DT in Reg4DTR-Red mice (brown arrowheads in BE), but not seen in control mice (A). (FI) Daily DT administration for up to 6 d deleted DCS cells completely from colonic crypts. (F) Reg4 (magenta) and Muc2 (green) double positive-DCS cells were detected at the bottom part of crypt in DT-treated control Reg4+/+ mouse for 6 d (n = 6 mice). (G) One shot of DT eliminated all DCS cells and Goblet cells within 24 h (n = 6 mice). (H and I) DT treatment for 3 d (H, n = 4 mice) and 6 d (I, n = 4 mice) prevented reemergence of Reg4+ DCS cells, but a few goblet cells reappeared (white arrowheads). (F′–I′) Nuclei are stained with Hoechst (white). (JM) Representative Lgr5 mRNA expression detected by a classical in situ hybridization in Reg4DTR-Red/+ mice. Lgr5 was present at the crypt bottoms of control (J, n = 8 mice) and after 1 d of DT treatment (K, n = 4 mice). The Lgr5 expression level became weaker after 3 d of DT (L, n = 4 mice) and was hardly detected for 6 d of DT treatment (M, n = 4 mice). (N–P) Visualization of stem cells in Lgr5-lacZ reporter mice in colonic crypts. Expression of lacZ was located at crypt base in Reg4+/+::Lgr5-lacZ (Reg4-WT) control mice 6 d after DT administration (N, n = 3 mice). No lacZ-positive cells were observed in Reg4DTR-Red/+::Lgr5-lacZ (Reg4-HET) mice 6 d after DT injection (O, n = 3 mice). (P) Quantification of Lgr5-lacZ–positive cells containing crypts in Reg4+/+::Lgr5-lacZ (Reg4-WT) control (n = 694 independent crypts in 4 mice) and Reg4DTR-Red/+::Lgr5-lacZ (Reg4-HET) (n = 1,087 independent crypts in 4 mice). (Q and R) FACS analysis of CD44+/EpCAM+ stem cell population from colonic crypts of Reg4-WT (Q, n = 3) control and Reg4-HET mice (R, n = 3) 6 d after DT injection. (Scale bars: AE and JM, 50 µm; FI, 100 µm.)
Fig. S5.
Fig. S5.
Loss of Goblet cells in administrated Reg4-DTR-dsRed mice does not cause inflammation. Immunohistochemistory for CD3 (A and B) to detect T cells and F4/80 (C and D) to detect macrophages in colonic crypts from Reg4+/+ (A and C) and Reg4DTR-Red/+ (B and D) upon 6 d of DT administration. (Scale bars: 100 µm.)
Fig. S6.
Fig. S6.
Lgr5+ stem cells recover again after their disappearance. (A) Dosing regimen used to follow the dynamics of Lgr5+ stem cell upon elimination of DCS cells. Reg4DTR-Red/+ mice were administrated DT daily for 4 d, and then kept for an additional 7 d without DT injection. (BE) Lgr5 (B and D) and Reg4 (C and E) mRNA expression pattern after five daily DT injections (B and C), and 7 d after last DT-injected mouse (D and E). (Scale bars: 100 µm.)
Fig. S7.
Fig. S7.
Confirmation of the phenotype of missing Lgr5+ stem cells by high sensitive single-molecule FISH. Shown are high sensitive two-color single molecule FISH using Lgr5 (green) and Reg4 (red) probes. Apical actin network was stained by phalloidin (white). Lgr5 is expressed between Reg4-expressing cells at crypt bottoms of Reg4+/+ upon 6 d of DT injection (A and B = 4 mice). Both Lgr5 and Reg4 expressions were not detected in Reg4DTR-Red/+ upon 6 d of DT administration (B). Asterisks indicate nonspecific signals. (Scale bars: 20 µm.)
Fig. 4.
Fig. 4.
Lgr5+ stem cell dynamics upon elimination of DCS cells in living Reg4DTR-Red mice. (A and B) Intravital imaging of Lgr5-GFP::Reg4DTR-Red mice to follow the dynamics of colonic stem cells and DCS cells after targeted ablation of Reg4+ cells (in red), induced by 4–6 d of DT administration. Shown are representative x-y images of crypts at indicated z-stack positions, without treatment (A) and after administrations of DT (B). Note the appearance of Lgr5+ cells (green) outside the stem cell zone upon depletion of Reg4+ cells (indicated by an arrow at B, Lower). Apoptotic bodies are indicated by asterisks (B, Middle). Dotted lines indicate crypts. (C) Graph shows presence of Lgr5+ cells outside the stem cell zone in crypts before and after depletion of Reg4+ cells (n = 179 and 167 crypts pre-DT and post-DT respectively, in 3 mice). Error bars represent SEM. (Scale bars: 25 µm.)
Fig. 5.
Fig. 5.
Cell fate determination of colonic epithelium is disturbed without Reg4+DCS cells. (A and B) Transmission electron microscopy showing ablation of CBC cells and DCS cells and the presence immature enterocyte cells having numerous brush borders in Reg4DTR-Red/+ mouse upon DT administration (B) in comparison with control mice (A).
Fig. S8.
Fig. S8.
Marker expression analysis of crypts after DT administration. (A and B) Alkaline phosphatase staining (enterocyte, blue) and nuclei are stained with nuclear red (red) as a counterstain in control (A) and Reg4DTR-Red/+ mouse 6 d after DT injections (B). (C and D) In situ hybridization using CarI-specific antisense mRNA probe (purple, colonocyte marker) in control (C) and Reg4DTR-Red/+ mouse 6 d after DT injections (D). (EH) Immunohistochemistry analysis of ChgA (E and F: enteroendocrine cell), and Ki67 (G and H) are carried out in control (E and G) and Reg4DTR-Red/+ (F and H) 6 d after DT administration. (Scale bars: 50 µm.)
Fig. 6.
Fig. 6.
DCS cells are required for maintenance of colon organoids. (A) Dosing regimen used to study the elimination of Reg4+ cells in Reg4DTR-Red/+ colonic organoid. DM, differentiation medium; EM, expansion medium. (B and C) Organoids derived from isolated colonic crypts of Reg4DTR-Red/+ mouse were cultured in differentiation medium with PBS (B) or 67 ng⋅mL−1 DT (C) for 3 d. The expression of dsRed (magenta) was observed at budding structures in PBS-treated organoids (B, arrowheads) and inside lumen in DT-treated organoids (as auto-fluorescent background signal of apoptotic cells, asterisk) (C). Images are representative of four independent experiments. (DG) Effect of deletion of Reg4+ DCS cell in colonic organoid derived from Reg4DTR-Red/+ (D and F) and wild type (E and G). Organoids after treatment with DT (F and G) or PBS (D and E) for 6 d. Asterisks indicate dead organoids. Reg4DTR-Red/+ treated with DT organoids were lost. Images are representative of four wells as biological replicates and repeated in two independent experiments. (H) The survival ratios of each organoids are shown (mean ± SD for four wells as biological replicates and repeated in two independent experiments) by two-way analysis of variance (ANOVA). (I) The percentage of dead cells of Reg4DTR-Red/+ organoids counted by FACS using propidium iodide in the presence of DT (red) and PBS (blue). Data are representative of four times technical repeated with mean ± SD (two-tailed Student's t test). *P < 0.05, **P < 0.01, ***P < 0.001, n.s., not significant. (Scale bars: B and C, 20 µm; DG, 100 µm.)
Fig. S9.
Fig. S9.
Confirmation of Reg4 expression at both mRNA and Protein level. Time course of Reg4 mRNA expression in Reg4DTR-Red/+ organoid that was treated by DT and PBS at 0, 1, 2, 3, 4, 5, and 6 d after DT administration. (A) qRT-PCR analysis represented mRNA expression of Reg4 in Reg4DTR-Red/+ organoids cultured with PBS (red) and DT (blue). (B) Western blot analysis of Reg4 and GAPDH was used as a loading control.
Fig. 7.
Fig. 7.
Reg4+ DCS cells promote organoid formation from sorted colonic stem cells. (A) FACS plots of dissociated single cells from Reg4DTR-Red/+::Lgr5DTR-GFP/+ colon. Singlets and doublets are gated by forward scatter peak and pulse width parameter. Reg4-dsRedhi/Lgr5-GFPhi events are only observed in the doublet gate (frequency of doublet events: 1.26 ± 0.105%, singlets: 0.0323 ± 0.0119%). (B and C) Lgr5+ stem cell (green)-Reg4+ DCS cells (magenta) doublets (B, Lgr5-GFPhi/Reg4-dsRedhi) and Lgr5 stem cell doublets (C, Lgr5GFPhi/Reg4dsRedneg) were sorted and imaged by inverted microscope. Images are representative of three independent experiments. (D) Plating efficiency of Lgr5 stem cells-DCS doublets, Lgr5 stem cell doublets, single Lgr5 stem cells, and Reg4+ cells. For each, 1,000 singlets or doublets were embedded in matrigel, and numbers of organoids were counted 10 d after plating. y axis indicates organoid-forming efficiency as a percentage of total number of plated cells (mean ± SD for three independent experiments by two-way ANOVA. **P < 0.01, ***P < 0.001. (EH) Organoids are formed from Lgr5-Reg4 doublets (E). Far fewer organoids were formed from Lgr5-Lgr5 doublet or Lgr5 singlets (F and G). Sorted Reg4 singlet never formed organoids (H). Images are representative of three independent experiments. (Scale bars: B and C, 20 µm; E and F, 100 µm.)
Fig. 8.
Fig. 8.
Forced differentiation of colonic stem cells into DCS cells. Quantitative real-time PCR analysis of relative mRNA expression of markers for colon DCS cells (Reg4 and cKit in A and B) and Goblet cells (Muc2 in C) cultured for 7 d under conditions as indicated. Reg4DTR-Red colon organoids culture in expansion medium (EM) or in differentiation medium (DM) with DMSO, 3 µM CHIR, 10 µM DAPT, and a combination of 3 µM CHIR/10 µM DAPT. y axis indicates relative gene expression. Error bars indicate mean ± SD for three wells as biological replicates and repeated in two independent experiments (two-way ANOVA). *P < 0.05, **P < 0.01, and ***P < 0.001.
Fig. S10.
Fig. S10.
Enteroendocrine marker genes expression in Reg4+ cells in colon. Average RPM of enteroendocrine cells markers, ngn-3, NeuroD1, pdx1, synaptophysyn, and pax-4/-6 in Reg4-expressing cells at colonic crypts from RNA-seq data performed in Fig. 2. Those marker genes expression were hardly detected (only a few expression <3 RPM).

References

    1. Lane SW, Williams DA, Watt FM. Modulating the stem cell niche for tissue regeneration. Nat Biotechnol. 2014;32(8):795–803. - PMC - PubMed
    1. Schofield R. The relationship between the spleen colony-forming cell and the haemopoietic stem cell. Blood Cells. 1978;4(1-2):7–25. - PubMed
    1. Morrison SJ, Spradling AC. Stem cells and niches: Mechanisms that promote stem cell maintenance throughout life. Cell. 2008;132(4):598–611. - PMC - PubMed
    1. Morrison SJ, Scadden DT. The bone marrow niche for haematopoietic stem cells. Nature. 2014;505(7483):327–334. - PMC - PubMed
    1. Clevers H. The intestinal crypt, a prototype stem cell compartment. Cell. 2013;154(2):274–284. - PubMed

Publication types

MeSH terms