. 2016 Oct;17(10):1197-1205.
doi: 10.1038/ni.3554. Epub 2016 Aug 29.

TFH cells progressively differentiate to regulate the germinal center response

Affiliations

TFH cells progressively differentiate to regulate the germinal center response

Jason S Weinstein et al. Nat Immunol. 2016 Oct.

Abstract

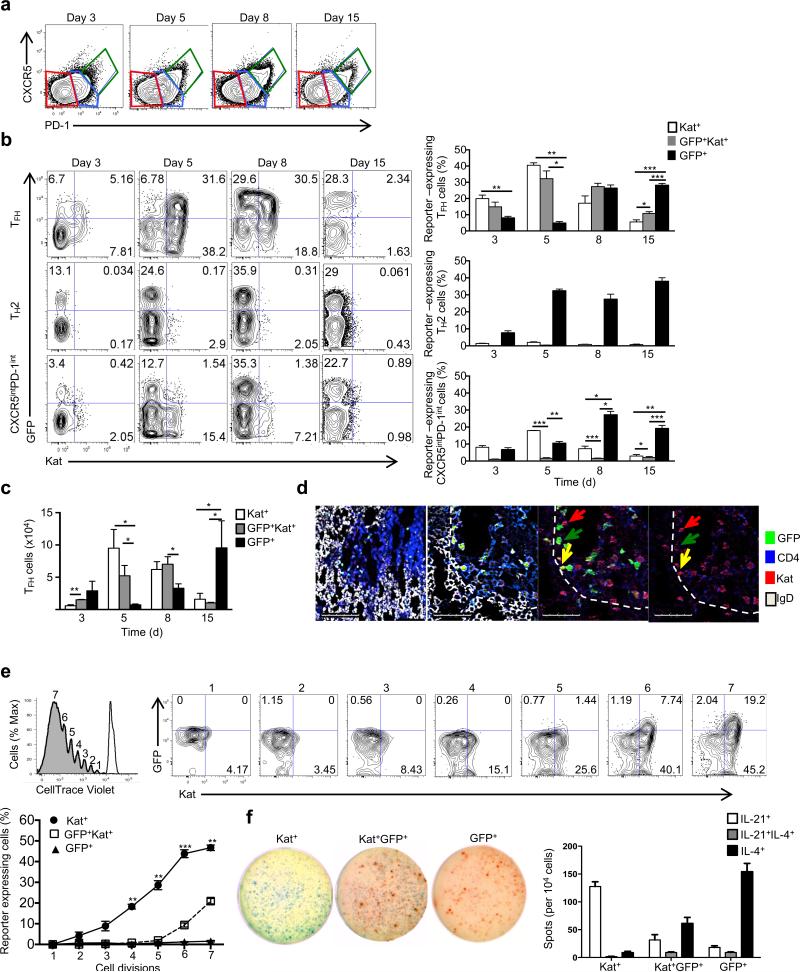
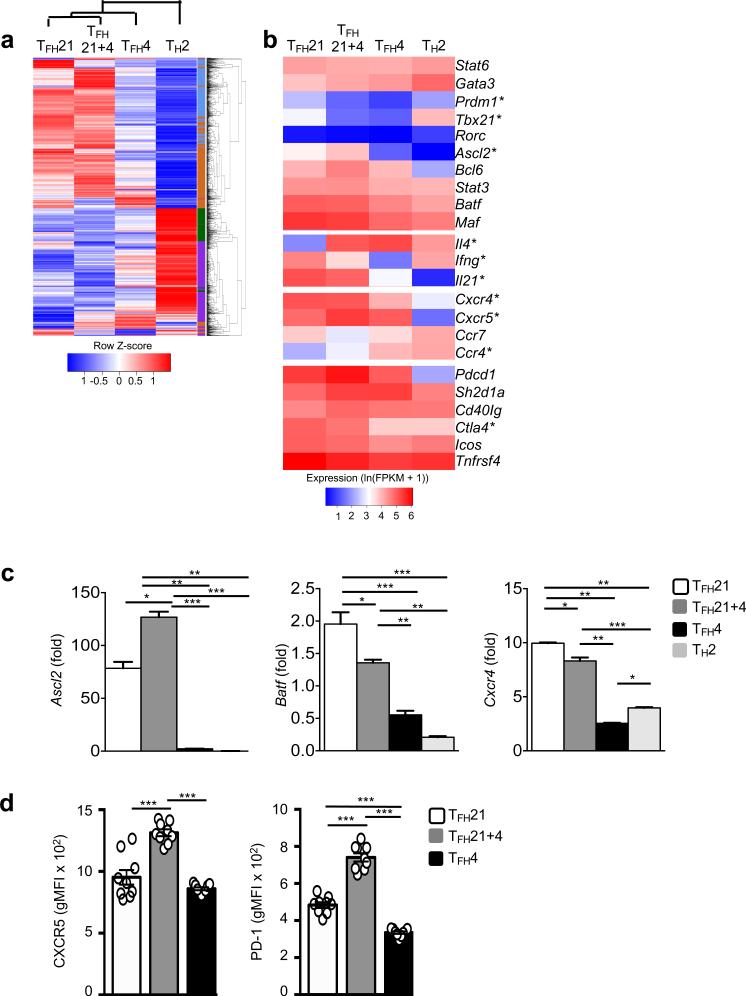
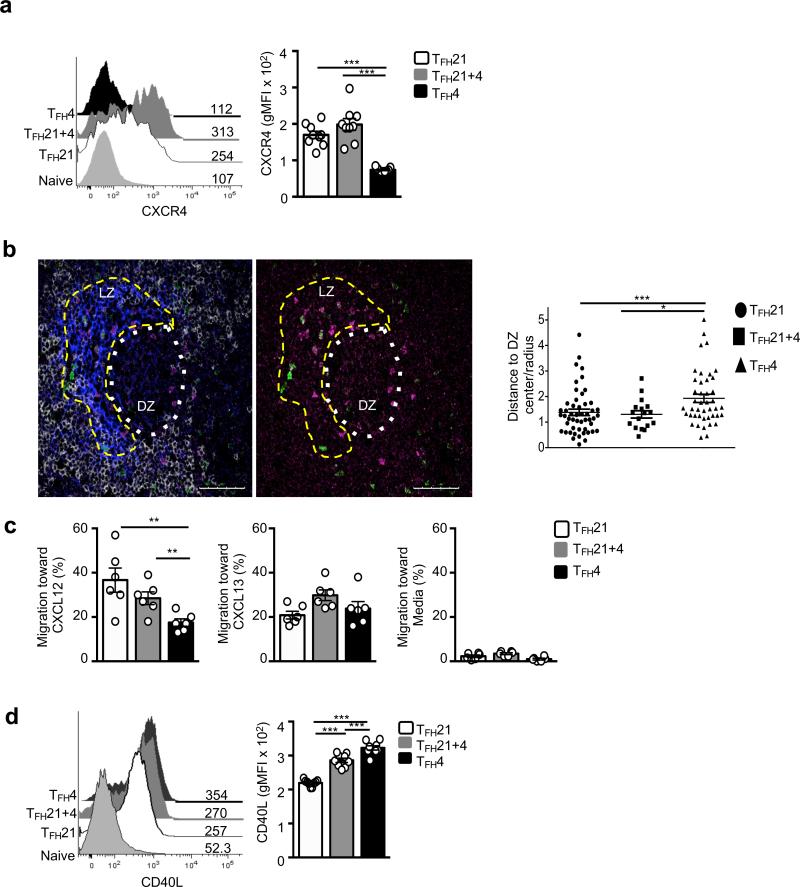
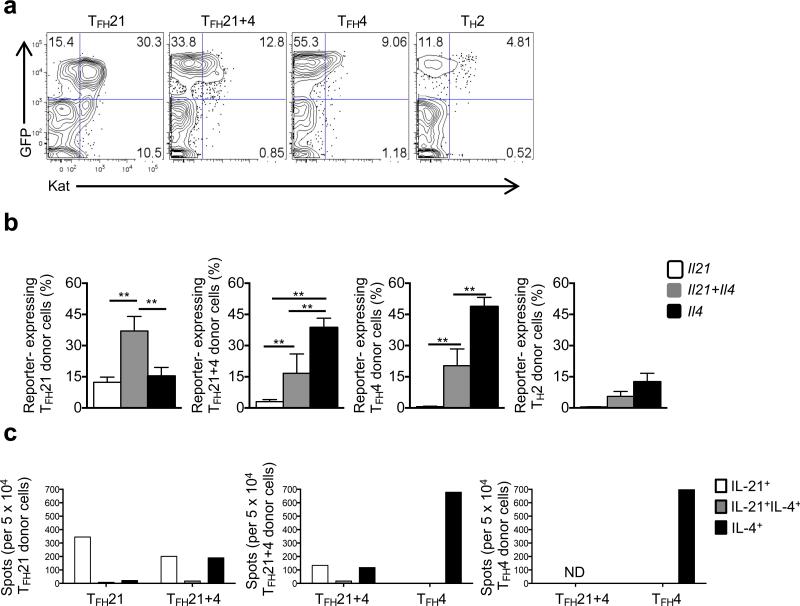
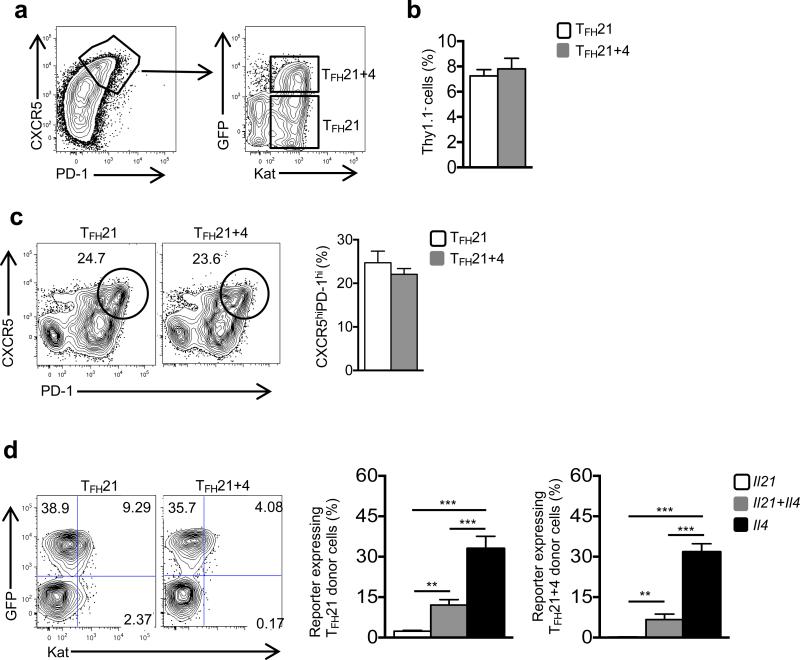
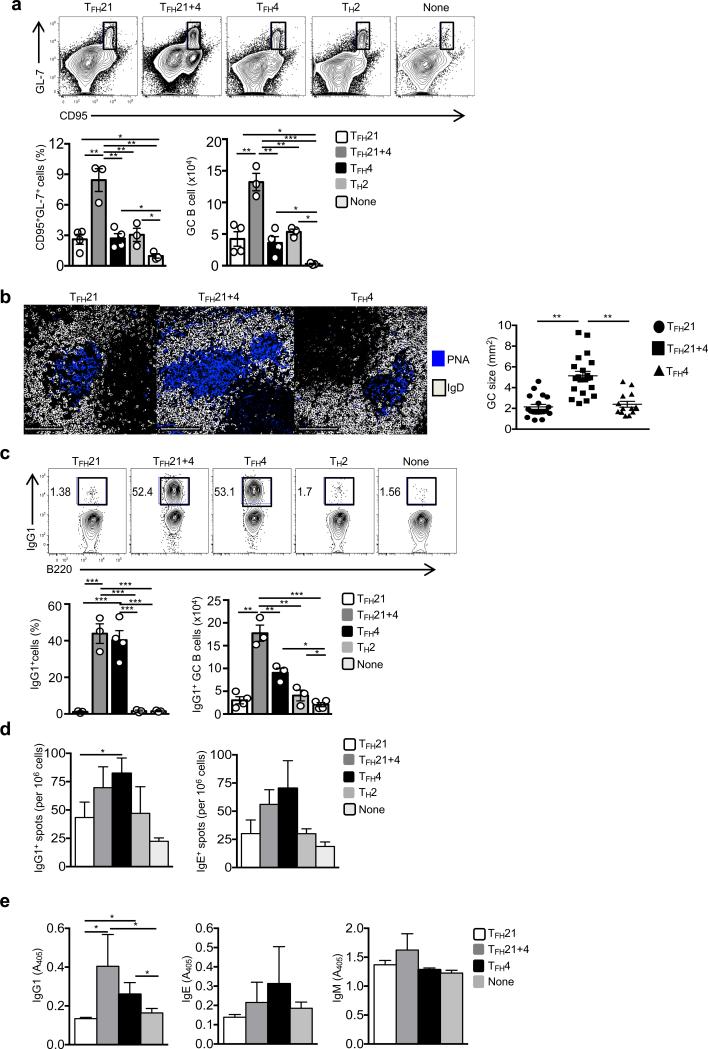
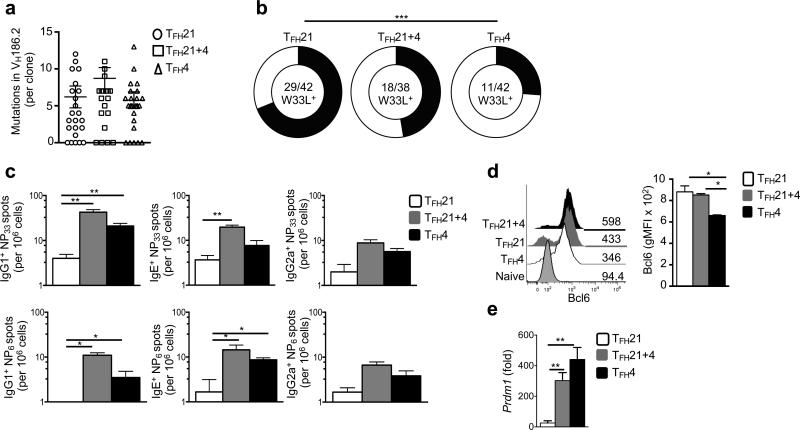
Germinal center (GC) B cells undergo affinity selection, which depends on interactions with CD4(+) follicular helper T cells (TFH cells). We found that TFH cells progressed through transcriptionally and functionally distinct stages and provided differential signals for GC regulation. They initially localized proximally to mutating B cells, secreted interleukin 21 (IL-21), induced expression of the transcription factor Bcl-6 and selected high-affinity B cell clones. As the GC response evolved, TFH cells extinguished IL-21 production and switched to IL-4 production, showed robust expression of the co-stimulatory molecule CD40L, and promoted the development of antibody-secreting B cells via upregulation of the transcription factor Blimp-1. Thus, TFH cells in the B cell follicle progressively differentiate through stages of localization, cytokine production and surface ligand expression to 'fine tune' the GC reaction.


Figures

Figure 1
Figure 1
Il21-Kat+Il4-GFP TFH cells transition to Il21-KatIl4-GFP+ TFH cells upon N. brasiliensis infection of Il21Kat/+Il4GFP/+ mice. (a) Flow cytometry of CD4+CD44hi splenocytes from Il21Kat/+Il4GFP/+ mice, showing CXCR5hiPD-1hi TFH (green), CXCR5intPD-1int (blue), and CXCR5loPD-1lo TH2 (red) cells. (b) Flow cytometry of GFP (Il4) and Kat (Il21) reporter-expressing cells, gated as a. (c) Quantification of TFH cells. (d) Confocal microscopy of GCs from Il21Kat/+Il4GFP/+ mice 7 days post-infection, stained with anti-GFP (green), -CD4 (blue), -Turbo635 (red), and -IgD (white) (left 2 images); anti-GFP (green), -CD4 (blue), and -Turbo635 (red) (third image from left); and anti-CD4 (blue) and -Turbo635 (red) (far right image). Green, yellow, and red arrows indicate Il21Il4+ (KatGFP+), Il21+Il4+ (Kat+GFP+), and Il21+Il4 (Kat+GFP) CD4+ cells, respectively. (e) Flow cytometry of CellTrace Violet labeled donor CD4+Thy1.2+ Il21Kat/+Il4GFP/+ OT-II cells in Thy1.1 recipient spleens at 5 days post-infection and NP-OVA administration. Histogram showing dividing (shaded) and undivided (open; unimmunized control) donor cells (upper left) and summary of fraction of cytokine+ CXCR5+ cells among total TFH cells (lower left). (f) Dual-color ELISPOTs of sorted reporter+ TFH cells 8 days post-infection (as in b). Representative ELISPOTs (left) and total number of counted IL-21+ (blue), IL-4+ (red), and IL-21+IL-4+ spots (purple) for each TFH cell population (right). *P < 0.05; **P < 0.01; ***P < 0.001 (Student's t-test). Error bars represent standard error of the mean (SEM). Data are from one experiment representative of three independent experiments with similar results, with three or four (a,b), three or five (c), or three (f) mice per group.
Figure 2
Figure 2
Il21 and Il4 expression define transcriptionally distinct populations of TFH cells. (a) Heatmap of significantly (q < 0.05) differentially expressed genes (rows) in the four populations of cytokine expressing TFH cells (columns). Light blue: cluster 1; magenta: cluster 2; light brown: cluster 3; green: cluster 4. (b) Heatmap of selected T cell-related genes. (c) Quantitative RT-PCR validation of selected genes, normalized to Hprt. (d) Flow cytometric quantification of geometric mean fluorescence intensity (gMFI) for CXCR5 and PD-1 expression from each TFH cell population. * q < 0.05 (False discovery rate (FDR)-adjusted, comparing TFH21 and TFH4 cells, b) and *P < 0.05 (c, d); **P < 0.01; ***P < 0.001 (Student's t-test, c-d). Error bars represent SEM. FPKM: Fragments Per Kilobase of transcript per Million mapped reads. Analysis utilizes data from two independent experiment with 25 and 30 mice each (a-b), is representative of two independent (of each other and of a-b) experiments performed in technical triplicates with 15 and 20 mice each (c), or is from one experiment representative of three independent experiments with four mice per group (d).
Figure 3
Figure 3
TFH21 and TFH4 cells differentially localize in the GC with distinctive expression of CXCR4 and CD40L. (a) Flow cytometric quantification of CXCR4 expression in TFH cell populations and naïve CD4+ T cells. (b) Confocal microscopy of splenic GCs from Il21Kat/+Il4GFP/+ mice 10 days post-infection with N. brasiliensis, stained with anti-IgD (white), -CD35 (blue), -Turbo635 (red) and -GFP (green). (c) Migration assay measuring ratio of migrating to total TFH cell subsets from Il21Kat/+Il4GFP/+ mice 8 days post-infection, co-cultured with CXCL12, CXCL13, or media, (d) Flow cytometric quantification of CD40L in TFH cell subsets. *P< 0.05, **P < 0.01; ***P < 0.001 (Student's t-test, a,c,d). Error bars represent SEM. Data are from one experiment representative of three independent experiments (b-d), with seven (a), four (b), six (c), or eight (d) mice per group.
Figure 4
Figure 4
TFH cells modulate cytokine production after helminth infection. Flow cytometry (a , b) and dual-color IL-21 and IL-4 ELISPOT assays (c) of donor Thy1.2+ TFH cells from Il21Kat/+Il4GFP/+ mice at 8 days post-infection with N. brasiliensis, transferred into Thy1.1+ Stg recipient mice and re-infected. *P < 0.05 **P < 0.01 (Student's t-test, b,c). Error bars represent SEM. N.D.: not detected. Data are from one experiment representative of three independent experiments, with three mice per group.
Figure 5
Figure 5
TFH cells transferred to Stg recipients five days after N. brasiliensis infection primarily become TFH4 cells upon reinfection. (a, b) Flow cytometry of splenic donor Thy1.2+ TFH cells at 5 days after infection of Thy1.2+ (Thy1.1) Il21Kat/+Il4GFP/+ mice, before transfer into Thy1.1+ Stg recipients. (c) Flow cytometry of donor CD4+Thy1.1 TFH cells at 13 days after secondary infection of Thy1.1+ Stg recipients. (d) Flow cytometry measuring GFP (Il4) and Kat (Il21) expression in donor TFH cells from recipient spleens 13 days following infection (left) with percentages among donor cells (right). **P< 0.01; ***P < 0.001 (Student's t-test, d). Error bars represent SEM. Data are from one experiment representative of three independent experiments, with four mice per group.
Figure 6
Figure 6
Distinct TFH cell populations differentially regulate the GC response. (a) Flow cytometry of splenic CD4B220+IgDloCD95+GL-7+ GC B cells in Stg recipients at 13 days after transfer of indicated TFH cells from mice infected 8 days prior with N. brasiliensis. (b) Confocal microscopy of representative splenic follicles stained with anti-IgD (white) and PNA (blue). (c) Intracellular flow cytometry of IgG1 in GC B cells as in (a). (d) ELISPOT assays of splenic IgG1 (top left) or IgE antibody-secreting cells (ASCs, top right) among sorted B220+ B cells as in (a). (e) ELISA of Anti-N. brasiliensis IgG1 (left), IgE (middle), and IgM (right) in sera of recipient mice. *P < 0.05; **P < 0.01; ***P < 0.001 (Student's t-test). Error bars represent SEM. Data are from one experiment representative of three independent experiments, with four mice per group.
Figure 7
Figure 7
TFH21 cells promote development of higher affinity GC B cells compared to TFH4 cells. (a) Total mutations (framework and complementary determining regions), and (b) tryptophan (W) to leucine (L) point mutations at position 33, of the VH186.2 gene in sequences cloned from sorted and pooled GC B cells 13 days after administration of N. brasiliensis and NP-OVA with boosting to mice receiving transferred Il21Kat/+Il4GFP/+ OT-II+ TCR transgenic TFH cells (from mice infected 8 days prior with N. brasiliensis and NP-OVA; refer to Supplementary Fig. 7f) (c) ELISPOT assays of low (top) and high (bottom) affinity anti-NP+ IgG1+, IgE+, or IgG2a+ ASCs. (e) Intracellular Bcl-6 staining and (f) quantitative RT-PCR for Prdm1 expression in recipient CD4−B220+IgDloCD95+GL-7+ GC B cells after TFH-cell transfer and secondary infection (as in a). *P < 0.05; **P < 0.01; ***P < 0.001 (Fisher's exact test (b) and Student's t-test (c-e). Error bars represent SEM. Data are from one experiment representative of three independent experiments, with four mice per group.

Comment in

References

    1. King C, Tangye SG, Mackay CR. T follicular helper (TFH) cells in normal and dysregulated immune responses. Annu Rev Immunol. 2008;26:741–766. - PubMed
    1. Xu J, Foy TM, Laman JD, Elliott EA, Dunn JJ, Waldschmidt TJ, et al. Mice deficient for the CD40 ligand. Immunity. 1994;1(5):423–431. - PubMed
    1. Zaretsky AG, Taylor JJ, King IL, Marshall FA, Mohrs M, Pearce EJ. T follicular helper cells differentiate from Th2 cells in response to helminth antigens. J Exp Med. 2009;206(5):991–999. - PMC - PubMed
    1. Zotos D, Coquet JM, Zhang Y, Light A, D'Costa K, Kallies A, et al. IL-21 regulates germinal center B cell differentiation and proliferation through a B cell-intrinsic mechanism. J Exp Med. 2010;207(2):365–378. - PMC - PubMed
    1. Linterman MA, Beaton L, Yu D, Ramiscal RR, Srivastava M, Hogan JJ, et al. IL-21 acts directly on B cells to regulate Bcl-6 expression and germinal center responses. J Exp Med. 2010;207(2):353–363. - PMC - PubMed

MeSH terms