. 2017 Jun;22(6):865-873.
doi: 10.1038/mp.2016.139. Epub 2016 Aug 30.

p62 improves AD-like pathology by increasing autophagy

Affiliations

p62 improves AD-like pathology by increasing autophagy

A Caccamo et al. Mol Psychiatry. 2017 Jun.

Retraction in

Abstract

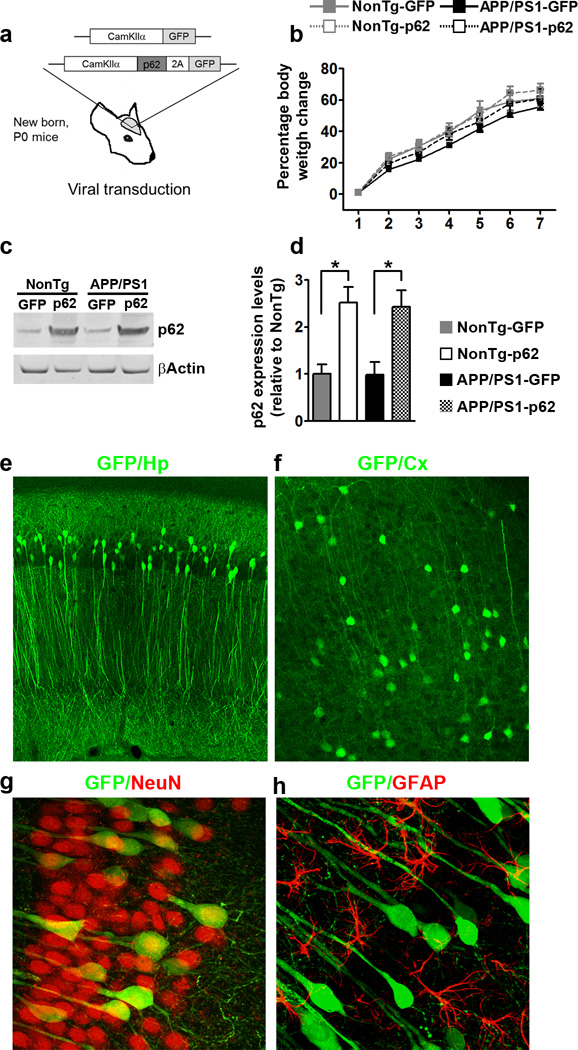
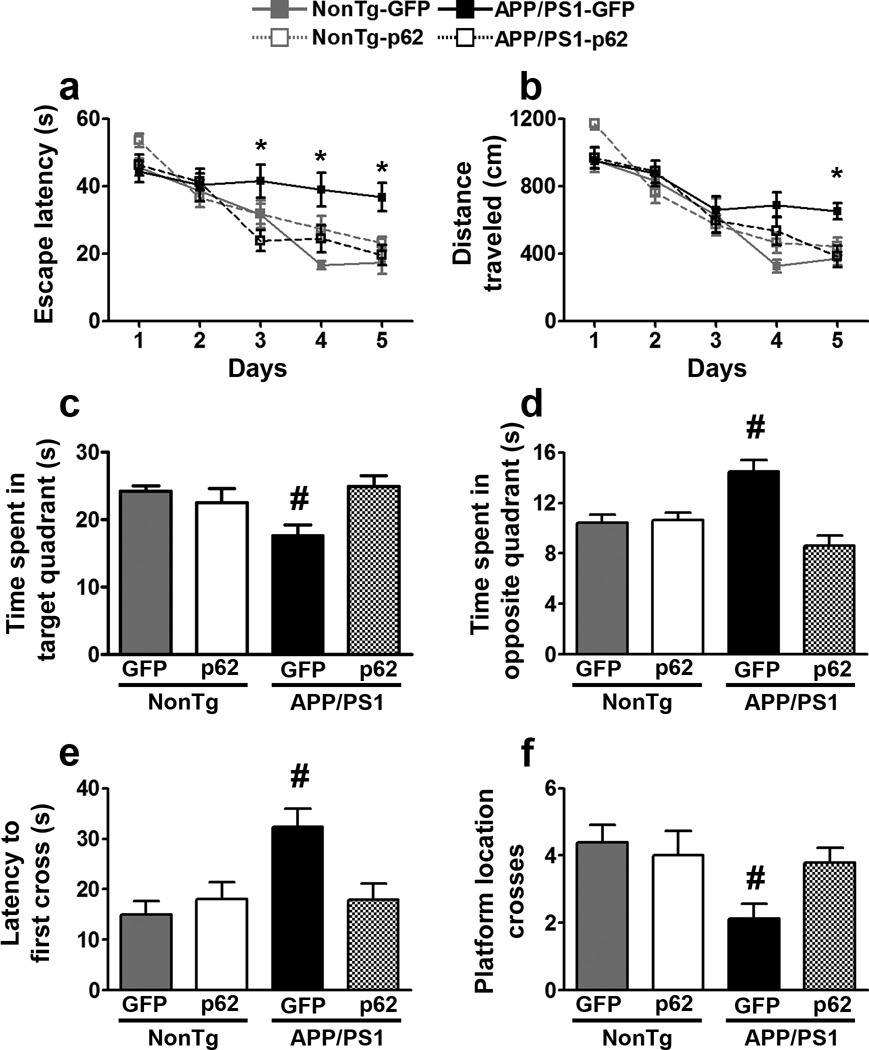
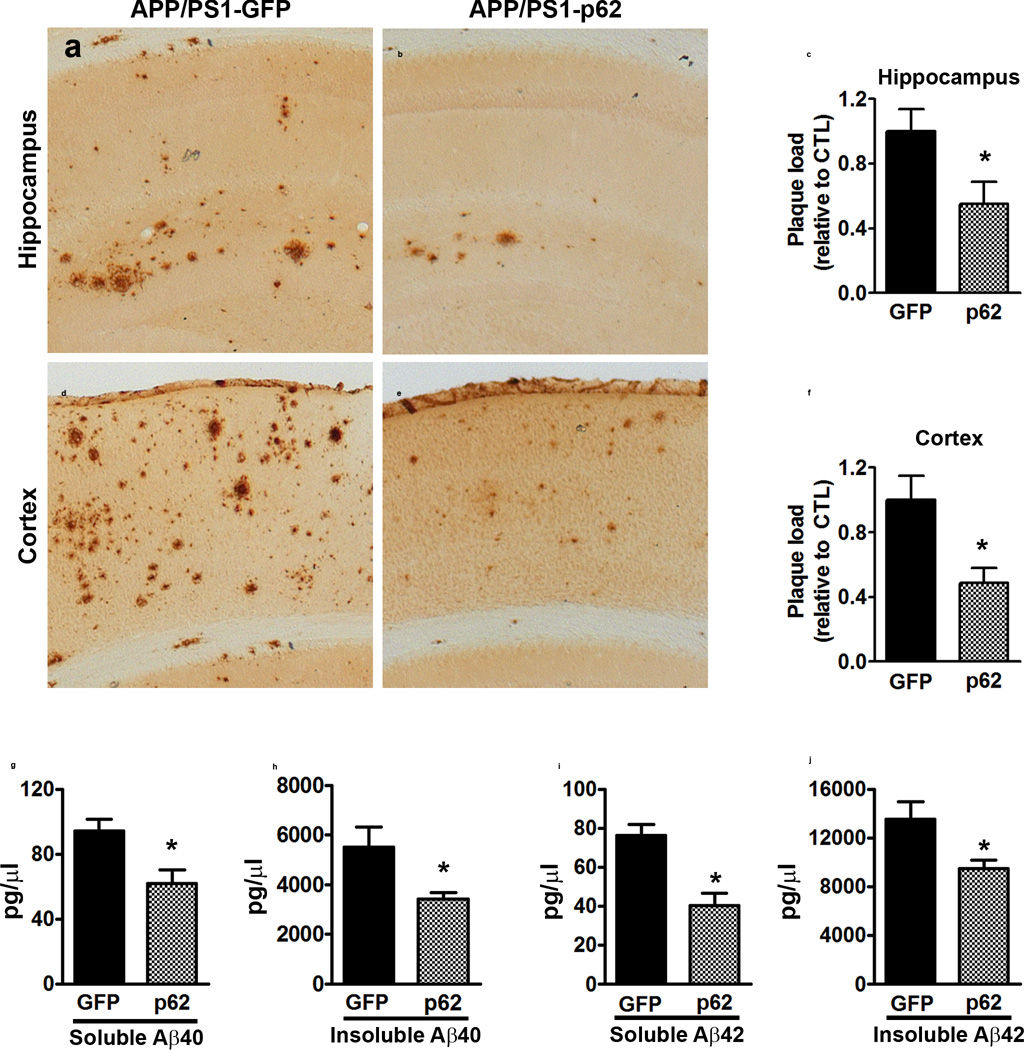
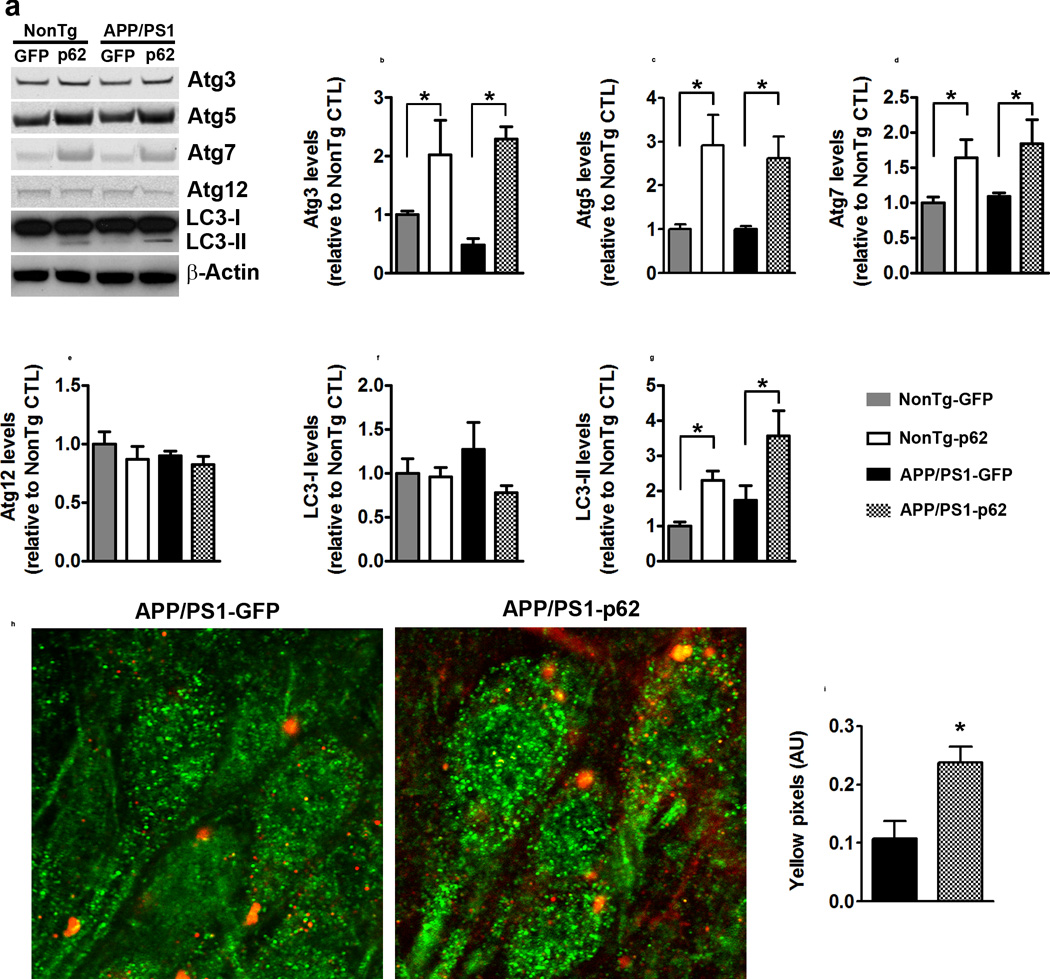
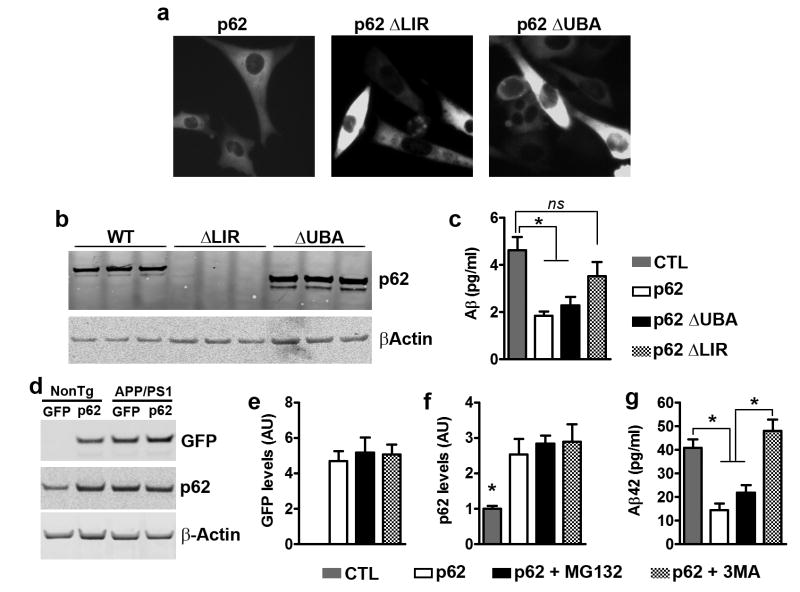
The multifunctional protein p62 is associated with neuropathological inclusions in several neurodegenerative disorders, including frontotemporal lobar degeneration, amyotrophic lateral sclerosis and Alzheimer's disease (AD). Strong evidence shows that in AD, p62 immunoreactivity is associated with neurofibrillary tangles and is involved in tau degradation. However, it remains to be determined whether p62 also plays a role in regulating amyloid-β (Aβ) aggregation and degradation. Using a gene therapy approach, here we show that increasing brain p62 expression rescues cognitive deficits in APP/PS1 mice, a widely used animal model of AD. The cognitive improvement was associated with a decrease in Aβ levels and plaque load. Using complementary genetic and pharmacologic approaches, we found that the p62-mediated changes in Aβ were due to an increase in autophagy. To this end, we showed that removing the LC3-interacting region of p62, which facilitates p62-mediated selective autophagy, or blocking autophagy with a pharmacological inhibitor, was sufficient to prevent the decrease in Aβ. Overall, we believe these data provide the first direct in vivo evidence showing that p62 regulates Aβ turnover.


Conflict of interest statement

Conflict of interest

The authors declare no conflict of interest

Figures

Figure 1
Figure 1
p62 gene transfer increases p62 levels in neurons. (a) Diagram depicting the structure of the two adeno associated viruses (AAVs) bilaterally injected into the lateral ventricles of new born APP/PS1 and NonTg mice. (b) Age-dependent change in body weight. (c–d) Western blot and quantitative analysis shows that p62 levels were significantly higher in the two groups infected with the AAV-p62 compared to the two groups infected with the AAV-GFP (n = 8/mice per group). Quantitative analyses were performed by normalizing p62 levels to β-actin, used as a loading control. (e–f) Microphotographs of hippocampal and cortical sections obtained from mice infected with the AAV-p62 virus. Sections were stained with an anti-GFP antibody and show the degree of diffusion of the virus. (g–h) Microphotographs of hippocampal sections co-labeled with GFP (green), and NeuN or GFAP (red). These data indicate that the AAVs almost exclusively infected neurons. Abbreviations: Hp, hippocampous; Cx, cortex. Error bars represent mean ± SEM.
Figure 2
Figure 2
p62 overexpression improves cognitive function. (a, b) Learning curves of mice trained in the spatial reference version of the Morris water maze (n = 20/mice per group). The escape latency and the distance traveled to find the hidden platform were plotted against the days of training. Each day represents the average of four consecutive training trials. Both measurements indicate that all four groups significantly improved across the five days. For the escape latency: p < 0.0001 for days and group. Distance traveled: p < 0.0001 and p = 0.023 for days and group. Specifically, the APP/PS1-GFP group was significantly impaired compared to the other three groups at days 3, 4, 5 for the escape latency and day 5 for the distance traveled. (c) The APP/PS1 group spent significantly less time in the target quadrant compared to the other three groups (p = 0.017). (d) The APP/PS1-GFP group spent significantly more time in the opposite quadrant compared to the other three groups (p < 0.0001). (e) The APP/PS1-GFP group needed significantly more time to cross over the platform location compared to the other three groups (p = 0.002). (f) The APP/PS1-GFP group crossed over the platform location significantly fewer times compared to the other three groups (p = 0.04). * indicates that the APP/PS1-p62 group performed significantly better than the APP/PS1-GFP group. # indicates that the APP/PS1-GFP group performed significantly different than the other three groups. Learning data (a–b) were analyzed by two-way ANOVA; probe trials (c–f) were analyzed by one-way ANOVA. Bonferroni’s was used for post hoc tests. Error bars represent mean ± SEM.
Figure 3
Figure 3
p62 overexpression reduces Aβ pathology (a, b) Microphotographs of hippocampal sections stained with an Aβ42-specific antibody. (c) Quantitative analysis of the Aβ42 immunoreactivity shows reduced Aβ load in the APP/PS1-p62 mice compared to APP/PS1-GFP mice (p = 0.01). (d, e) Microphotographs of cortical sections stained with an Aβ42-specific antibody. (f) Quantitative analysis of Aβ42 immunoreactivity shows reduced cortical Aβ load in the APP/PS1-p62 mice compared to APP/PS1-GFP mice (p < 0.04). (g–j) Soluble and insoluble Aβ40 and Aβ42 measured by sandwich ELISA. Aβ40 levels were significantly reduced in APP/PS1-p62 mice compared to APP/PS1-GFP mice (p = 0.01 and p = 0.001 for soluble and insoluble, respectively). Aβ42 levels were significantly reduced in APP/PS1-p62 mice compared to APP/PS1-GFP mice (p = 0.02 for both measurements). For all the experiments shown here, n = 8/mice per group. Data were analyzed by student’s t-test and are presented as mean ± SEM.
Figure 4
Figure 4
p62 overexpression increases autophagy induction. (a) Western blots of hippocampal proteins probed with the indicated antibodies. (b–d) Atg3, Atg5, and Atg7 levels were different among the four groups (p = 0.001, p = 0.004, p = 0.027, respectively). Post hoc analyses indicated that the two p62 groups were significantly different than the two groups GFP groups. (e–f) Atg12 and LC3-I levels were not statistically different among the four groups. (g) LC3-II levels were different among the four groups (p = 0.002). Post hoc analyses indicated that the two groups infected with p62 were significantly different than the two groups infected with GFP. (h–i) Representative confocal images and quantitative analyses. Sections were labeled with Lam2a (green) and 6E10 (red), to mark lysosomes and Aβ-containing fragments, respectively. The number of yellow pixels was significantly increased in APP/PS1-p62 mice, which indicates higher Aβ levels in lysosomes. For all the experiments shown here, n=8 mice per group. Quantitative analyses of the blots were performed by normalizing the levels of the protein of interest to β-actin, used as a loading control. Data were analyzed by one-way ANOVA and Bonferroni’s post-hoc test and are presented as mean ± SEM.
Figure 5
Figure 5
p62 overexpression decreases Aβ by an autophagy-mediated mechanism. (a) Microphotographs of 7PA2 cells transfected with different p62 constructs, as indicated. (b) Western blot from proteins isolated from transfected 7PA2 cells and probed with a p62 antibody, which recognize p62 within the LIR domain. Therefore ΔLIR is not detectable, while there is a clear shift in molecular weight for ΔUBA. (c) Aβ levels obtained from 7PA2 cells and measured by sandwich ELISA were different among the four groups (p = 0.001). Post hoc analyses revealed that transfection of wild type p62 or p62-ΔUBA decreased Aβ42 levels. In contrast, p62-ΔLIR was unable to significantly reduce Aβ levels. (d) Western blot of proteins extracted from APP/PS1 primary neurons infected with the p62 AAVs and treated with compounds to block autophagy (3MA) or proteasome function (MG132), as indicated. (e) GFP levels were similar among the three groups of neurons infected with the p62 AAVs. (f) p62 blot showed that p62 levels were significantly higher in the three groups infected with the p62 AAVs, compared to uninfected neurons. (g) Aβ42 levels obtained from these APP/PS1 neurons and measured by sandwich ELISA, were significantly different among the four groups (p < 0.0001). Post hoc analyses revealed that the p62 and the p62 + MG132 groups had significantly lower Aβ42 levels compared to the other two groups. For all the experiments shown here, n=9 mice per group. Quantitative analyses of the blots were performed by normalizing the levels of the protein of interest to β-actin, used as a loading control. Data were analyzed by one-way ANOVA and Bonferroni’s post hoc test and are presented as mean ± SEM.

References

    1. Nixon RA. The role of autophagy in neurodegenerative disease. Nat Med. 2013;19(8):983–997. - PubMed
    1. Orr ME, Oddo S. Autophagic/lysosomal dysfunction in Alzheimer's disease. Alzheimers Res Ther. 2013;5(5):53. - PMC - PubMed
    1. Yang DS, Stavrides P, Saito M, Kumar A, Rodriguez-Navarro JA, Pawlik M, et al. Defective macroautophagic turnover of brain lipids in the TgCRND8 Alzheimer mouse model: prevention by correcting lysosomal proteolytic deficits. Brain. 2014;137(Pt 12):3300–3318. - PMC - PubMed
    1. Yang DS, Stavrides P, Mohan PS, Kaushik S, Kumar A, Ohno M, et al. Reversal of autophagy dysfunction in the TgCRND8 mouse model of Alzheimer's disease ameliorates amyloid pathologies and memory deficits. Brain. 2011;134(Pt 1):258–277. - PMC - PubMed
    1. Caccamo A, Majumder S, Richardson A, Strong R, Oddo S. Molecular interplay between mammalian target of rapamycin (mTOR), amyloid-beta, and Tau: effects on cognitive impairments. J Biol Chem. 2010;285(17):13107–13120. - PMC - PubMed

Publication types

Substances