. 2016 Aug 30:7:12601.
doi: 10.1038/ncomms12601.

Cross-species identification of genomic drivers of squamous cell carcinoma development across preneoplastic intermediates

Affiliations

Cross-species identification of genomic drivers of squamous cell carcinoma development across preneoplastic intermediates

Vida Chitsazzadeh et al. Nat Commun. .

Abstract

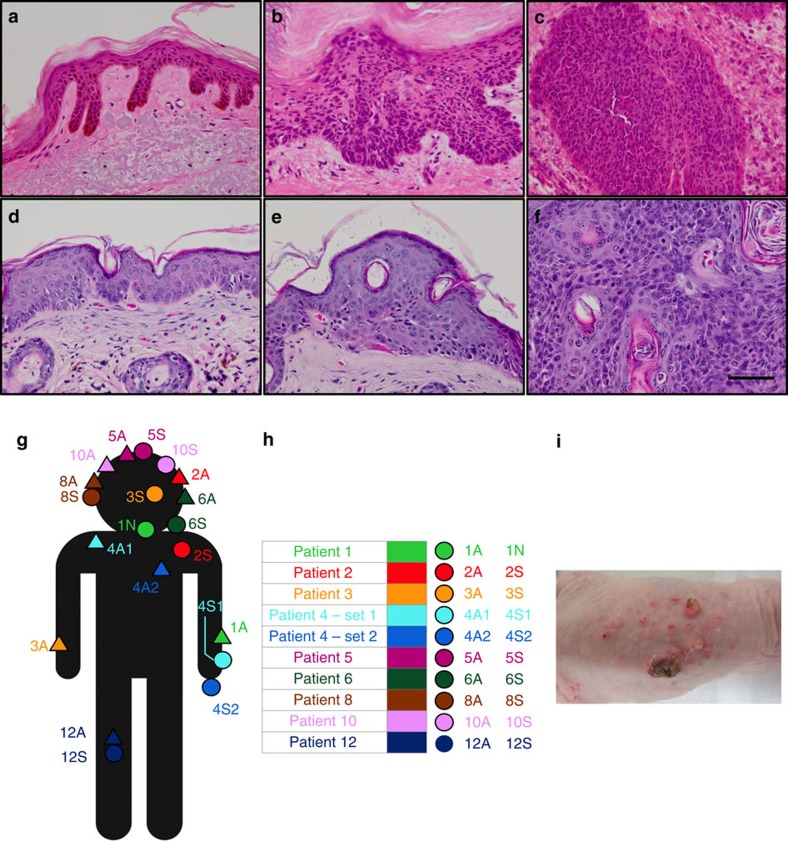
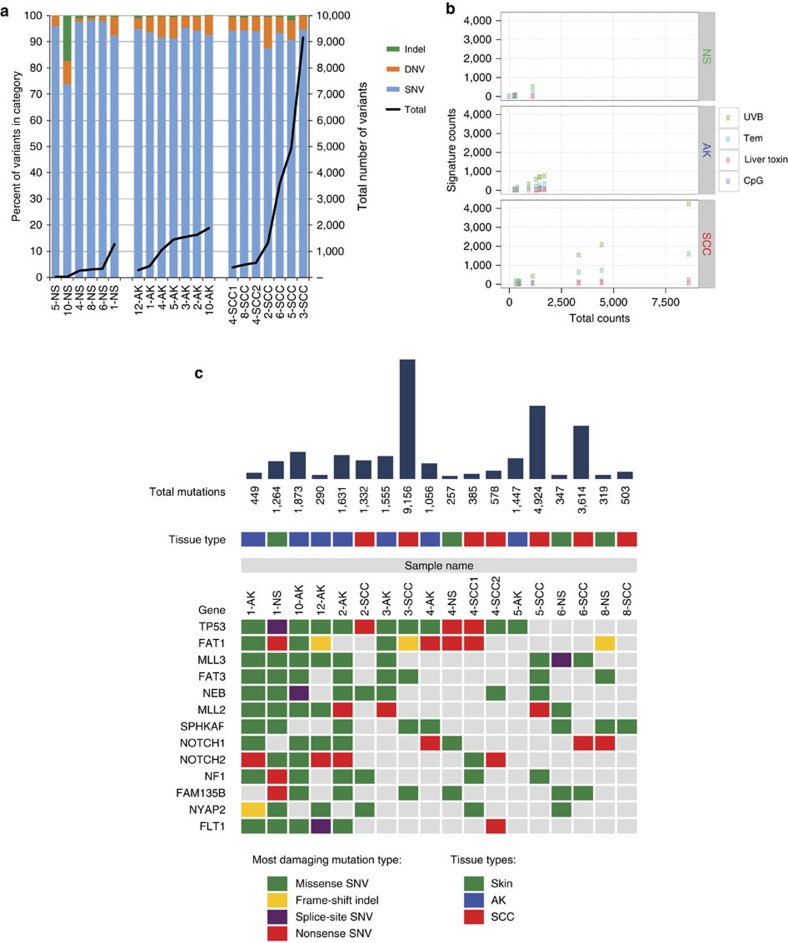
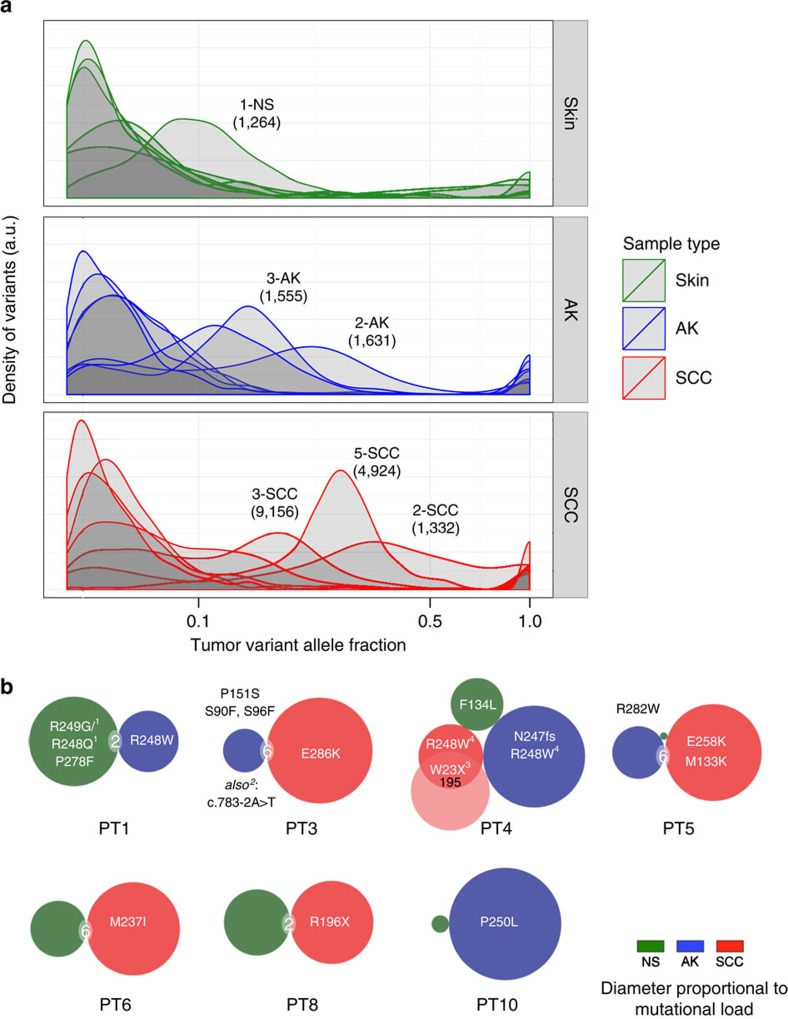
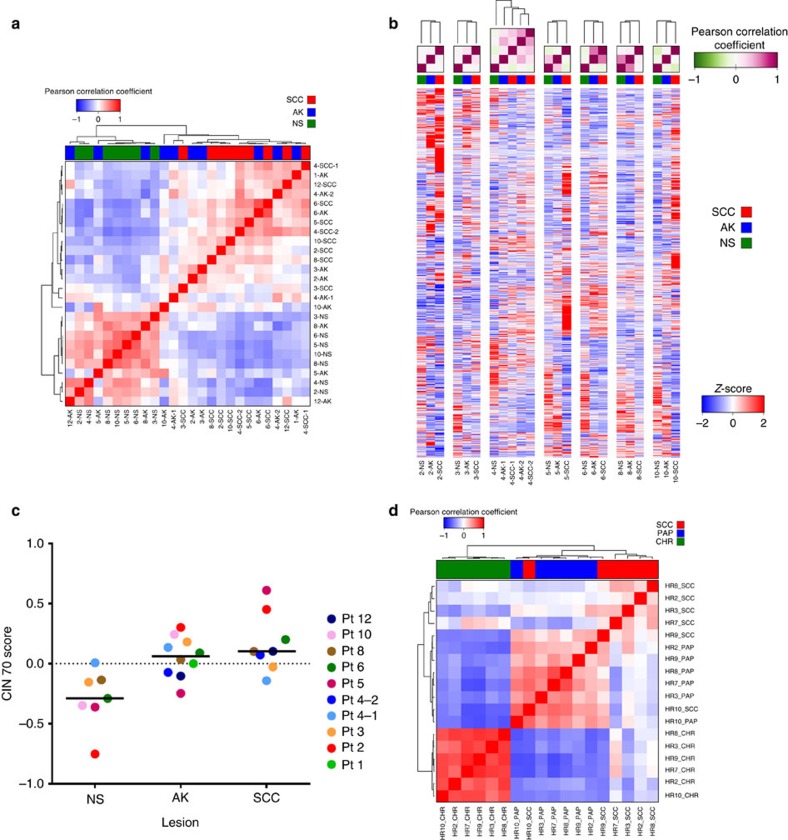
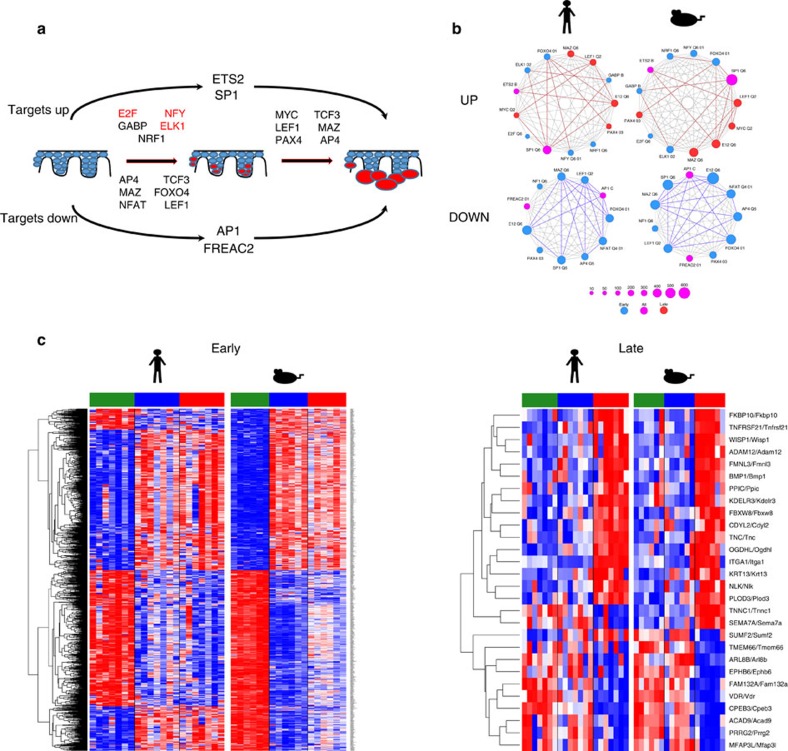
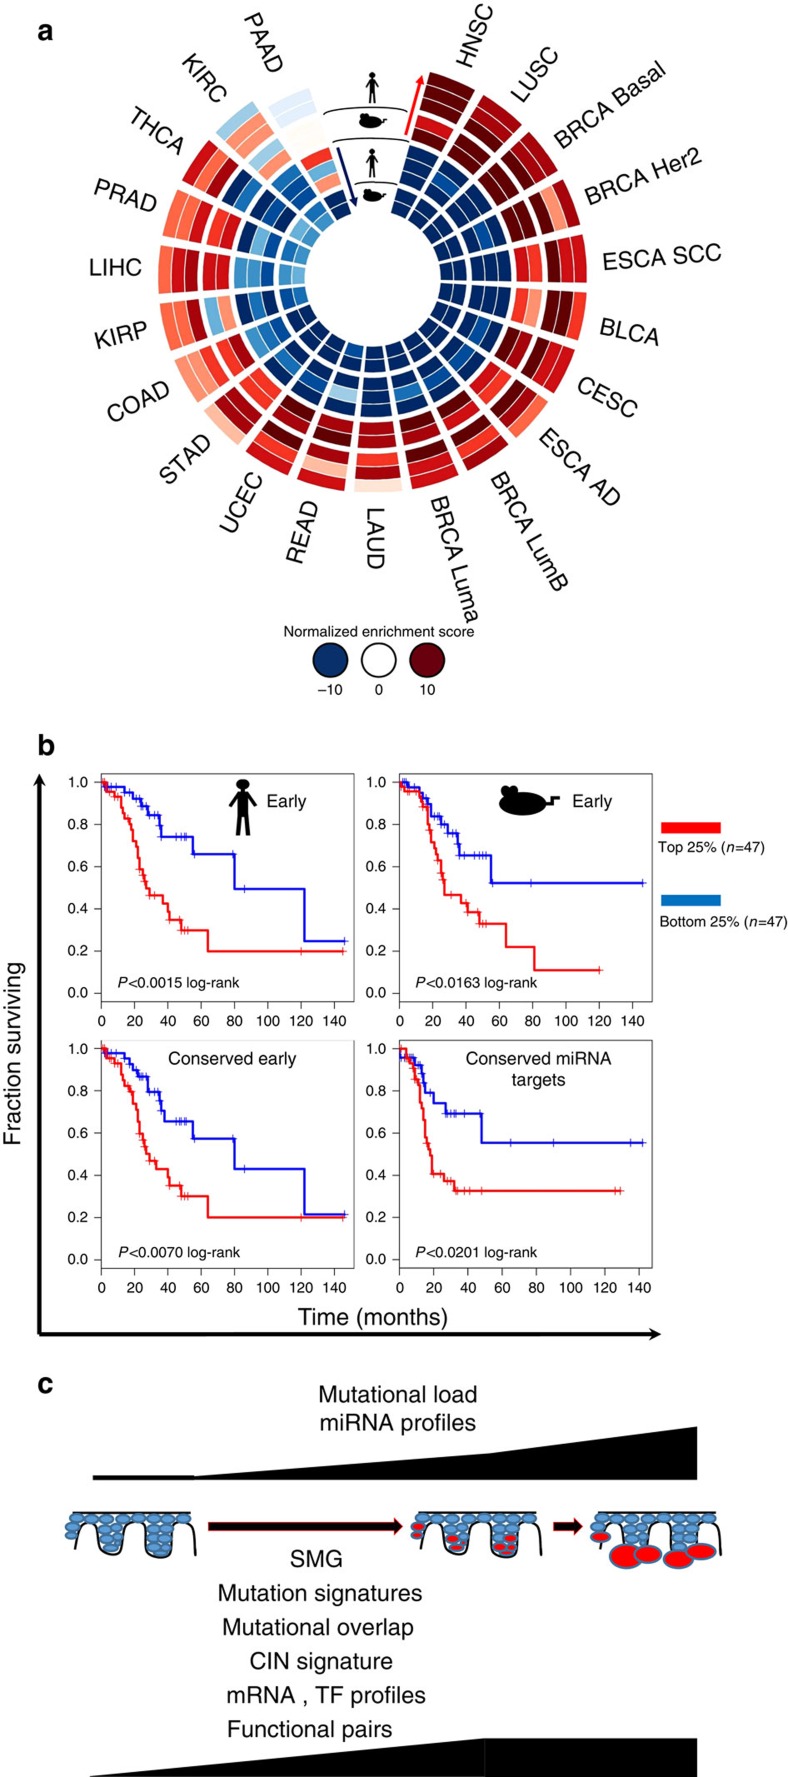
Cutaneous squamous cell carcinoma (cuSCC) comprises 15-20% of all skin cancers, accounting for over 700,000 cases in USA annually. Most cuSCC arise in association with a distinct precancerous lesion, the actinic keratosis (AK). To identify potential targets for molecularly targeted chemoprevention, here we perform integrated cross-species genomic analysis of cuSCC development through the preneoplastic AK stage using matched human samples and a solar ultraviolet radiation-driven Hairless mouse model. We identify the major transcriptional drivers of this progression sequence, showing that the key genomic changes in cuSCC development occur in the normal skin to AK transition. Our data validate the use of this ultraviolet radiation-driven mouse cuSCC model for cross-species analysis and demonstrate that cuSCC bears deep molecular similarities to multiple carcinogen-driven SCCs from diverse sites, suggesting that cuSCC may serve as an effective, accessible model for multiple SCC types and that common treatment and prevention strategies may be feasible.


Figures

Figure 1
Figure 1. Anatomic distribution and histology of representative tissues isolated from human patients and Hairless mice.
(ac) Normal (peri-tumoural) skin, actinic keratosis and invasive cuSCC, respectively, are shown from human patients. Scale bar, 50 μm. Human samples were processed following combined RNAlater and formalin fixation, resulting in significant cytoplasmic shrinkage. (df) Normal (peri-tumoural) skin, papillomas and invasive cuSCC, respectively, are shown from Hairless mice. (g) Anatomic locations of matched samples from human patients. (h) Tabular list of matched samples from human patients: (S) denotes the cuSCC with adjacent NS, (N) denotes normal skin and (A) denotes the AK. For patient 1, only NS and AK were available for analysis. (i) Representative skin samples from Hairless mice are shown, which include smaller papillomas and a smaller number of invasive carcinomas.
Figure 2
Figure 2. The spectrum of mutations in human samples is dominated by C toT transitions and show increasing mutation burden across cuSCC development.
(a) cuSCC display very high mutational loads of 45.7 variants per Mb, with NS and AK samples harbouring an average of 5.8 and 18.5 variants per Mb, respectively. There are strongly dominated by single nucleotide variants. (b) NMF-derived orthogonal mutational profiles derived from over 6,000 human cancers confirm a strong enrichment for CpG-associated C→T transitions classically associated with UVB exposure, particularly for AK and cuSCC. For each lesion, the proportion of mutations attributable to a specific signature is plotted as a function of total mutation counts. This correlates strongly with the increasing mutational burden observed in AK and cuSCC, suggesting that the increase is attributable solely to UVB exposure. Three other profiles dominated by C→T transitions are significantly represented in the mutational data and relatively enriched in NS, including ones first described in the context of temozolamide exposure (Tem), one attributed to liver toxins, and one associated with CpG sites. These latter two signatures likely reflect background mutational processes in this context. (c) SMG from this cohort, match those identified previously studied cohorts of cuSCC.
Figure 3
Figure 3. Significant mutational heterogeneity and overlap exists between AK and cuSCC.
(a) Histograms of variant allele frequencies in NS, AK and cuSCC, show that NS have a large number of low-frequency variants. AK and cuSCC have a more heterogeneous distribution of variant frequencies, with higher-frequency variants, indicative of a general towards the emergence of dominant clones. Outliers with high frequencies of mutations in the NS and AK groups (labelled by patient #) are annotated with mutation frequencies in parentheses to show how these frequencies correlate with increasing monoclonality. (b) Point mutations in TP53 compared with overall mutation counts and site-specific ovelaps. Specific mutations are indicated in text, size of the circle indicates the total number of mutations of that sample, with overlaps >1 shown between lesions. R248 is the only amino acid changed in multiple samples within patients 1, 4. Notes regarding specific findings: 1: complex variant at R248/9 hotspot; 2: splice-site variant, 3: appears in both SCC-1 and SCC-2, 4: base change differs between AK and SCC-1 (c.GG741AA in AK, and c.C742T in SCC-1).
Figure 4
Figure 4. mRNA profiling across AK/papilloma and cuSCC development.
(a) Correlation matrix of mRNAs differentially expressed in at least one signature in human samples shows that AKs span the spectrum of NS to cuSCC samples. (b) Unsupervised clustering of all genes across patient samples with complete sets (all three lesion types) demonstrates that in 6/8 sets, AK more closely resemble cuSCC. The Pearson correlation matrix is shown on top with the underlying heat map shown below. (c) A 70-gene signature of chromosomal instability derived from human cancers is highly enriched in AK and cuSCC to a similar degree, but not NS. (d) Correlation matrix of mRNAs differentially expressed in at least one signature in mouse samples demonstrates that PAPs much more closely resemble cuSCC than CHR.
Figure 5
Figure 5. Cross-species transcription factor motif analysis reveals major drivers of cuSCC development.
(a) Global view of transcription factors with target genes enriched across the entire NS/CHR to AK/PAP to cuSCC progression sequence. Directionality reflects the significant upregulation (above the line) or downregulation (below the line) of predicted targets of the listed transcription factors. Some factors have targets that are enriched in opposite directions across distinct transitions. The transcription factors highlighted in red were identified in both TRANSFAC and LME-based analyses. (b) Network analysis demonstrates that core transcriptional drivers are highly interconnected in both human (left) and mouse (right). The bolded lines delineate connections that are significant by Fisher exact test (P<10−4). (c) The LME model of mRNA expression changes across cuSCC development in both species demonstrates that the vast majority of significant gene expression changes occur in the early transition from NS/CHR to AK/PAP.
Figure 6
Figure 6. microRNA profiling across AK/papilloma and cuSCC development.
(a) Correlation matrix of microRNAs differentially expressed in at least one signature in human samples shows that significantly improved discrimination between three sample types is achieved as compared with mRNA profiles. (b) Using only microRNAs differentially expressed in at least two out of three pairwise comparisons (P<0.05), robust discrimination is achieved between NS and cuSCC with most AKs occupying an intermediate expression pattern. (c) Hierarchical clustering of microRNAs differentially expressed in at least one signature in mouse samples shows distinct patterns among the three sample types as compared with mRNA profiles. (d) Using only microRNAs differentially expressed in at least two of three pairwise comparisons (P<0.05), CHR and cuSCC are very strongly segregated with an intermediate group dominated by PAP.
Figure 7
Figure 7. Functional pair analysis identifies highly interconnected microRNA/mRNA regulatory networks conserved across species.
This occurs for both (a) upregulated microRNAs/downregulated target mRNAs and for (b) downregulated microRNAs/upregulated target mRNAs. The figures only show those microRNAs with q<10−8, log2-fold change of >1.15, conserved between species. Validation of select microRNA/mRNA pairs using a distinct set of human matched samples demonstrate robustness of the findings. (c) miR-21 is upregulated between NS and cuSCC, whereas predicted targets ARHGAP24 and TIMP3 are downregulated. (d) miR-31 is upregulated between NS and cuSCC, whereas predicted targets PTPN14 and FAM134B are downregulated.
Figure 8
Figure 8. cuSCC is molecularly related to carcinogen-driven SCCs of multiple sites.
(a) GSEA analysis of all significant pairwise comparisons in both mouse (CHR versus PAP, CHR versus cuSCC) and human (NS versus AK, AK versus cuSCC, NS versus cuSCC) represented as a CIRCOS plot. For all cancers profiled in the TCGA, normalized enrichment scores for each signature were determined and cancer types ranked by descending order (clockwise) of the sum of squares of all the scores with a penalty. By this measure, cuSCC is most closely related to HNSC, LUSC, basal and HER2+ subtypes of breast cancer (BRCA) and ESCA SCC. (b) Given that HNSC is most closely related to cuSCC by this measure, we show that cuSCC signatures can predict outcome (overall survival) in HNSC with TP53 mutation, used here as a proxy for identifying tumours that do not express high-risk HPV. The cross-species early signatures derived from the linear mixed effects model and the cross-species microRNA functional analysis all predict survival in HNSCC for the top and bottom 25% of outcomes with statistical significance. Multiple hypothesis testing was performed and all of the plots shown are significant with the stated P-values and false discovery rate-adjusted q-values of <0.1 (q=0.021 human early, 0.070 mouse early, 0.049 conserved early and 0.070 conserved miRNA targets). (c) Taken together, our data show that AKs have acquired many of the properties of cuSCC as assessed by SMG, mutational overlap, mutational signatures, chromosomal instability signature, mRNA and transcription factor profiles and functional pair analysis, although overall mutational load and unsupervised microRNA clustering do enable separation of the three sample types.

References

    1. Rosen T. & Lebwohl M. G. Prevalence and awareness of actinic keratosis: barriers and opportunities. J. Am. Acad. Dermatol. 68, S2–S9 (2013). - PubMed
    1. Warino L. et al.. Frequency and cost of actinic keratosis treatment. Dermatol. Surg. 32, 1045–1049 (2006). - PubMed
    1. Criscione V. D. et al.. Actinic keratoses: natural history and risk of malignant transformation in the Veterans Affairs Topical Tretinoin Chemoprevention Trial. Cancer 115, 2523–2530 (2009). - PubMed
    1. Karia P. S., Han J. & Schmults C. D. Cutaneous squamous cell carcinoma: estimated incidence of disease, nodal metastasis, and deaths from disease in the United States, 2012. J. Am. Acad. Dermatol. 68, 957–966 (2013). - PubMed
    1. Neidecker M. V., Davis-Ajami M. L., Balkrishnan R. & Feldman S. R. Pharmacoeconomic considerations in treating actinic keratosis. Pharmacoeconomics 27, 451–464 (2009). - PubMed

Publication types

MeSH terms

Substances