

Whole-Genome Sequencing and iPLEX MassARRAY Genotyping Map an EMS-Induced Mutation Affecting Cell Competition in Drosophila melanogaster
- PMID: 27574103
- PMCID: PMC5068942
- DOI: 10.1534/g3.116.029421
Whole-Genome Sequencing and iPLEX MassARRAY Genotyping Map an EMS-Induced Mutation Affecting Cell Competition in Drosophila melanogaster
Abstract
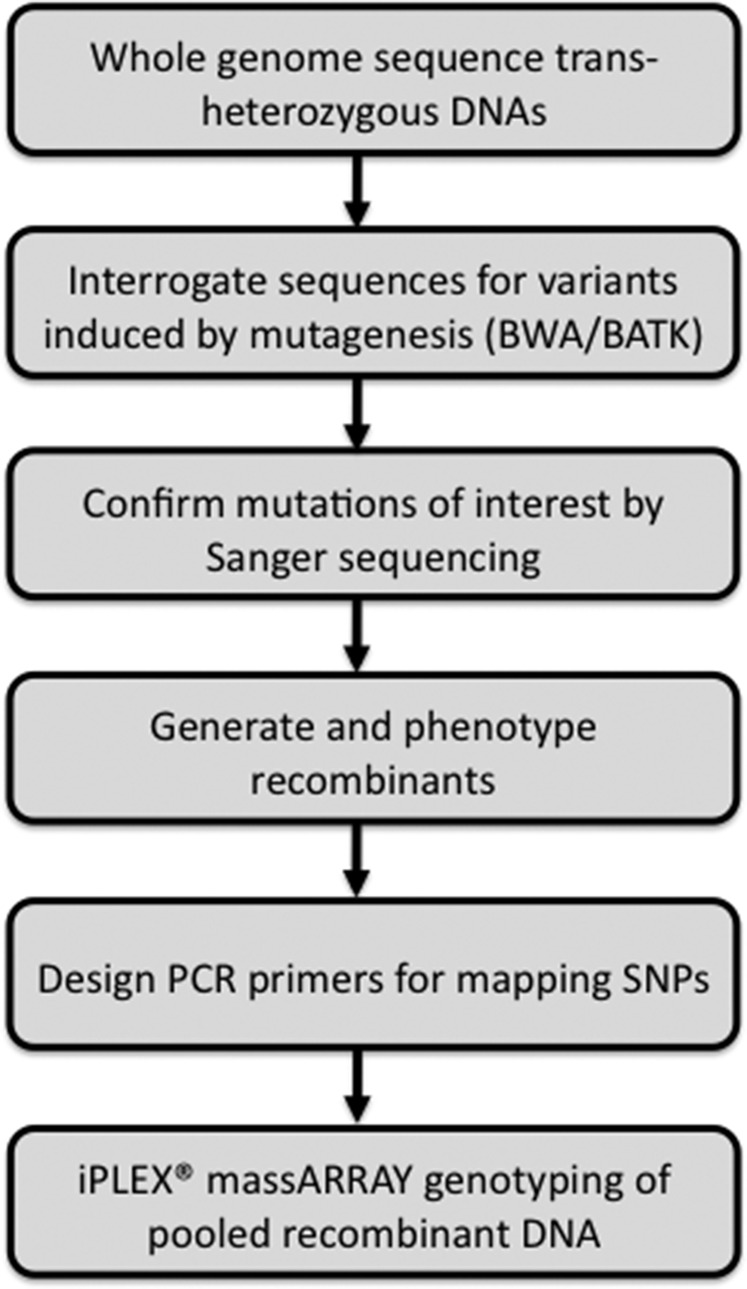
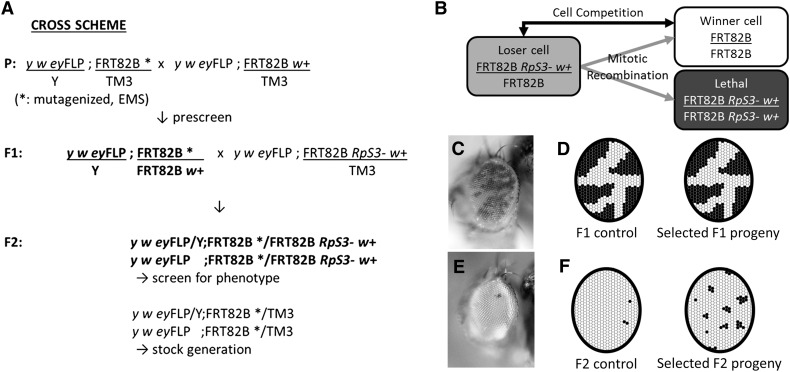
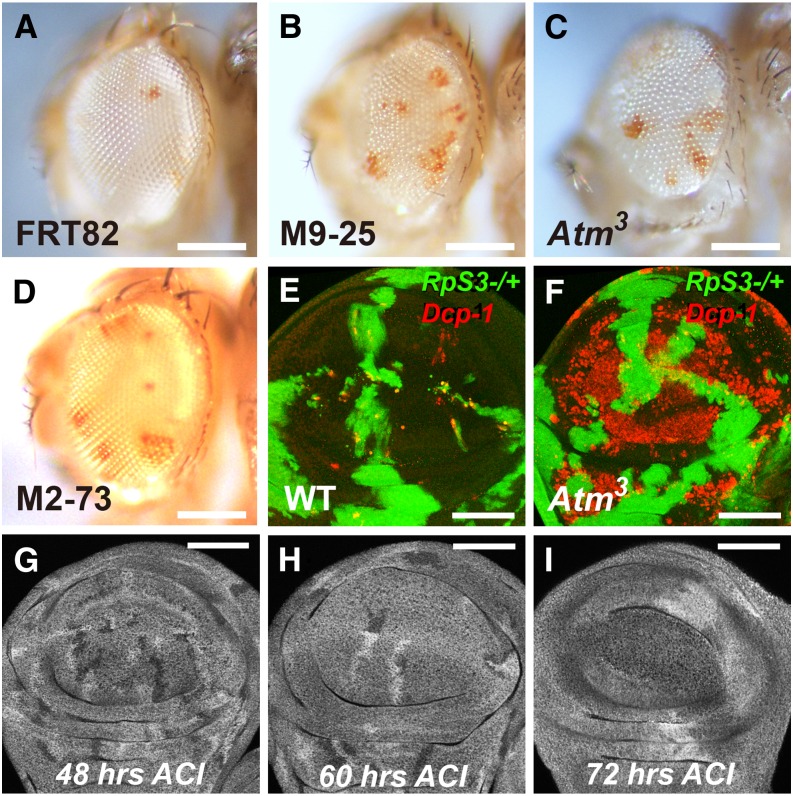
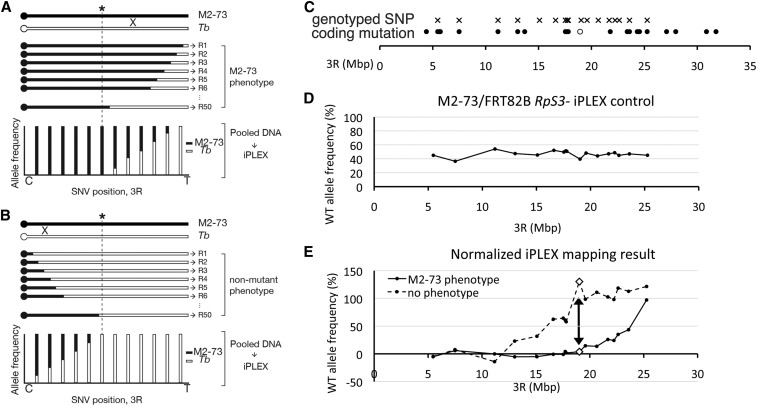
Cell competition, the conditional loss of viable genotypes only when surrounded by other cells, is a phenomenon observed in certain genetic mosaic conditions. We conducted a chemical mutagenesis and screen to recover new mutations that affect cell competition between wild-type and RpS3 heterozygous cells. Mutations were identified by whole-genome sequencing, making use of software tools that greatly facilitate the distinction between newly induced mutations and other sources of apparent sequence polymorphism, thereby reducing false-positive and false-negative identification rates. In addition, we utilized iPLEX MassARRAY for genotyping recombinant chromosomes. These approaches permitted the mapping of a new mutation affecting cell competition when only a single allele existed, with a phenotype assessed only in genetic mosaics, without the benefit of complementation with existing mutations, deletions, or duplications. These techniques expand the utility of chemical mutagenesis and whole-genome sequencing for mutant identification. We discuss mutations in the Atm and Xrp1 genes identified in this screen.
Keywords: Drosophila melanogaster; Flybook; Xrp1; cell competition; iPLEX MassARRAY; whole-genome sequencing.
Copyright © 2016 Lee et al.
Figures
Similar articles
-
Identification of EMS-induced mutations in Drosophila melanogaster by whole-genome sequencing.Genetics. 2009 May;182(1):25-32. doi: 10.1534/genetics.109.101998. Epub 2009 Mar 23. Genetics. 2009. PMID: 19307605 Free PMC article.
-
Rapid recombination mapping for high-throughput genetic screens in Drosophila.G3 (Bethesda). 2013 Dec 9;3(12):2313-9. doi: 10.1534/g3.113.008615. G3 (Bethesda). 2013. PMID: 24170736 Free PMC article.
-
EMS screens : from mutagenesis to screening and mapping.Methods Mol Biol. 2008;420:119-38. doi: 10.1007/978-1-59745-583-1_7. Methods Mol Biol. 2008. PMID: 18641944
-
Genetic mosaic studies of pattern formation in Drosophila melanogaster, with special reference to the prepattern hypothesis.Results Probl Cell Differ. 1978;9:157-204. doi: 10.1007/978-3-540-35803-9_7. Results Probl Cell Differ. 1978. PMID: 107550 Review. No abstract available.
-
From sequence to phenotype: reverse genetics in Drosophila melanogaster.Nat Rev Genet. 2002 Mar;3(3):189-98. doi: 10.1038/nrg752. Nat Rev Genet. 2002. PMID: 11972156 Review.
Cited by
-
Drosophila RpS12 controls translation, growth, and cell competition through Xrp1.PLoS Genet. 2019 Dec 16;15(12):e1008513. doi: 10.1371/journal.pgen.1008513. eCollection 2019 Dec. PLoS Genet. 2019. PMID: 31841522 Free PMC article.
-
Drosophila Trus, the orthologue of mammalian PDCD2L, is required for proper cell proliferation, larval developmental timing, and oogenesis.bioRxiv [Preprint]. 2024 Oct 26:2024.10.24.620039. doi: 10.1101/2024.10.24.620039. bioRxiv. 2024. Update in: PLoS Genet. 2025 Jun 27;21(6):e1011469. doi: 10.1371/journal.pgen.1011469. PMID: 39484569 Free PMC article. Updated. Preprint.
-
Reducing the aneuploid cell burden - cell competition and the ribosome connection.Dis Model Mech. 2022 Nov 1;15(11):dmm049673. doi: 10.1242/dmm.049673. Epub 2022 Nov 29. Dis Model Mech. 2022. PMID: 36444717 Free PMC article. Review.
-
Cell competition and cancer from Drosophila to mammals.Oncogenesis. 2024 Jan 3;13(1):1. doi: 10.1038/s41389-023-00505-y. Oncogenesis. 2024. PMID: 38172609 Free PMC article. Review.
-
A Regulatory Response to Ribosomal Protein Mutations Controls Translation, Growth, and Cell Competition.Dev Cell. 2018 Aug 20;46(4):456-469.e4. doi: 10.1016/j.devcel.2018.07.003. Epub 2018 Aug 2. Dev Cell. 2018. PMID: 30078730 Free PMC article.
References
-
- Abraham R. T., 2001. Cell cycle checkpoint signaling through the ATM and ATR kinases. Genes Dev. 15: 2177–2196. - PubMed
-
- Adams M. D., Celniker S. E., Holt R. A., Evans C. A., Gocayne J. D., et al. , 2000. The genome sequence of Drosophila melanogaster. Science 287: 2185–2195. - PubMed
-
- Akdemir F., Christich A., Sogame N., Chapo J., Abrams J. M., 2007. p53 directs focused genomic responses in Drosophila. Oncogene 26: 5184–5193. - PubMed
Publication types
MeSH terms
Substances
Grants and funding
LinkOut - more resources
Full Text Sources
Other Literature Sources
Molecular Biology Databases
Research Materials
Miscellaneous