. 2016 Sep;148(3):213-26.
doi: 10.1085/jgp.201611623.

Dual regulation of the native ClC-K2 chloride channel in the distal nephron by voltage and pH

Affiliations

Dual regulation of the native ClC-K2 chloride channel in the distal nephron by voltage and pH

Laurent Pinelli et al. J Gen Physiol. 2016 Sep.

Abstract

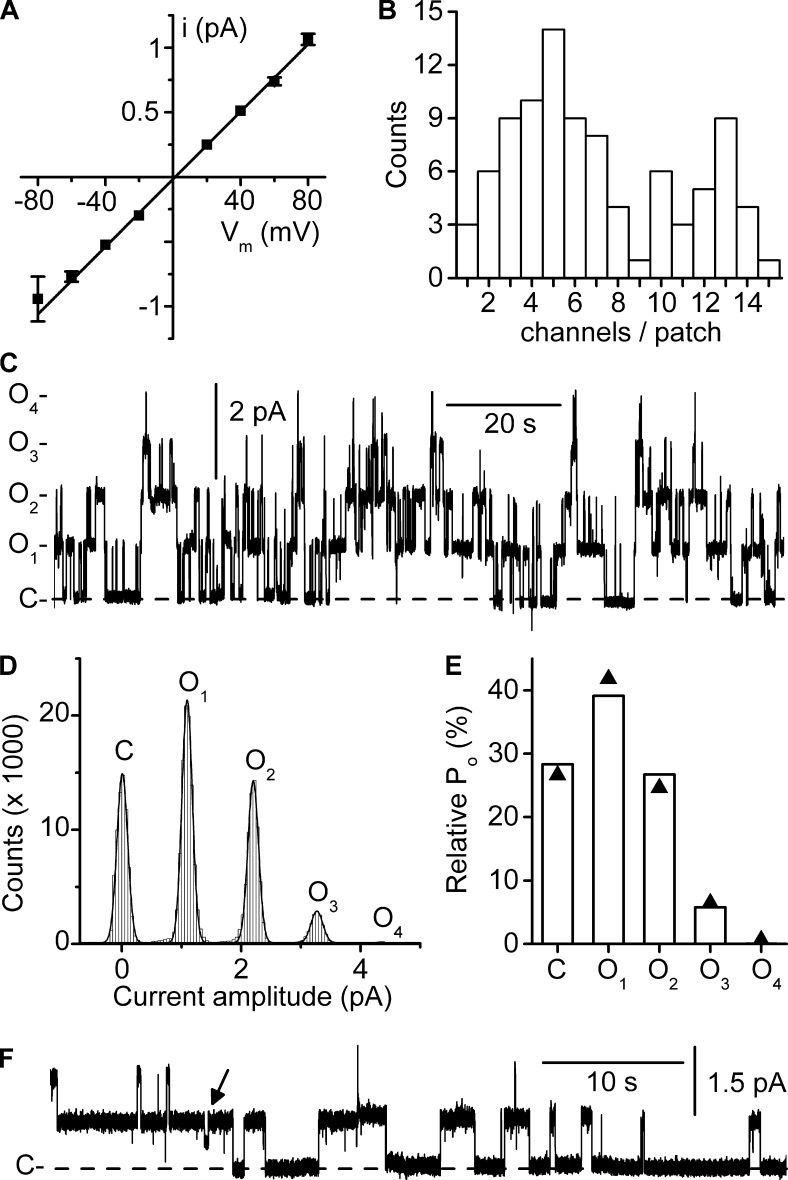
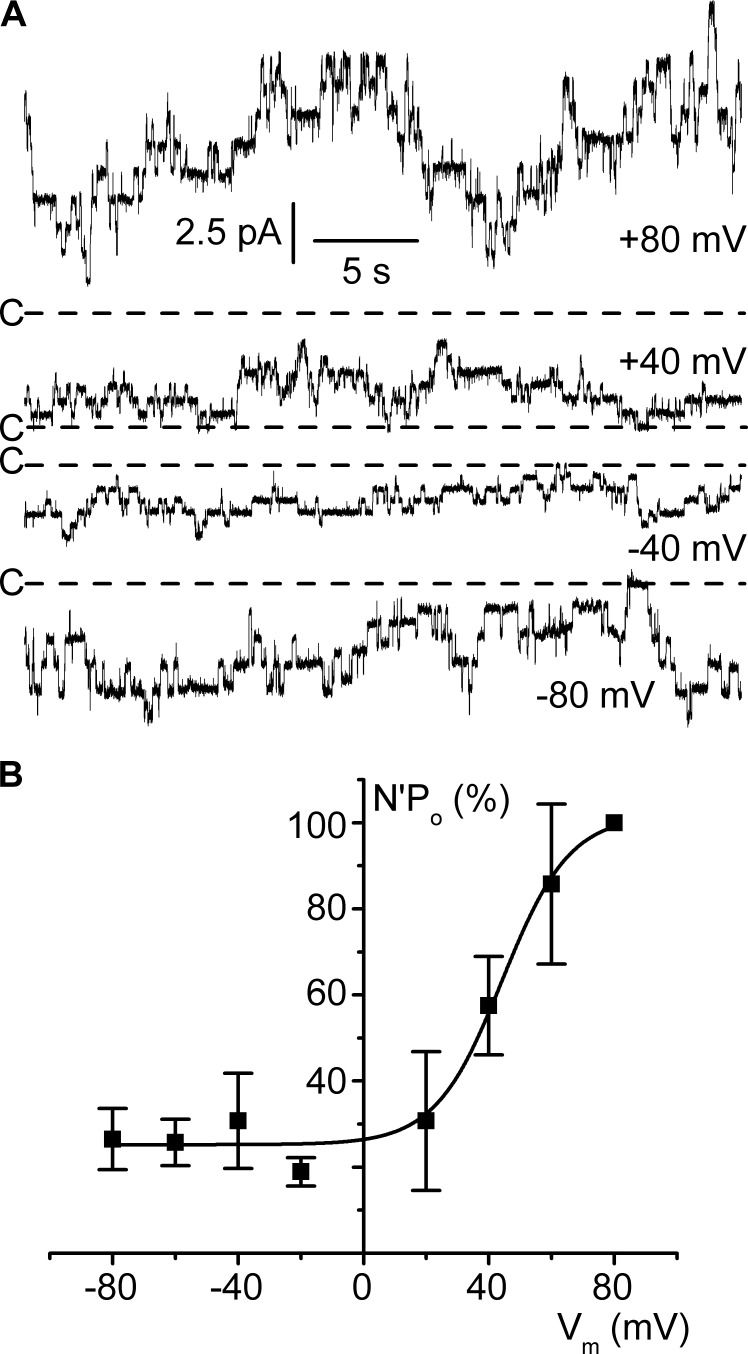
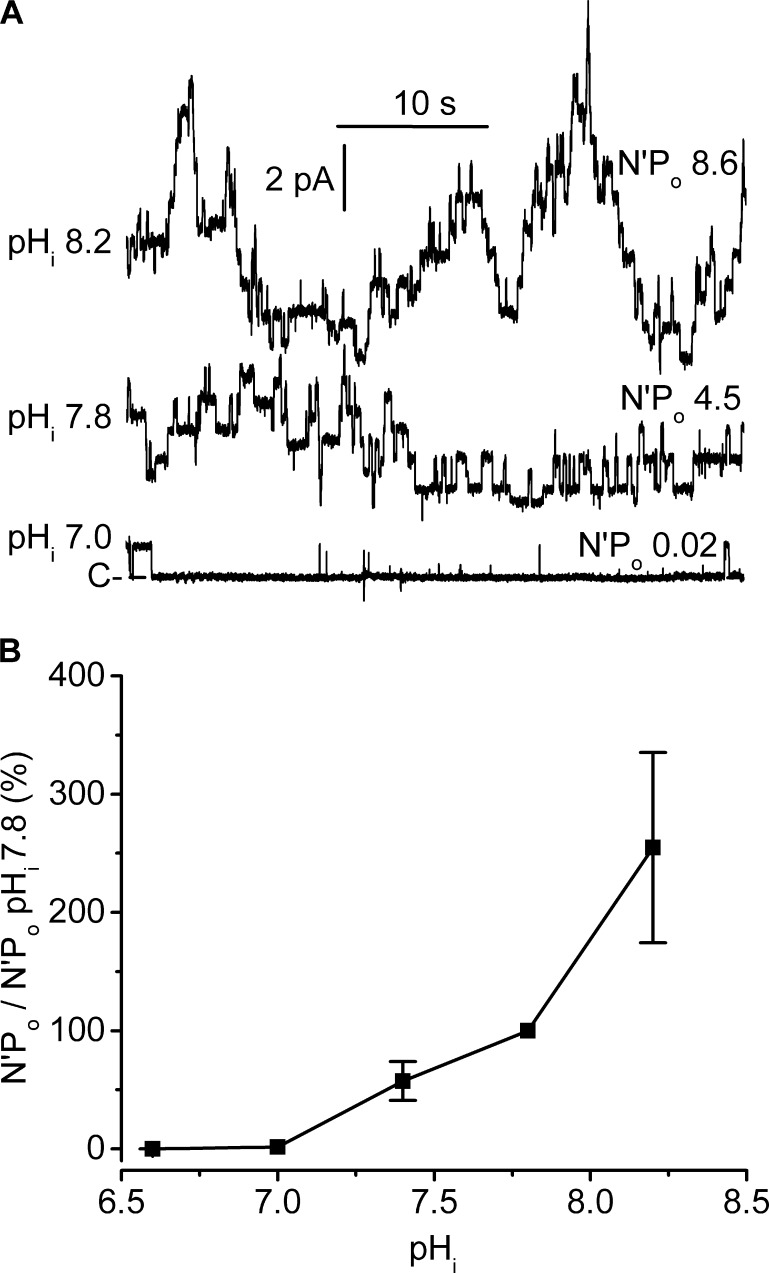
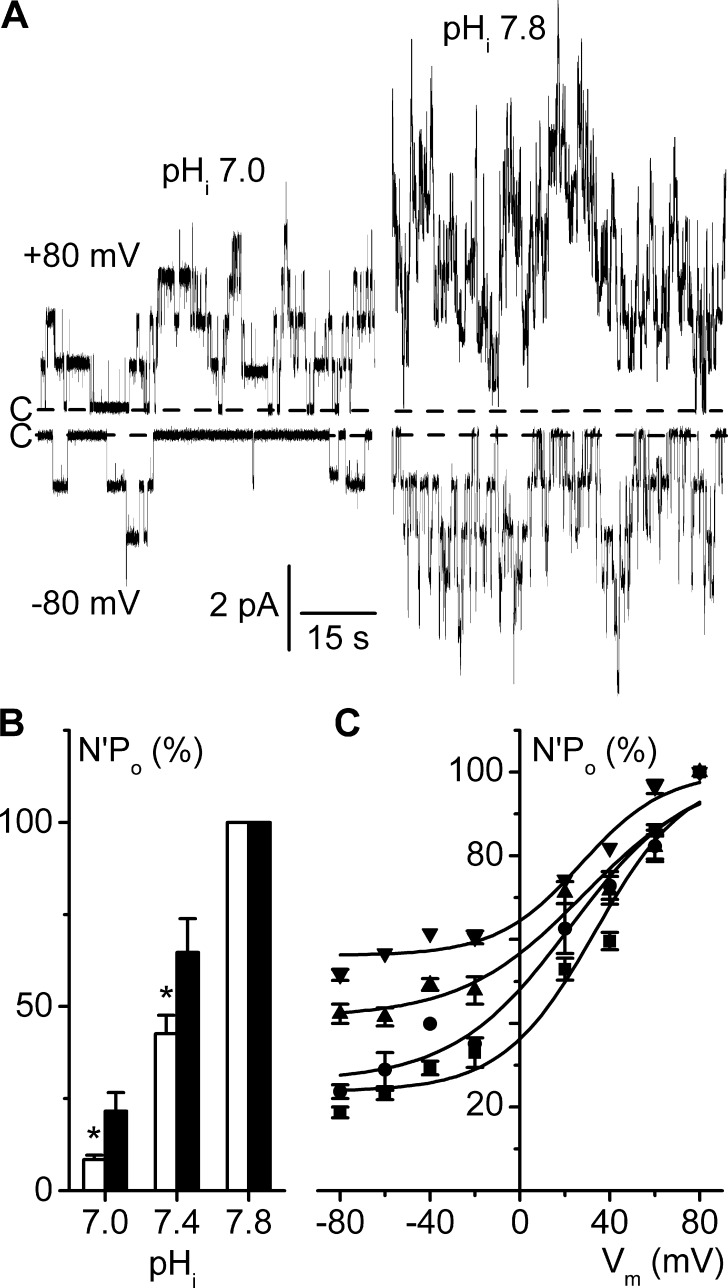
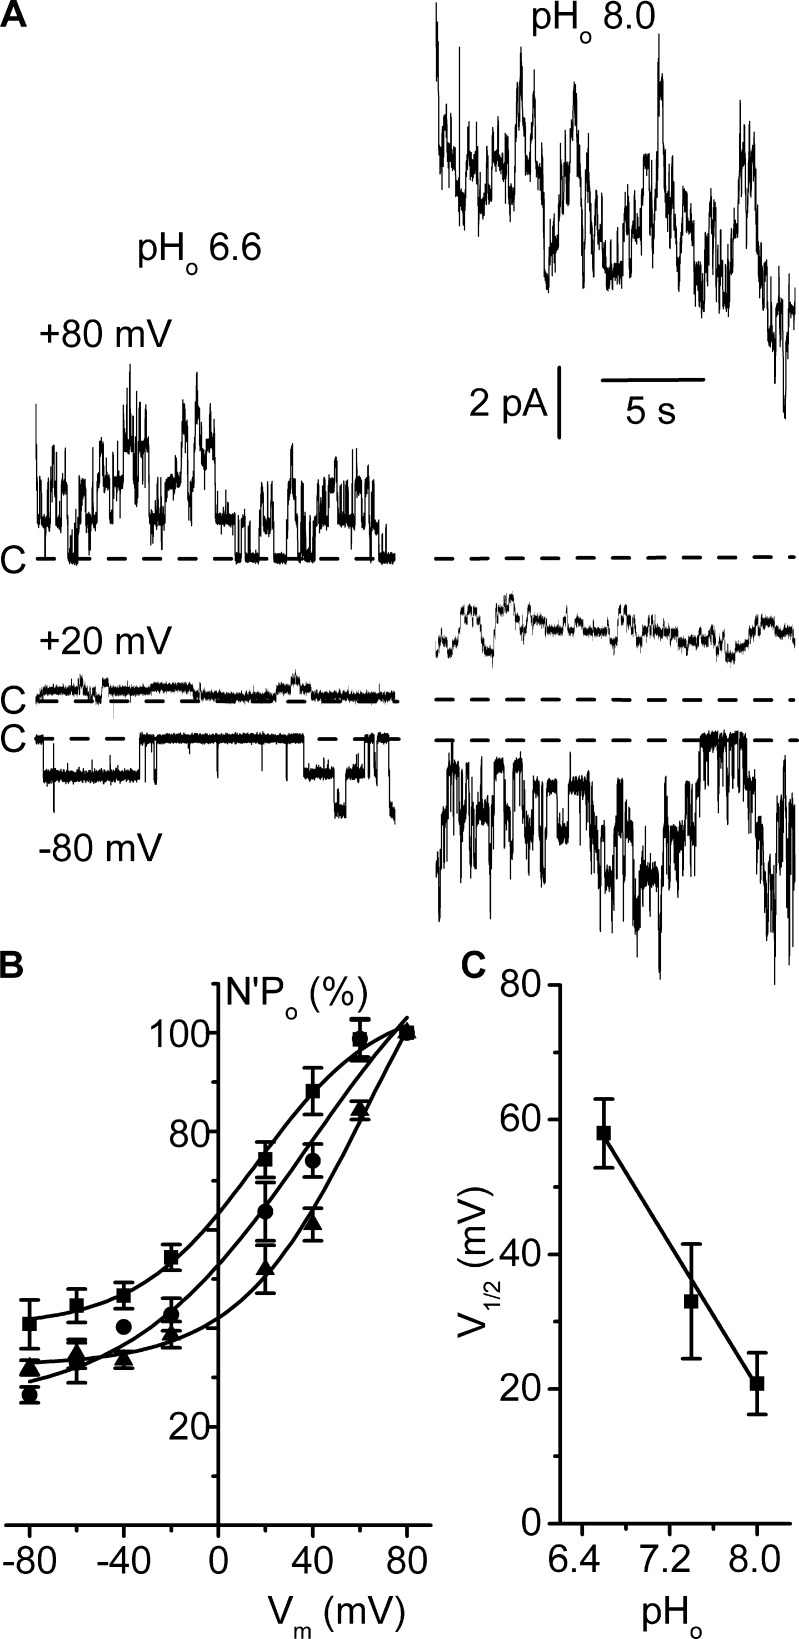
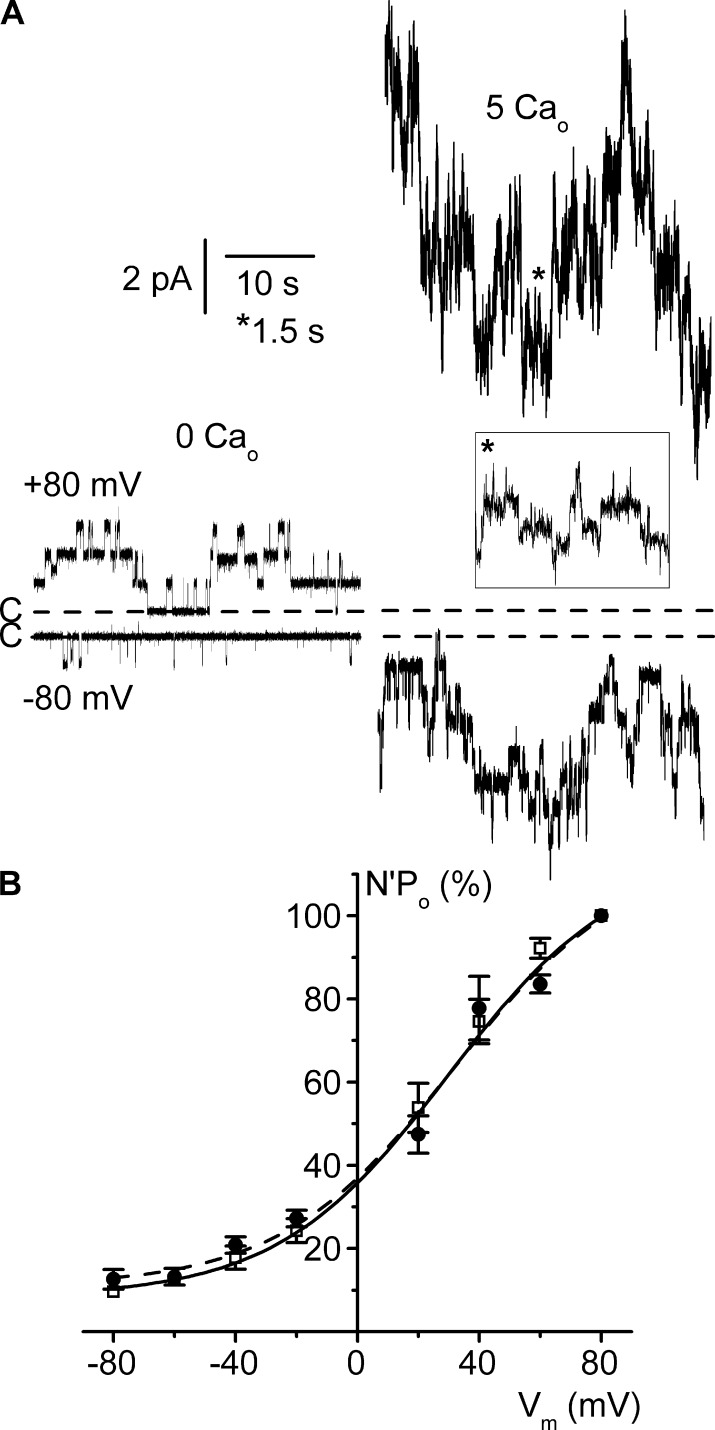
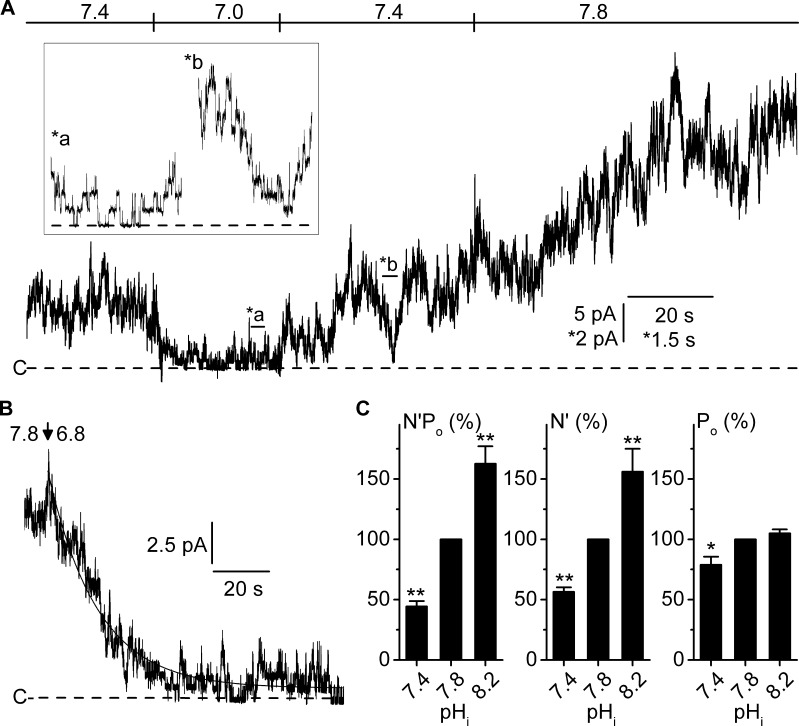
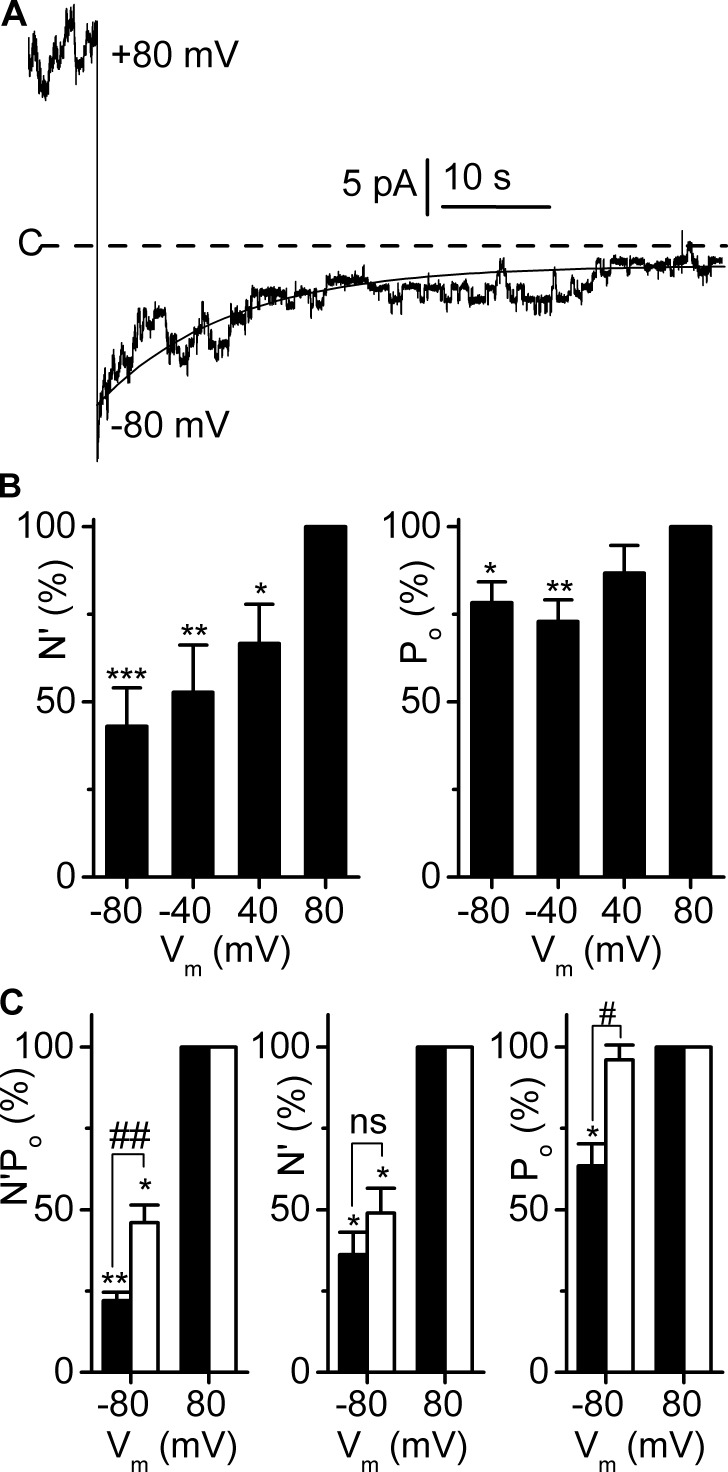
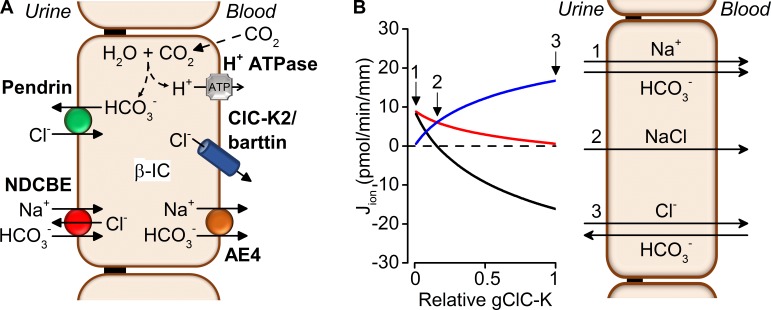
ClC-K2, a member of the ClC family of Cl(-) channels and transporters, forms the major basolateral Cl(-) conductance in distal nephron epithelial cells and therefore plays a central role in renal Cl(-) absorption. However, its regulation remains largely unknown because of the fact that recombinant ClC-K2 has not yet been studied at the single-channel level. In the present study, we investigate the effects of voltage, pH, Cl(-), and Ca(2+) on native ClC-K2 in the basolateral membrane of intercalated cells from the mouse connecting tubule. The ∼10-pS channel shows a steep voltage dependence such that channel activity increases with membrane depolarization. Intracellular pH (pHi) and extracellular pH (pHo) differentially modulate the voltage dependence curve: alkaline pHi flattens the curve by causing an increase in activity at negative voltages, whereas alkaline pHo shifts the curve toward negative voltages. In addition, pHi, pHo, and extracellular Ca(2+) strongly increase activity, mainly because of an increase in the number of active channels with a comparatively minor effect on channel open probability. Furthermore, voltage alters both the number of active channels and their open probability, whereas intracellular Cl(-) has little influence. We propose that changes in the number of active channels correspond to them entering or leaving an inactivated state, whereas modulation of open probability corresponds to common gating by these channels. We suggest that pH, through the combined effects of pHi and pHo on ClC-K2, might be a key regulator of NaCl absorption and Cl(-)/HCO3 (-) exchange in type B intercalated cells.


Figures

Figure 1.
Figure 1.
Conductive properties of the native ClC-K2 channel. Experiments were performed on cell-excised inside-out membrane patches under symmetrical NMDG-Cl conditions. Pipette solution contained 5 mM Ca2+, and pipette and bath pH were set to 7.4. (A) Mean i/Vm relationship. Each point is the mean of 12 determinations, and SEM is shown as error bars when larger than symbols. The straight line is a linear fit of mean data points yielding a conductance of 13 ± 0.2 pS and a reversal potential of 1.7 ± 0.7 mV (R2 = 0.998). (B) Channel density distribution. The maximum number of active channels per patch was determined by peak current measurement, at Vm 80 mV (92 patches). Note the even and odd numbers of channels/patch. (C) Continuous channel recording at Vm 80 mV. The dashed line indicates the closed channel current level (C-), and O1- to O4- indicate the current levels corresponding to the opening of one to four channels. (D) Point-amplitude histogram of the recording shown in C (0.05 pA bins). For clarity, the closed channel current level was subtracted. The continuous line is a nonlinear least square 5-term Gaussian fit of amplitude distribution data yielding peaks of 0.009 ± 0.001 pA (C), 1.09 ± 0.001 pA (O1), 2.2 ± 0.001 pA (O2), 3.3 ± 0.006 pA (O3), and 4.4 pA (O4; R2 = 0.997). (E) Probabilities of the channel current states in the recording shown in C. The measured state probabilities (bars) are shown together with the probability values predicted by a binomial distribution (▲; see Materials and methods) with k = 5 current levels including baseline and Po = 0.282. (F) Continuous recording from a patch with only two apparent active channels. The dashed line indicates the closed channel current level (C-). Note the infrequent short-lived subconductance state (arrow).
Figure 2.
Figure 2.
Channel voltage dependence in the cell-excised inside-out configuration. Experiments were performed under symmetrical NMDG-Cl conditions (pH 7.4), and pipette solution contained 5 mM Ca2+ and bath solution was calcium free. (A) Representative current recordings at the Vm values are given on the right side of each trace. The dashed lines indicate the closed channel current levels (C-). Channel unitary conductance and reversal potential in these conditions (pHi 7.4) are given in Table S1. (B) Mean N′Po/Vm relationship. N′Po data were normalized to the respective N′Po at Vm 80 mV. Each point is the mean of 6–10 measurements, and SEM is shown as error bars. The continuous line is a nonlinear least squares fit with the Boltzmann equation of mean normalized data.
Figure 3.
Figure 3.
Dose–response curve for the effects of pHi on channel activity. Experiments were performed on cell-excised inside-out membrane patches under symmetrical NMDG-Cl conditions, at Vm 80 mV. Pipette solution contained 5 mM Ca2+ (pHo 7.4), and the bath solution was calcium free. (A) Current traces from the same patch exposed to pHi 7.0–8.2. For clarity, the traces were superimposed, the dashed line indicating the closed channel current level (C-). The respective N′Po values are given on the right side of each trace. (B) Dose–response relationship. Each N′Po value at a given pHi was normalized to the paired N′Po at pHi 7.8 on the same patch. Data are means of measurements from four to five patches, and SEM is given as error bars when larger than symbols.
Figure 4.
Figure 4.
Increased pHi flattens the voltage dependence curve. Experiments were performed on inside-out patches symmetrically bathed in NMDG-Cl solution. Pipette solution contained 5 mM Ca2+ (pH 7.4), and the bath solution was calcium free. (A) Recordings from the same patch at Vm 80 mV or at Vm −80 mV, at pHi 7.0 or 7.8. Dashed lines indicate the closed channel current levels (C-). (B) Effects of pHi on N′Po in the conditions given in A, at Vm −80 mV (white bars) and at Vm 80 mV (black bars), at the indicated pHi values. At each potential, N′Po values were normalized to their respective values at pHi 7.8; data are given as means of five experiments, and SEM is shown as error bars. *, P < 0.05 versus Vm 80 mV, paired Student’s t test. (C) Mean N′Po/Vm curves at pHi 7.0 (■), 7.4 (●), 7.6 (▲), and 7.8 (▼). For each pHi condition, N′Po data were normalized to the respective N′Po at Vm 80 mV, and each point is the mean of 9–12 (pHi 7.0), 16–19 (pHi 7.4), 6–10 (pHi 7.6), and 8–12 (pHi 7.8) measurements. SEM is shown as error bars when larger than symbols. Continuous lines are the Boltzmann fits of mean data.
Figure 5.
Figure 5.
Variations in pHo shift the voltage dependence curve. Experiments were performed on inside-out patches symmetrically bathed in NMDG-Cl solution. Pipette solution contained 5 mM Ca2+, and the bath solution was calcium free and adjusted at pH 7.4. (A) Current recordings from two separate patches under external (pipette) pH, pHo, 6.6 (left traces) or 8.0 (right traces) and clamped at the Vm values given on the left side. The dashed lines indicate the closed channel current levels (C-). (B) Mean N′Po/Vm relationships at pHo 6.6 (▲), 7.4 (●), and 8.0 (■). For each pHo condition, N′Po data were normalized to the respective value at Vm 80 mV. Each point is the mean of 5 (pHo 6.6 and 8.0) or 6 (pHo 7.4) measurements, and SEM is shown as error bars when larger than symbols. Continuous lines are nonlinear least squares fits of respective mean data with the Boltzmann equation. (C) Mean V1/2 values from Table 1 plotted as a function of pHo, and SEM is shown as error bars. Data were fitted by a straight line with a slope of 26.6 ± 1.99 mV/pHo unit (R2 = 0.989).
Figure 6.
Figure 6.
[Ca2+]o does not affect channel voltage dependence. Experiments were performed on cell-excised inside-out membrane patches symmetrically bathed in NMDG-Cl solution (pH 7.4) and under calcium-free bath solution. (A) Representative current recordings from two separate patches clamped at Vm 80 mV (top traces) or −80 mV (bottom traces) and under calcium-free (0 Cao, left) or 5 mM (5 Cao, right) external (pipette) conditions. The dashed lines indicate the closed channel current levels (C-). The inset is an excerpt of the trace at Vm 80 mV taken at the indicated location (asterisk) with the corresponding expanded time scale. (B) Mean N′Po/Vm relationships under external calcium-free (□) or 5 mM Ca2+ (●) condition. For each [Ca2+]o condition, N′Po data were normalized to the respective N′Po value at Vm 80 mV. Each point is the mean of five measurements, and SEM is shown as error bars when larger than symbols. Continuous and dashed lines are nonlinear least squares fits with the Boltzmann equation of calcium-free and 5 mM Ca2+ mean data, respectively.
Figure 7.
Figure 7.
pHi modulates the number of active channels. (A) Representative continuous current recording from an inside-out membrane patch at Vm 80 mV, symmetrically bathed in NMDG-Cl solution. Pipette solution contained 5 mM Ca2+ (pH 7.4), and pHi was varied as indicated. The inset contains two excerpts taken at the indicated locations (a and b) at the expanded time and amplitude scales (*). The dashed lines indicate the closed channel current levels (C-). (B) Time course of the change in channel activity upon switching pHi from 7.8 to 6.8 (arrow), at Vm 80 mV. The dashed line indicates the closed channel current level (C-). The fit of the trace under pHi 6.8 to a single exponential equation (continuous line) indicated an e-fold decrease in channel activity after 17.1s. (C) N′Po, number of active channels (N′) and Po as a function of pHi. Paired data were obtained as described in A and normalized to the respective value at pHi 7.8. N′ was determined by peak current measurements and validated by stationary noise analysis (see Materials and methods). Only recordings yielding ΔN′/N′ values within the 95% agreement interval were taken as valid. Data are given as means from four patches, and SEM is shown as error bars. N′Po, N′, and Po means significantly were affected by pHi (P < 0.001, P < 0.001, and P = 0.005, respectively; one-way ANOVA). **, P < 0.001; and *, P < 0.02 versus pHi 7.8 (Holm-Šidák multiple comparison procedure).
Figure 8.
Figure 8.
Membrane voltage modulates the open probability and the number of active channels. Experiments were performed on cell-excised inside-out membrane patches symmetrically bathed in NMDG-Cl solution. Pipette solution contained 5 mM Ca2+ (pHo 7.4), and bath solution was calcium free. (A) Time course of the change in channel activity upon switching Vm from 80 to −80 mV, at pHi 7.4. The dashed line indicates the closed channel current level (C-). The fit of the trace at Vm −80 mV to a single exponential equation (continuous line) indicated an e-fold decrease in channel activity within ∼15 s. (B) Number of active channels per patch (N′) and Po as a function of Vm. For each patch, paired data were normalized to the respective value at Vm 80 mV, pHi 7.4. *, P < 0.05; **, P = 0.01; and ***, P < 0.005, versus Vm 80 mV (Holm-Šidák multiple comparison procedure). (C) Modulation by pHi of the effects of Vm on N′ and Po. For each patch, paired data at pHi 7.4 (black bars) or 7.8 (white bars), at Vm −80 mV, were normalized to the respective value at Vm 80 mV. *, P < 0.005; ** P < 0.0001, versus Vm 80 mV; and #, P < 0.05; ##, P < 0.005 versus pHi 7.8, paired Student’s t test. (B and C) Data are given as means from five patches, and SEM is shown as error bars. N′ was determined by peak current measurements and validated by stationary noise analysis (see Materials and methods). Only recordings yielding ΔN′/N′ values within the 95% agreement interval were taken as valid.
Figure 9.
Figure 9.
Modeling ion transport in the type B intercalated cells. (A) Ion transporter model used for simulations (see Materials and methods). Type B intercalated cells secrete HCO3 into the lumen by the apical Cl/HCO3 exchanger pendrin coupled to the basolateral efflux of protons by the V-ATPase and of Cl by the ClC-K2/Barttin channel. Electroneutral NaCl reabsorption is mediated by the apical coupling of pendrin with the Na+-driven Cl/HCO3 exchanger NDCBE and by the basolateral extrusion of Na+ by Na+-HCO3 cotransporter AE4, and of Cl by ClC-K2. (B) Predicted effects of variations in basolateral membrane chloride conductance (gClC-K) on net fluxes of Cl through ClC-K2 (blue), of Na+ through NDCBE (red), and of apical HCO3 (black; left) and on net transcellular Na+, Cl, and HCO3 transport (right). The labels 1–3 correspond to relative gClC-K values of 0, 0.15, and 1, respectively.

Similar articles

Cited by

References

    1. Andrini O., Keck M., L’Hoste S., Briones R., Mansour-Hendili L., Grand T., Sepúlveda F.V., Blanchard A., Lourdel S., Vargas-Poussou R., and Teulon J.. 2014. CLCNKB mutations causing mild Bartter syndrome profoundly alter the pH and Ca2+ dependence of ClC-Kb channels. Pflugers Arch. 466:1713–1723. 10.1007/s00424-013-1401-2 - DOI - PubMed
    1. Andrini O., Keck M., Briones R., Lourdel S., Vargas-Poussou R., and Teulon J.. 2015. ClC-K chloride channels: emerging pathophysiology of Bartter syndrome type 3. Am. J. Physiol. Renal Physiol. 308:F1324–F1334. 10.1152/ajprenal.00004.2015 - DOI - PubMed
    1. Beck F.X., Dörge A., Rick R., Schramm M., and Thurau K.. 1988. The distribution of potassium, sodium and chloride across the apical membrane of renal tubular cells: effect of acute metabolic alkalosis. Pflugers Arch. 411:259–267. 10.1007/BF00585112 - DOI - PubMed
    1. Bland J.M., and Altman D.G.. 1999. Measuring agreement in method comparison studies. Stat. Methods Med. Res. 8:135–160. 10.1191/096228099673819272 - DOI - PubMed
    1. Chambrey R., Kurth I., Peti-Peterdi J., Houillier P., Purkerson J.M., Leviel F., Hentschke M., Zdebik A.A., Schwartz G.J., Hübner C.A., and Eladari D.. 2013. Renal intercalated cells are rather energized by a proton than a sodium pump. Proc. Natl. Acad. Sci. USA. 110:7928–7933. 10.1073/pnas.1221496110 - DOI - PMC - PubMed

Publication types