

Validation and optimization of hypercapnic-calibrated fMRI from oxygen-sensitive two-photon microscopy
- PMID: 27574311
- PMCID: PMC5003859
- DOI: 10.1098/rstb.2015.0359
Validation and optimization of hypercapnic-calibrated fMRI from oxygen-sensitive two-photon microscopy
Abstract
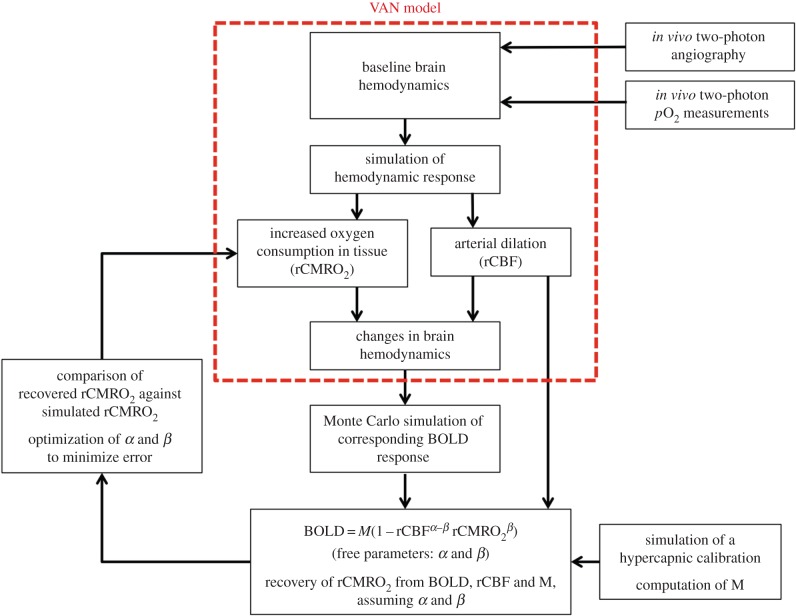
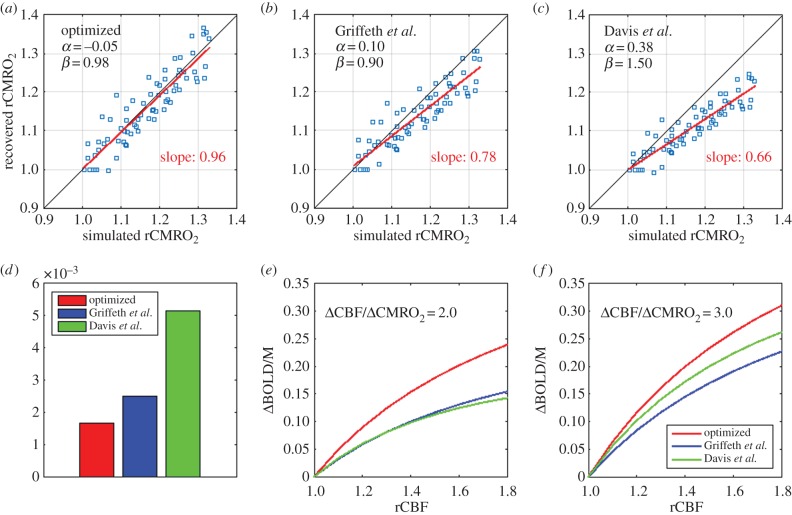
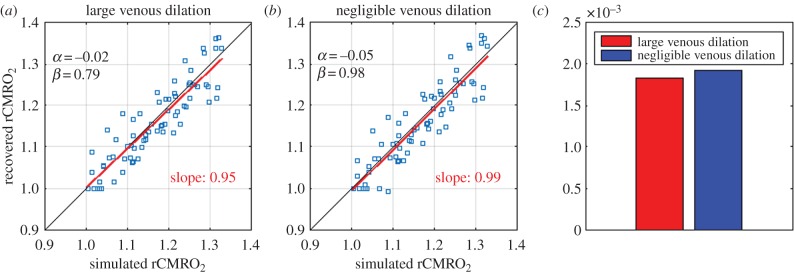
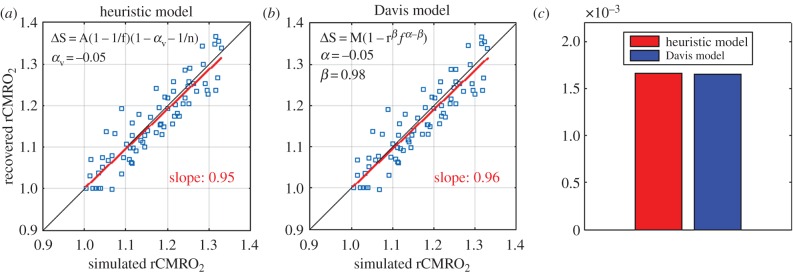
Hypercapnic-calibrated fMRI allows the estimation of the relative changes in the cerebral metabolic rate of oxygen (rCMRO2) from combined BOLD and arterial spin labelling measurements during a functional task, and promises to permit more quantitative analyses of brain activity patterns. The estimation relies on a macroscopic model of the BOLD effect that balances oxygen delivery and consumption to predict haemoglobin oxygenation and the BOLD signal. The accuracy of calibrated fMRI approaches has not been firmly established, which is limiting their broader adoption. We use our recently developed microscopic vascular anatomical network model in mice as a ground truth simulator to test the accuracy of macroscopic, lumped-parameter BOLD models. In particular, we investigate the original Davis model and a more recent heuristic simplification. We find that these macroscopic models are inaccurate using the originally defined parameters, but that the accuracy can be significantly improved by redefining the model parameters to take on new values. In particular, we find that the parameter α that relates cerebral blood-volume changes to cerebral blood-flow changes is significantly smaller than typically assumed and that the optimal value changes with magnetic field strength. The results are encouraging in that they support the use of simple BOLD models to quantify BOLD signals, but further work is needed to understand the physiological interpretation of the redefined model parameters.This article is part of the themed issue 'Interpreting BOLD: a dialogue between cognitive and cellular neuroscience'.
Keywords: Monte Carlo simulations; calibrated fMRI; cerebral metabolism; two-photon microscopy.
© 2016 The Author(s).
Figures
Similar articles
-
Using carbogen for calibrated fMRI at 7Tesla: comparison of direct and modelled estimation of the M parameter.Neuroimage. 2014 Jan 1;84:605-14. doi: 10.1016/j.neuroimage.2013.09.035. Epub 2013 Sep 24. Neuroimage. 2014. PMID: 24071526
-
A novel Bayesian approach to accounting for uncertainty in fMRI-derived estimates of cerebral oxygen metabolism fluctuations.Neuroimage. 2016 Apr 1;129:198-213. doi: 10.1016/j.neuroimage.2016.01.001. Epub 2016 Jan 11. Neuroimage. 2016. PMID: 26790354 Free PMC article.
-
Measurement of oxygen extraction fraction (OEF): An optimized BOLD signal model for use with hypercapnic and hyperoxic calibration.Neuroimage. 2016 Apr 1;129:159-174. doi: 10.1016/j.neuroimage.2016.01.021. Epub 2016 Jan 20. Neuroimage. 2016. PMID: 26801605
-
Functional magnetic resonance imaging in chronic ischaemic stroke.Philos Trans R Soc Lond B Biol Sci. 2016 Oct 5;371(1705):20150353. doi: 10.1098/rstb.2015.0353. Philos Trans R Soc Lond B Biol Sci. 2016. PMID: 27574307 Free PMC article. Review.
-
Calibrated FMRI.Neuroimage. 2012 Aug 15;62(2):930-7. doi: 10.1016/j.neuroimage.2012.02.022. Epub 2012 Feb 17. Neuroimage. 2012. PMID: 22369993 Review.
Cited by
-
The Role of Cerebrovascular-Reactivity Mapping in Functional MRI: Calibrated fMRI and Resting-State fMRI.Front Physiol. 2021 Mar 25;12:657362. doi: 10.3389/fphys.2021.657362. eCollection 2021. Front Physiol. 2021. PMID: 33841190 Free PMC article. Review.
-
Characterizing white matter fiber orientation effects on multi-parametric quantitative BOLD assessment of oxygen extraction fraction.J Cereb Blood Flow Metab. 2020 Apr;40(4):760-774. doi: 10.1177/0271678X19839502. Epub 2019 Apr 5. J Cereb Blood Flow Metab. 2020. PMID: 30952200 Free PMC article.
-
Dependence of the MR signal on the magnetic susceptibility of blood studied with models based on real microvascular networks.Magn Reson Med. 2019 Jun;81(6):3865-3874. doi: 10.1002/mrm.27660. Epub 2019 Jan 18. Magn Reson Med. 2019. PMID: 30659643 Free PMC article.
-
Interpreting BOLD: towards a dialogue between cognitive and cellular neuroscience.Philos Trans R Soc Lond B Biol Sci. 2016 Oct 5;371(1705):20150348. doi: 10.1098/rstb.2015.0348. Philos Trans R Soc Lond B Biol Sci. 2016. PMID: 27574302 Free PMC article.
-
Anatomical Modeling of Brain Vasculature in Two-Photon Microscopy by Generalizable Deep Learning.BME Front. 2020 Dec 5;2020:8620932. doi: 10.34133/2020/8620932. eCollection 2020. BME Front. 2020. PMID: 37849965 Free PMC article.
References
Publication types
MeSH terms
Substances
Grants and funding
LinkOut - more resources
Full Text Sources
Other Literature Sources
Medical
