

What is feasible with imaging human brain function and connectivity using functional magnetic resonance imaging
- PMID: 27574313
- PMCID: PMC5003861
- DOI: 10.1098/rstb.2015.0361
What is feasible with imaging human brain function and connectivity using functional magnetic resonance imaging
Abstract
When we consider all of the methods we employ to detect brain function, from electrophysiology to optical techniques to functional magnetic resonance imaging (fMRI), we do not really have a 'golden technique' that meets all of the needs for studying the brain. We have methods, each of which has significant limitations but provide often complimentary information. Clearly, there are many questions that need to be answered about fMRI, which unlike other methods, allows us to study the human brain. However, there are also extraordinary accomplishments or demonstration of the feasibility of reaching new and previously unexpected scales of function in the human brain. This article reviews some of the work we have pursued, often with extensive collaborations with other co-workers, towards understanding the underlying mechanisms of the methodology, defining its limitations, and developing solutions to advance it. No doubt, our knowledge of human brain function has vastly expanded since the introduction of fMRI. However, methods and instrumentation in this dynamic field have evolved to a state that discoveries about the human brain based on fMRI principles, together with information garnered at a much finer spatial and temporal scale through other methods, are poised to significantly accelerate in the next decade.This article is part of the themed issue 'Interpreting BOLD: a dialogue between cognitive and cellular neuroscience'.
Keywords: brain; cortical column; cortical layers; functional imaging; neurovascular; resting state.
© 2016 The Author(s).
Figures
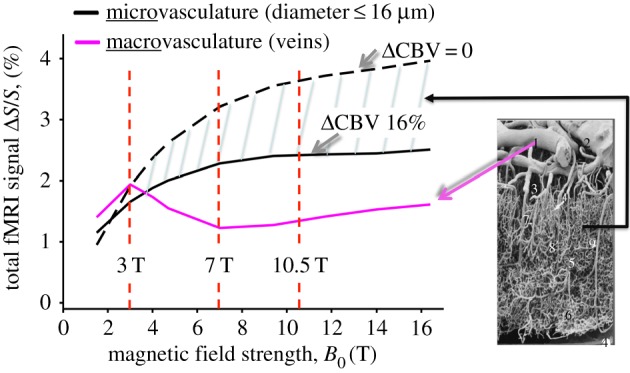

 , normalized to the value at 1.5 T. These plots are valid only in the limit the noise in the fMRI time series is dominated by thermal noise of the image, which is the case, for example, for high-resolution imaging at the level of cortical columns and layers. Plots generated by Uludağ K using data from Uludağ et al. [14].
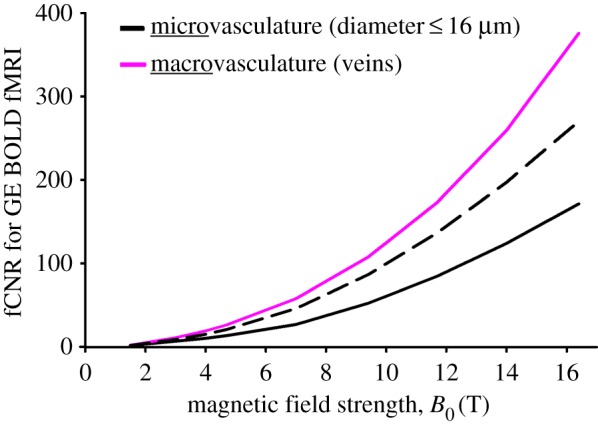
Similar articles
-
Interpreting BOLD: towards a dialogue between cognitive and cellular neuroscience.Philos Trans R Soc Lond B Biol Sci. 2016 Oct 5;371(1705):20150348. doi: 10.1098/rstb.2015.0348. Philos Trans R Soc Lond B Biol Sci. 2016. PMID: 27574302 Free PMC article.
-
Uses, misuses, new uses and fundamental limitations of magnetic resonance imaging in cognitive science.Philos Trans R Soc Lond B Biol Sci. 2016 Oct 5;371(1705):20150349. doi: 10.1098/rstb.2015.0349. Philos Trans R Soc Lond B Biol Sci. 2016. PMID: 27574303 Free PMC article. Review.
-
Repetition suppression: a means to index neural representations using BOLD?Philos Trans R Soc Lond B Biol Sci. 2016 Oct 5;371(1705):20150355. doi: 10.1098/rstb.2015.0355. Philos Trans R Soc Lond B Biol Sci. 2016. PMID: 27574308 Free PMC article. Review.
-
Functional magnetic resonance imaging in chronic ischaemic stroke.Philos Trans R Soc Lond B Biol Sci. 2016 Oct 5;371(1705):20150353. doi: 10.1098/rstb.2015.0353. Philos Trans R Soc Lond B Biol Sci. 2016. PMID: 27574307 Free PMC article. Review.
-
The roadmap for estimation of cell-type-specific neuronal activity from non-invasive measurements.Philos Trans R Soc Lond B Biol Sci. 2016 Oct 5;371(1705):20150356. doi: 10.1098/rstb.2015.0356. Philos Trans R Soc Lond B Biol Sci. 2016. PMID: 27574309 Free PMC article. Review.
Cited by
-
Neuroendocrinological mechanisms underlying impulsive and compulsive behaviors in obesity: a narrative review of fMRI studies.Rev Endocr Metab Disord. 2019 Sep;20(3):263-272. doi: 10.1007/s11154-019-09515-x. Rev Endocr Metab Disord. 2019. PMID: 31654260 Review.
-
Resolving laminar activation in human V1 using ultra-high spatial resolution fMRI at 7T.Sci Rep. 2018 Nov 20;8(1):17063. doi: 10.1038/s41598-018-35333-3. Sci Rep. 2018. PMID: 30459391 Free PMC article.
-
Habits and Persistent Food Restriction in Patients with Anorexia Nervosa: A Scoping Review.Behav Sci (Basel). 2023 Oct 25;13(11):883. doi: 10.3390/bs13110883. Behav Sci (Basel). 2023. PMID: 37998630 Free PMC article.
-
Comparison of Activation Patterns in Mirror Neurons and the Swallowing Network During Action Observation and Execution: A Task-Based fMRI Study.Front Neurosci. 2020 Aug 21;14:867. doi: 10.3389/fnins.2020.00867. eCollection 2020. Front Neurosci. 2020. PMID: 32973431 Free PMC article.
-
Evaluating increases in sensitivity from NORDIC for diverse fMRI acquisition strategies.Neuroimage. 2023 Apr 15;270:119949. doi: 10.1016/j.neuroimage.2023.119949. Epub 2023 Feb 17. Neuroimage. 2023. PMID: 36804422 Free PMC article.
References
-
- Turner R, Grinvald A. 1994. Direct visualization of patterns of deoxyhemoglobin and reoxygenation in monkey cortical vasculature during functional brain activation. Proc. Soc. Magn. Reson.1, 430.
Publication types
MeSH terms
Grants and funding
LinkOut - more resources
Full Text Sources
Other Literature Sources
Medical
