

Effects of Fibrotic Tissue on Liver-targeted Hydrodynamic Gene Delivery
- PMID: 27574785
- PMCID: PMC5023407
- DOI: 10.1038/mtna.2016.63
Effects of Fibrotic Tissue on Liver-targeted Hydrodynamic Gene Delivery
Abstract
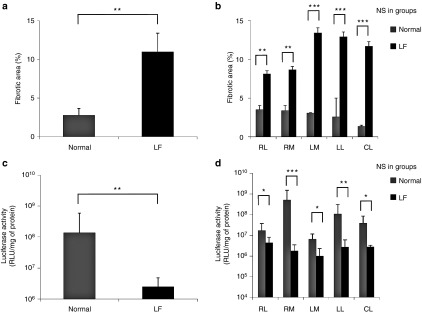
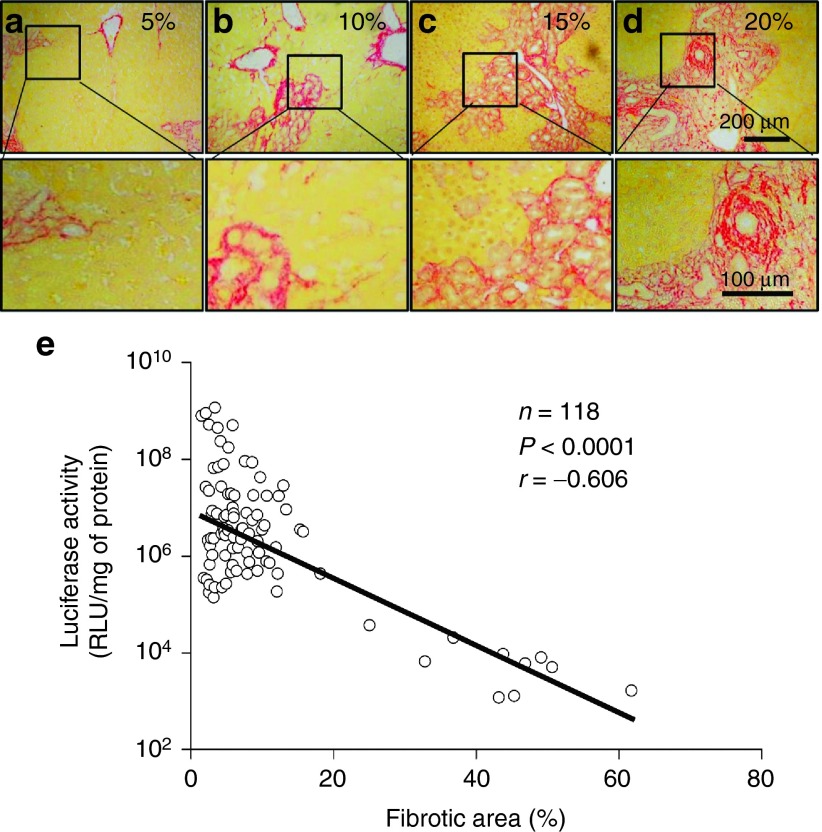
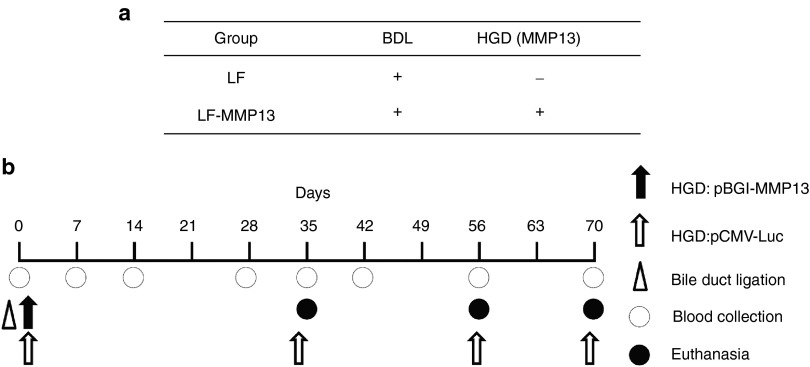
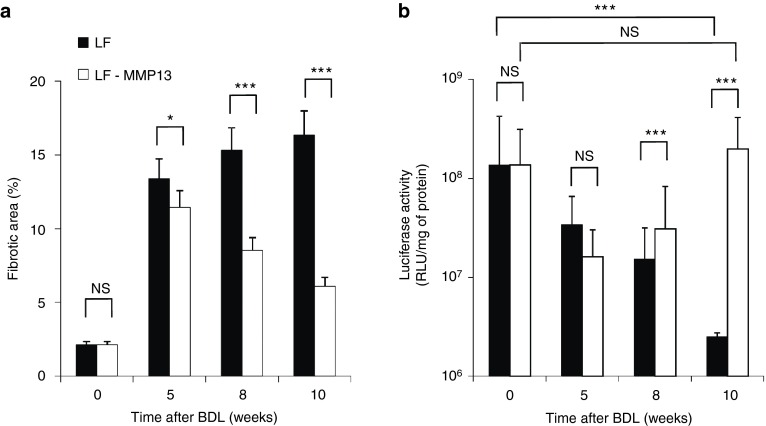
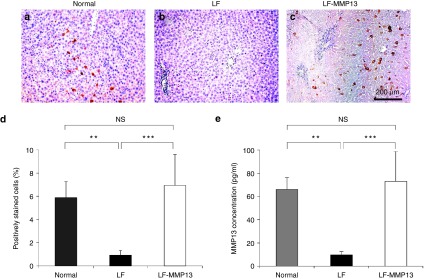
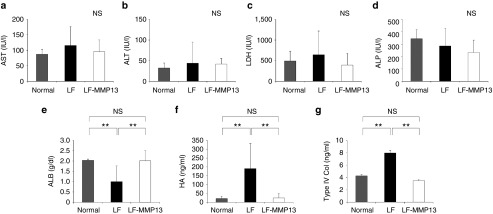
Hydrodynamic gene delivery is a common method for gene transfer to the liver of small animals, and its clinical applicability in large animals has been demonstrated. Previous studies focused on functional analyses of therapeutic genes in animals with normal livers and little, however, is known regarding its effectiveness and safety in animals with liver fibrosis. Therefore, this study aimed to examine the effects of liver fibrosis on hydrodynamic gene delivery efficiency using a rat liver fibrosis model. We demonstrated for the first time, using pCMV-Luc plasmid, that this procedure is safe and that the amount of fibrotic tissue in the liver decreases gene delivery efficiency, resulting in decrease in luciferase activity depending on the volume of fibrotic tissue in the liver and the number of hepatocytes that are immunohistochemically stained positive for transgene product. We further demonstrate that antifibrotic gene therapy with matrix metalloproteinase-13 gene reduces liver fibrosis and improves efficiency of hydrodynamic gene delivery. These results demonstrate the negative effects of fibrotic tissue on hydrodynamic gene delivery and its recovery by appropriate antifibrotic therapy.
Figures
Similar articles
-
Effective Prevention of Liver Fibrosis by Liver-targeted Hydrodynamic Gene Delivery of Matrix Metalloproteinase-13 in a Rat Liver Fibrosis Model.Mol Ther Nucleic Acids. 2016 Jan 5;5(1):e276. doi: 10.1038/mtna.2015.49. Mol Ther Nucleic Acids. 2016. PMID: 26730813 Free PMC article.
-
Hepatic stellate cell-targeted delivery of hepatocyte growth factor transgene via bile duct infusion enhances its expression at fibrotic foci to regress dimethylnitrosamine-induced liver fibrosis.Hum Gene Ther. 2013 May;24(5):508-19. doi: 10.1089/hum.2012.158. Hum Gene Ther. 2013. PMID: 23527815 Free PMC article.
-
Liver lobe-specific hydrodynamic gene delivery to baboons: A preclinical trial for hemophilia gene therapy.Mol Ther Nucleic Acids. 2023 May 17;32:903-913. doi: 10.1016/j.omtn.2023.05.018. eCollection 2023 Jun 13. Mol Ther Nucleic Acids. 2023. PMID: 37346981 Free PMC article.
-
A Broad Range of Dose Optima Achieve High-level, Long-term Gene Expression After Hydrodynamic Delivery of Sleeping Beauty Transposons Using Hyperactive SB100x Transposase.Mol Ther Nucleic Acids. 2016 Jan 19;5(1):e279. doi: 10.1038/mtna.2015.54. Mol Ther Nucleic Acids. 2016. PMID: 26784638 Free PMC article. Review.
-
Targeted Therapies in Liver Fibrosis: Combining the Best Parts of Platelet-Derived Growth Factor BB and Interferon Gamma.Front Med (Lausanne). 2015 Oct 5;2:72. doi: 10.3389/fmed.2015.00072. eCollection 2015. Front Med (Lausanne). 2015. PMID: 26501061 Free PMC article. Review.
Cited by
-
Effect of Diphtheria Toxin-Based Gene Therapy for Hepatocellular Carcinoma.Cancers (Basel). 2020 Feb 18;12(2):472. doi: 10.3390/cancers12020472. Cancers (Basel). 2020. PMID: 32085552 Free PMC article.
-
Technical Improvement and Application of Hydrodynamic Gene Delivery in Study of Liver Diseases.Front Pharmacol. 2017 Aug 30;8:591. doi: 10.3389/fphar.2017.00591. eCollection 2017. Front Pharmacol. 2017. PMID: 28912718 Free PMC article. Review.
-
Early Subcellular Hepatocellular Alterations in Mice Post Hydrodynamic Transfection: An Explorative Study.Cancers (Basel). 2023 Jan 4;15(2):328. doi: 10.3390/cancers15020328. Cancers (Basel). 2023. PMID: 36672277 Free PMC article.
-
Hydrodynamic Delivery: Characteristics, Applications, and Technological Advances.Pharmaceutics. 2023 Mar 31;15(4):1111. doi: 10.3390/pharmaceutics15041111. Pharmaceutics. 2023. PMID: 37111597 Free PMC article. Review.
-
Efficacy and Safety of Pancreas-Targeted Hydrodynamic Gene Delivery in Rats.Mol Ther Nucleic Acids. 2017 Dec 15;9:80-88. doi: 10.1016/j.omtn.2017.08.009. Epub 2017 Aug 18. Mol Ther Nucleic Acids. 2017. PMID: 29246326 Free PMC article.
References
-
- Tsochatzis, EA, Bosch, J and Burroughs, AK (2014). Liver cirrhosis. Lancet 383: 1749–1761. - PubMed
-
- Abe H, Kamimura K, Yokoo T, Suda T, Kobayashi Y et al. (2014) Gene therapy for liver fibrosis. JSM Gastroenterol Hepatol 2: 1028.
-
- Endo, H, Niioka, M, Sugioka, Y, Itoh, J, Kameyama, K, Okazaki, I et al. (2011). Matrix metalloproteinase-13 promotes recovery from experimental liver cirrhosis in rats. Pathobiology 78: 239–252. - PubMed
LinkOut - more resources
Full Text Sources
Other Literature Sources
Molecular Biology Databases
