. 2016 Aug 30;11(8):e0162157.
doi: 10.1371/journal.pone.0162157. eCollection 2016.

Oxidative Stress Facilitates IFN-γ-Induced Mimic Extracellular Trap Cell Death in A549 Lung Epithelial Cancer Cells

Affiliations

Oxidative Stress Facilitates IFN-γ-Induced Mimic Extracellular Trap Cell Death in A549 Lung Epithelial Cancer Cells

Chiou-Feng Lin et al. PLoS One. .

Abstract

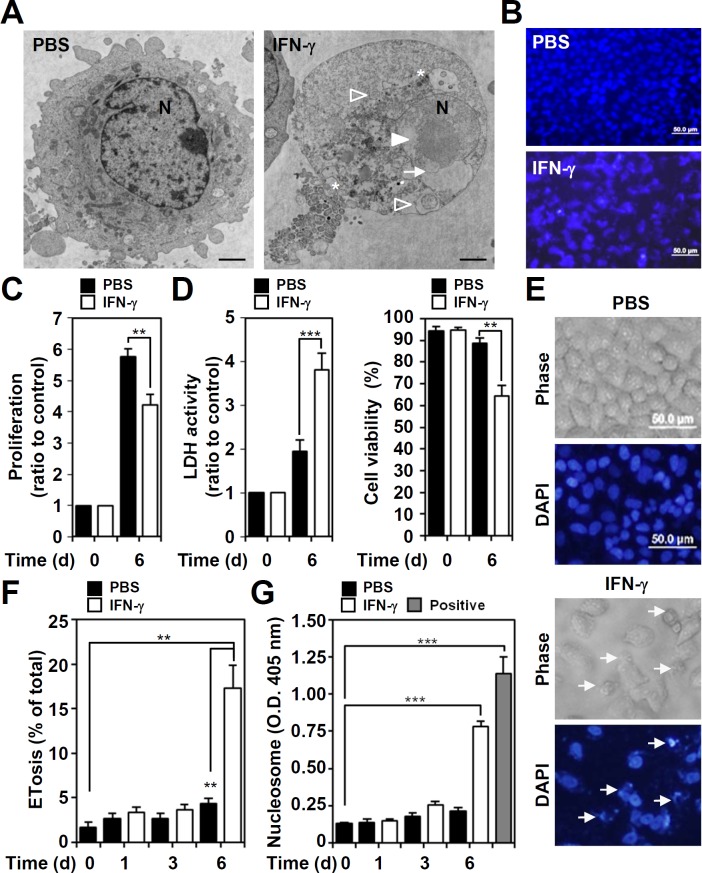
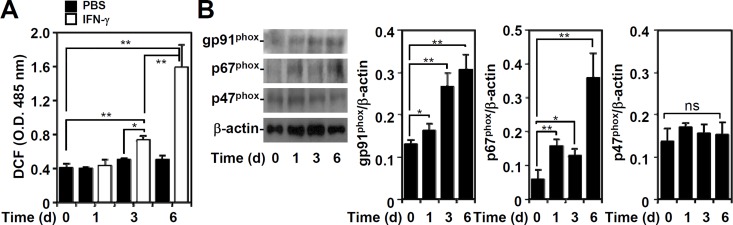
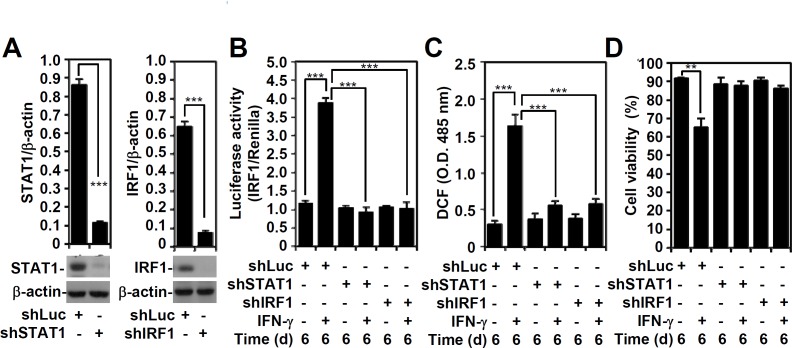
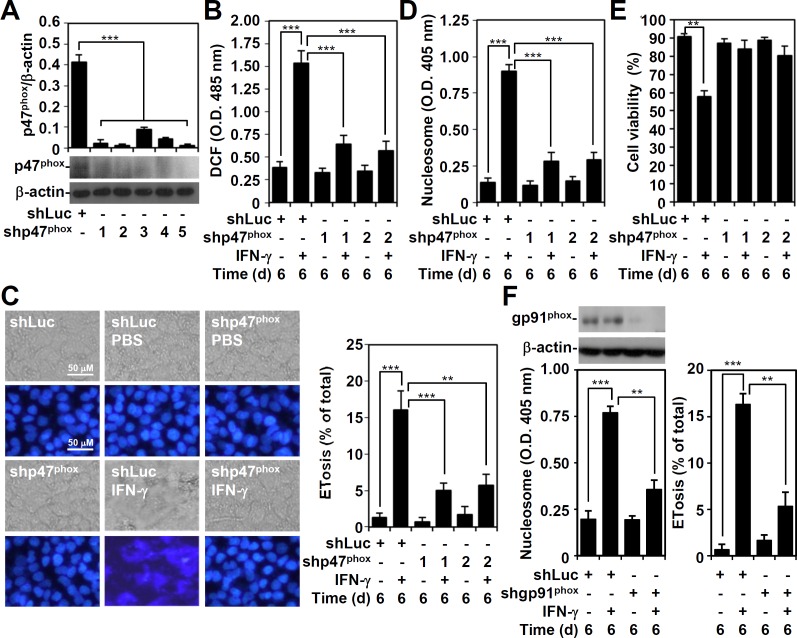
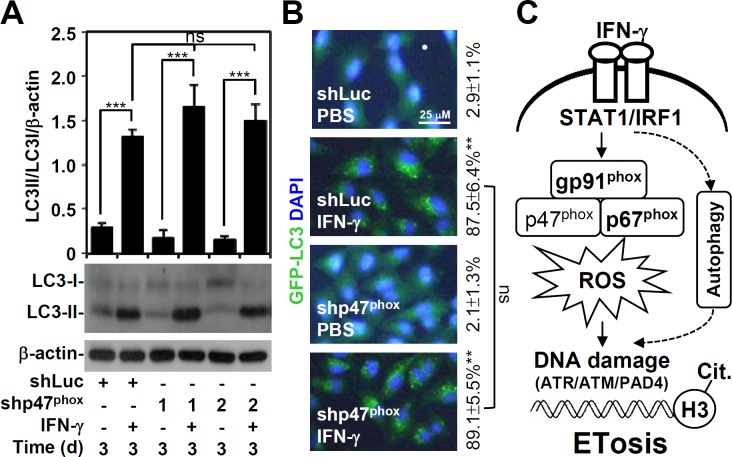
We previously demonstrated that IFN-γ induces an autophagy-regulated mimic extracellular trap cell death (ETosis) in A549 human lung cancer cells. Regarding reactive oxygen species (ROS) are involved in ETosis, this study investigated the role of oxidative stress. After IFN-γ stimulation, a necrosis-like cell death mimic ETosis occurred accompanied by the inhibition of cell growth, aberrant nuclear staining, and nucleosome release. ROS were generated in a time-dependent manner with an increase in NADPH oxidase component protein expression. STAT1-mediated IFN regulatory factor-1 activation was essential for upregulating ROS production. By genetically silencing p47phox, IFN-γ-induced ROS and mimic ETosis were significantly attenuated. This mechanistic study indicated that ROS may mediate DNA damage followed by histone H3 citrullination. Furthermore, ROS promoted IFN-γ-induced mimic ETosis in cooperation with autophagy. These findings further demonstrate that ROS regulates IFN-γ-induced mimic ETosis in lung epithelial malignancy.


Conflict of interest statement

The authors have declared that no competing interests exist.

Figures

Fig 1
Fig 1. Exogenous IFN-γ causes cell proliferation inhibition and cytotoxicity characterized by a mimic ETosis.
(A) Analysis of transmission electron microscopy showed cytoplasmic vacuolization (stars), autolysosome accumulation (empty arrowheads), chromatin decondensation (filled arrowhead), and nuclear membrane disruption (arrow) in IFN-γ (10 ng/ml)-treated A549 cells for 6 days. N, nuclear. Scale bar, 500 nm. (B) Representative DAPI-based nuclear staining followed by fluorescence microscopic analysis showed a mimic ETosis (arrows) in IFN-γ (10 ng/ml)-treated A549 cells 6 days post-treatment. Cell proliferation (C), cell cytotoxicity (D, left), and viability (D, right) were measured in IFN-γ (10 ng/ml)-treated A549 cells for 6 days, and the data are presented as the mean ± SD of three independent experiments, which are shown as the fold change compared to the normalized value of the control or as the percentage of change. **P < 0.01 and ***P < 0.001. (E) Representative morphological change in IFN-γ (10 ng/ml)-treated A549 cells 6 days post-treatment showed a mimic ETosis (arrows) as indicated by DAPI-based nuclear staining followed by fluorescence microscopic analysis. (F) The percentages of cells with mimic ETosis for the indicated time are shown as the mean ± SD of three independent experiments. **P < 0.01. (G) ELISA was used to determine the levels of the extracellular nucleosomes, as a marker of ETosis, in the cell supernatants of IFN-γ (10 ng/ml)-treated cells for the indicated time. The optical density (O.D.) data for the nucleosomes are shown as the mean ± SD of three independent experiments. ***P < 0.001. The empty bar indicates the positive control obtained from the kit. PBS was used as the control for all experiments.
Fig 2
Fig 2. IFN-γ causes ROS generation and NADPH oxidase expression.
(A) ROS generation in IFN-γ (10 ng/ml)-treated A549 cells was determined by CM-H2DCFDA staining followed by analysis using a fluorescent plate reader for the indicated time. The data are presented as the mean ± SD of triplicate cultures and are shown as the relative optical densities (O.D.). *P < 0.05 and **P < 0.01. PBS was used as a control. (B) Representative Western blotting shows gp91phox, p67phox, and p47phox expression in IFN-γ (10 ng/ml)-treated A549 cells for the indicated time. β-actin was used as an internal control. The relative ratios of the measured proteins and β-actin are also shown as the mean ± SD of three independent experiments. *P < 0.05 and **P < 0.01. ns, not significant.
Fig 3
Fig 3. The effects of STAT1 and IRF1 on IFN-γ-induced transactivation of the IRF-1 promoter and on IFN-γ-induced ROS generation.
(A) A representative Western blot of the indicated proteins from A549 cells transfected with shRNA targeting luciferase (shLuc) and shRNA targeting STAT1 (shSTAT1) and IRF1 (shIRF1). β-actin was used as an internal control. The relative ratios of STAT1, IRF1, and β-actin are shown as the mean ± SD of three independent experiments. ***P < 0.001. (B) A luciferase reporter assay showed transactivation of IRF-1 in IFN-γ (10 ng/ml)-treated shLuc-, shSTAT1-, or shIRF-1-transfected A549 cells for 6 days. The ratio of IRF-1 to the Renilla control is shown, and the data are presented as the mean ± SD from three independent experiments. ***P < 0.001. (C) ROS generation in A549 cells was determined using CM-H2DCFDA staining followed by analysis using a fluorescent plate reader. The data are the mean ± SD of triplicate cultures and are shown as relative optical densities (O.D.). ***P < 0.001. (D) The trypan blue exclusion test was performed to assess cell viability. The data are presented as the mean ± SD of triplicate cultures and are shown as relative percentages. **P < 0.01.
Fig 4
Fig 4. p47phox mediates IFN-γ-induced ROS generation and a mimic ETosis.
(A) A representative Western blot of the indicated proteins from A549 cells transfected with shRNA targeting luciferase (shLuc) and shRNA targeting p47phox (shp47phox) (clones 1 to 5). β-actin was used as an internal control. The relative ratios of p47phox and β-actin are also shown as the mean ± SD of three independent experiments. ***P < 0.001. (B) ROS generation in IFN-γ (10 ng/ml)-treated shLuc- and shp47phox (clones 1 and 2)-transfected A549 cells for 6 days was determined using CM-H2DCFDA staining followed by analysis using a fluorescent plate reader. The data are presented as the mean ± SD of triplicate cultures and are shown as relative optical densities (O.D.). ***P < 0.001. Fluorescence microscopy was used to obtain representative images of DAPI-stained nuclei and to determine the percentage of cells with mimic ETosis (C). Nucleosome detection was measured using ELISA (D). The data for the percentages of cells with mimic ETosis and the O.D. value of nucleosome detection are shown as the mean ± SD of three independent experiments. **P < 0.01 and ***P < 0.001. (E) Cell viability was assessed using the trypan blue exclusion test. The data are presented as the mean ± SD of triplicate cultures and are shown as relative percentages. **P < 0.01. (F) shRNA targeting gp91phox was used to silence gp91phox as detected by Western blot analysis. The expression of nucleosome and the percentages of cells with mimic ETosis in gp91phox-transfected A549 cells with or without IFN-γ (10 ng/ml) treatment were determined accordingly. The data for the O.D. value of nucleosome detection and the percentages of cells with mimic ETosis are shown as the mean ± SD of three independent experiments. **P < 0.01 and ***P < 0.001.
Fig 5
Fig 5. p47phox is key for IFN-γ-induced DNA damage and histone H3 citrullination.
(A) After IFN-γ (10 ng/ml) treatment in shLuc- or shp47phox-transfected A549 cells for 6 days, immunostaining with fluorescence microscopy was performed to determine the percentages of phosphor-γ-H2AX (Ser139)-positive nuclei. The data are shown as the mean ± SD of three independent experiments. ***P < 0.001. (B) After IFN-γ (10 ng/ml) treatment in shLuc- and shp47phox-transfected A549 cells for 6 days, Western blotting was performed to detect citrullinated histone H3 (Cit. H3) and histone H3. β-actin was used as an internal control. The relative ratios of Cit. H3 and β-actin are also shown as the mean ± SD of three independent experiments. ***P < 0.001.
Fig 6
Fig 6. IFN-γ-induced autophagy is independent of oxidative stress.
(A) After IFN-γ (10 ng/ml) treatment of shLuc- and shp47phox-transfected A549 cells for 6 days, Western blotting was performed to detect LC3-I/II expression. β-actin was used as an internal control. The relative ratios of LC3-II, LC3-I, and β-actin are also shown as the mean ± SD of three independent experiments. ***P < 0.001. ns, not significant. (B) Representative images of GFP-LC3 puncta formation captured by fluorescence microscopy. The data are shown as the mean ± SD obtained from three consecutive microscopic fields. **P < 0.01 compared to PBS. ns, not significant. (C) Schematic model of ROS-mediated IFN-γ-induced mimic ETosis in lung epithelial malignancy. IFN-γ induces autophagy, which causes DNA damage followed by ATR/ATM/PAD4-mediated histone H3 citrullination and a mimic ETosis. Additionally, IFN-γ-induced NADPH oxidase/ROS signaling enables DNA damage and a mimic ETosis.

Similar articles

Cited by

References

    1. Schroder K, Hertzog PJ, Ravasi T, Hume DA. Interferon-gamma: an overview of signals, mechanisms and functions. Journal of leukocyte biology. 2004;75(2):163–89. 10.1189/jlb.0603252 . - DOI - PubMed
    1. Kaplan DH, Shankaran V, Dighe AS, Stockert E, Aguet M, Old LJ, et al. Demonstration of an interferon gamma-dependent tumor surveillance system in immunocompetent mice. Proceedings of the National Academy of Sciences of the United States of America. 1998;95(13):7556–61. - PMC - PubMed
    1. Street SE, Trapani JA, MacGregor D, Smyth MJ. Suppression of lymphoma and epithelial malignancies effected by interferon gamma. The Journal of experimental medicine. 2002;196(1):129–34. Epub 2002/07/03. - PMC - PubMed
    1. Harvat BL, Seth P, Jetten AM. The role of p27Kip1 in gamma interferon-mediated growth arrest of mammary epithelial cells and related defects in mammary carcinoma cells. Oncogene. 1997;14(17):2111–22. 10.1038/sj.onc.1201055 . - DOI - PubMed
    1. Kominsky S, Johnson HM, Bryan G, Tanabe T, Hobeika AC, Subramaniam PS, et al. IFNgamma inhibition of cell growth in glioblastomas correlates with increased levels of the cyclin dependent kinase inhibitor p21WAF1/CIP1. Oncogene. 1998;17(23):2973–9. 10.1038/sj.onc.1202217 . - DOI - PubMed

MeSH terms