. 2016 Oct;89(10):903-913.
doi: 10.1002/cyto.a.22935. Epub 2016 Aug 30.

Standardization and quality control for high-dimensional mass cytometry studies of human samples

Affiliations

Standardization and quality control for high-dimensional mass cytometry studies of human samples

Katja Kleinsteuber et al. Cytometry A. 2016 Oct.

Abstract

Mass cytometry (CyTOF), a mass spectrometry-based single cell phenotyping technology, allows utilization of over 35 antibodies in a single sample and is a promising tool for translational human immunology studies. Although several analysis tools are available to interpret the complex data sets generated, a robust method for standardization and quality control within and across studies is needed. Here we report an efficient and easily adaptable method to monitor quality of individual samples in human immunology studies and to facilitate reproducible data analysis. Samples to be assessed are spiked with a defined amount of reference peripheral blood mononuclear cells from a healthy donor, derived from a single large blood draw. The presence of known standardized numbers and phenotypic profiles of these reference cells greatly facilitates sample analysis by allowing for: 1) quality control for consistent staining of each antibody in the panel, 2) identification of potential batch effects, and 3) implementation of a robust gating strategy. We demonstrate the utility of this method using peripheral blood and bronchoalveolar lavage samples from HIV+ patients by characterizing their CD8+ T-cell phenotypes and cytokine expression, respectively. Our results indicate that this method allows quality control of experimental conditions and results in highly reproducible population frequencies through a robust gating strategy. © 2016 International Society for Advancement of Cytometry.

Keywords: CyTOF; HIV; Mass cytometry; clinical studies; human immunology.


Figures

Figure 1
Figure 1
Expression patterns of mass cytometry CD8+ T-cell panel markers in PBMCs from the healthy reference blood donor. A: viSNE analysis of viable PBMCs as density plot (left) and shadow plot (right) indicating PBMC lineages. 2D plots below show lineage marker expression for each population. B: Example of identifying negative and positive reference populations for HLA-DR. viSNE plot colored by HLA-DR expression-levels and histograms showing HLA-DR expression for each PBMC population. The negative population (CD8+ T cells) is defined as the population with the lowest expression of HLA-DR and is highlighted by a blue gate and histogram. For CD57, CD8 T cells are the positive populations, which express low levels of this marker (see also Supporting Information Fig. S2). The positive population (B cells) is defined as the population with the highest expression of HLA-DR and is highlighted by a red gate and histogram. C: viSNE plots for all 20 markers in the panel (including Ki-67 and CD69) colored by the respective marker expression. Negative populations for each marker are indicated with a blue gate, positive populations for each marker are indicated with a red gate. D: Summary of positive and negative populations for each marker within the reference PBMCs excluding Ki-67 and CD69.
Figure 2
Figure 2
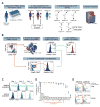
Reference sample approach increases reproducibility of mass cytometry experiments. A: Experimental setup for mass cytometry experiments including a reference sample from a single, healthy donor (blue). B: Data analysis strategy for gating and quality control based on a reference sample. Gates are determined by the 98th percentile of the reference negative population using tethered gating. C: Reproducibility of perforin staining in three replicate experiments of HIV patients spiked with the reference sample. Shown are viable reference cells. Negative reference population is B cells, positive reference population is NK cells. Tethered gates are set by the 98th percentile of the negative population and are subsequently applied to the positive population. D: Expression frequencies of the positive reference populations (as defined in Fig. 1) of each individual marker are shown for three independent experiments with a total of six reference sample repeats. A manipulated sample, which was stained with substandard antibody concentrations for T-bet and CD160 10-times below the optimal concentration, is indicated in orange. Experiments are color-coded and each circle represents reference cells derived from an individual sample. E: Comparison of T-bet and CD160 expression frequencies after staining with the optimal antibody concentrations (blue) and a 10-times lower concentration (orange). The populations shown are NK cells for the reference sample and CD8+ T cells from one HIV-patient, respectively.
Figure 3
Figure 3
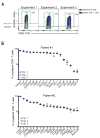
High reproducibility of patient population frequencies after quality control with reference PBMCs. A: Application of the analysis strategy to patient CD8+ T cells using the reference sample approach. CD45RO expression in CD8+ T cells from Patient #1 (blue) for three independent experiments is shown as an example. The negative populations of a spiked-in reference sample are shown for each individual experiment (B-cells, gray) as overlay density plots. The green gates are based on the 98th percentile of the negative reference population (tethered gates); the black gates indicate a manual gate with a constant threshold. B: Expression frequencies of 18 markers in CD8+ T cells from two HIV-patients. Shown are frequencies determined in three independent replicate experiments after gating based on the reference sample. Each circle represents one marker in a single experiment. Median expression is indicated.
Figure 4
Figure 4
Comparison of TNFα expression between PBMCs and BAL from HIV-infected donors. A: TNFα expression in patient T cells derived from either PBMCs or BAL (blue) after 4 h PMA stimulation. Reference cells were spiked into both sample types (gray). Gates are based on the 98th percentile of reference monocytes using tethered gates. B: TNFα frequencies in T cells from PBMCs and BAL derived from four HIV-infected individuals (blue) and in reference T cells, which were spiked into the respective sample (gray). Significance testing was assessed using paired student’s t test.

Comment in

Similar articles

Cited by

References

    1. Bandura DR, Baranov VI, Ornatsky OI, Antonov A, Kinach R, Lou X, Pavlov S, Vorobiev S, Dick JE, Tanner SD. Mass cytometry: Technique for real time single cell multitarget immunoassay based on inductively coupled plasma time-of-flight mass spectrometry. Anal Chem. 2009;81:6813–6822. - PubMed
    1. Ornatsky O, Baranov VI, Bandura DR, Tanner SD, Dick J. Multiple cellular antigen detection by ICP-MS. J Immunol Methods. 2006;308:68–76. - PubMed
    1. Bendall SC, Nolan GP, Roederer M, Chattopadhyay PK. A deep profiler’s guide to cytometry. Trends Immunol. 2012;33:323–332. - PMC - PubMed
    1. Zunder ER, Finck R, Behbehani GK, Amir E-AD, Krishnaswamy S, Gonzalez VD, Lorang CG, Bjornson Z, Spitzer MH, Bodenmiller B, et al. Palladium-based mass tag cell barcoding witha doublet-filtering scheme and single-celldeconvolution algorithm. Nat Protoc. 2015;10:316–333. - PMC - PubMed
    1. Bendall SC, Simonds EF, Qiu P, Amir EAD, Krutzik PO, Finck R, Bruggner RV, Melamed R, Trejo A, Ornatsky OI, et al. Single-cell mass cytometry of differential immune and drug responses across a human hematopoietic continuum. Science. 2011;332:687–696. - PMC - PubMed

Publication types

MeSH terms

LinkOut - more resources