Comparative proteomics illustrates the complexity of drought resistance mechanisms in two wheat (Triticum aestivum L.) cultivars under dehydration and rehydration
- PMID: 27576435
- PMCID: PMC5006382
- DOI: 10.1186/s12870-016-0871-8
Comparative proteomics illustrates the complexity of drought resistance mechanisms in two wheat (Triticum aestivum L.) cultivars under dehydration and rehydration
Abstract
Background: Drought stress is one of the most adverse environmental constraints to plant growth and productivity. Comparative proteomics of drought-tolerant and sensitive wheat genotypes is a strategy to understand the complexity of molecular mechanism of wheat in response to drought. This study attempted to extend findings regarding the potential proteomic dynamics in wheat under drought stress and to enrich the research content of drought tolerance mechanism.
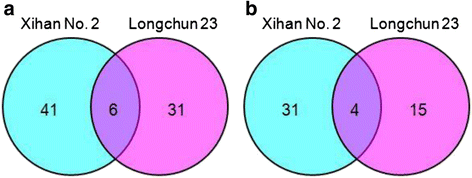
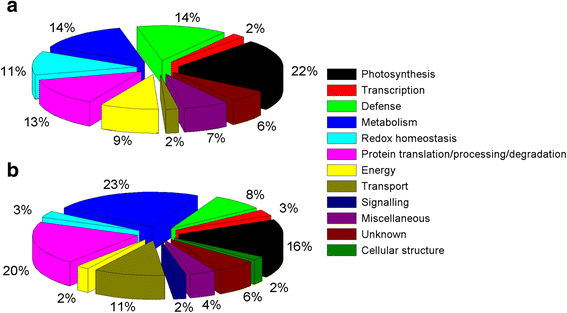
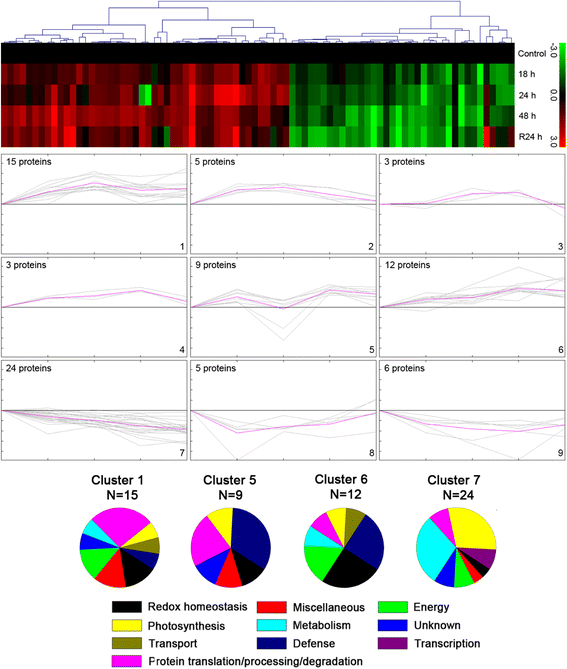
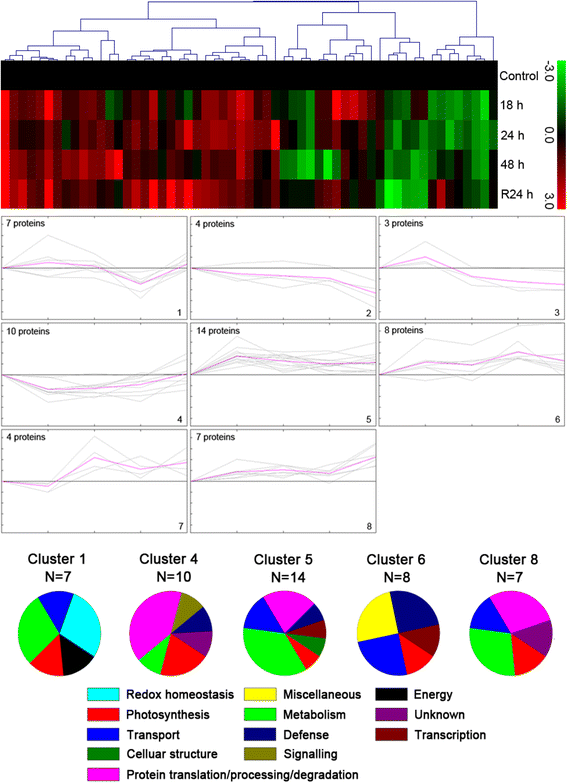
Results: A comparative proteomics approach was applied to analyze proteome change of Xihan No. 2 (a drought-tolerant cultivar) and Longchun 23 (a drought-sensitive cultivar) subjected to a range of dehydration treatments (18 h, 24 h and 48 h) and rehydration treatment (R24 h) using 2-DE, respectively. Quantitative image analysis showed a total of 172 protein spots in Xihan No. 2 and 215 spots from Longchun 23 with their abundance significantly altered (p < 0.05) more than 2.5-fold. Out of these spots, a total of 84 and 64 differentially abundant proteins were identified by MALDI-TOF/TOF MS in Xihan No. 2 and Longchun 23, respectively. Most of these identified proteins were involved in metabolism, photosynthesis, defence and protein translation/processing/degradation in both two cultivars. In addition, the proteins involved in redox homeostasis, energy, transcription, cellular structure, signalling and transport were also identified. Furthermore, the comparative analysis of drought-responsive proteome allowed for the general elucidation of the major mechanisms associated with differential responses to drought of both two cultivars. These cellular processes work more cooperatively to re-establish homeostasis in Xihan No. 2 than Longchun 23. The resistance mechanisms of Xihan No. 2 mainly included changes in the metabolism of carbohydrates and amino acids as well as in the activation of more antioxidation and defense systems and in the levels of proteins involved in ATP synthesis and protein degradation/refolding.
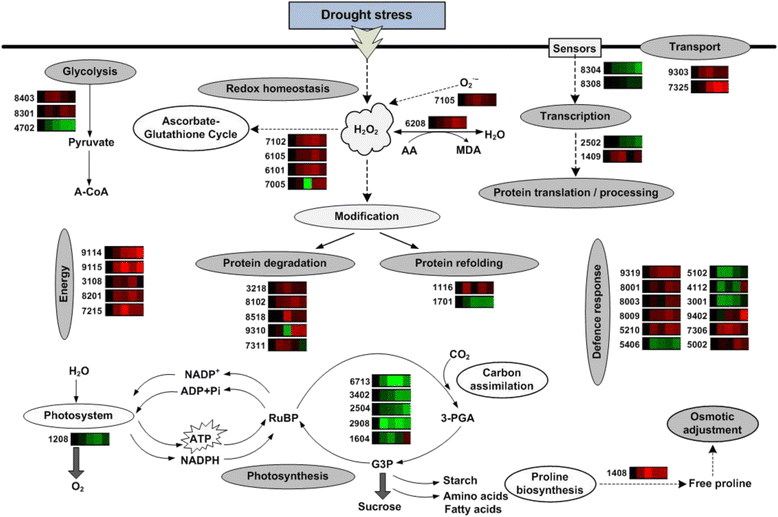
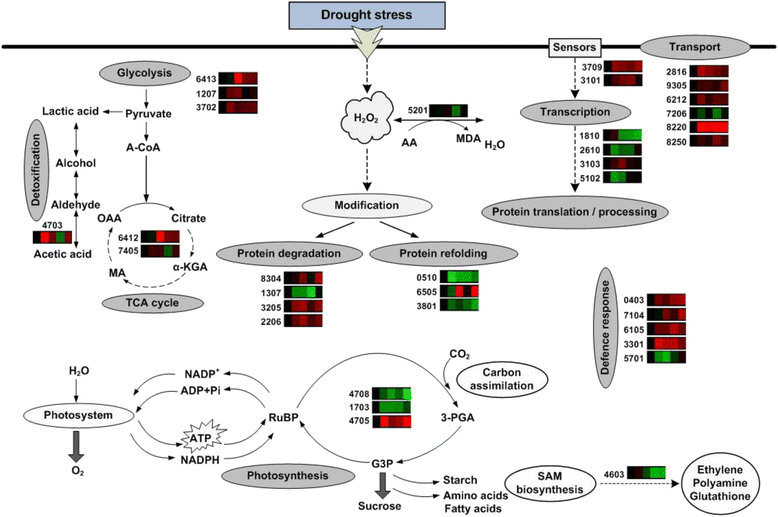
Conclusions: This study revealed that the levels of a number of proteins involved in various cellular processes were affected by drought stress in two wheat cultivars with different drought tolerance. The results showed that there exist specific responses to drought in Xihan No. 2 and Longchun 23. The proposed hypothetical model would explain the interaction of these identified proteins that are associated with drought-responses in two cultivars, and help in developing strategies to improve drought tolerance in wheat.
Keywords: 2-DE; Differentially abundant proteins; Drought stress; MALDI-TOF/TOF; Proteomics; Wheat.
Figures

Similar articles
-
Comparative proteomic analysis of grain development in two spring wheat varieties under drought stress.Anal Bioanal Chem. 2012 Jan;402(3):1297-313. doi: 10.1007/s00216-011-5532-z. Epub 2011 Nov 13. Anal Bioanal Chem. 2012. PMID: 22080421
-
Proteomic Analysis of Vernalization Responsive Proteins in Winter Wheat Jing841.Protein Pept Lett. 2018;25(3):260-274. doi: 10.2174/0929866525666180118103039. Protein Pept Lett. 2018. PMID: 29345567
-
Physiological and comparative proteomic analysis reveals different drought responses in roots and leaves of drought-tolerant wild wheat (Triticum boeoticum).PLoS One. 2015 Apr 10;10(4):e0121852. doi: 10.1371/journal.pone.0121852. eCollection 2015. PLoS One. 2015. PMID: 25859656 Free PMC article.
-
The wheat chloroplastic proteome.J Proteomics. 2013 Nov 20;93:326-42. doi: 10.1016/j.jprot.2013.03.009. Epub 2013 Apr 3. J Proteomics. 2013. PMID: 23563086 Review.
-
Proteomics of stress responses in wheat and barley-search for potential protein markers of stress tolerance.Front Plant Sci. 2014 Dec 11;5:711. doi: 10.3389/fpls.2014.00711. eCollection 2014. Front Plant Sci. 2014. PMID: 25566285 Free PMC article. Review.
Cited by
-
Comparative Proteomics Analysis of the Seedling Root Response of Drought-sensitive and Drought-tolerant Maize Varieties to Drought Stress.Int J Mol Sci. 2019 Jun 7;20(11):2793. doi: 10.3390/ijms20112793. Int J Mol Sci. 2019. PMID: 31181633 Free PMC article.
-
The Plant-Transpiration Response to Vapor Pressure Deficit (VPD) in Durum Wheat Is Associated With Differential Yield Performance and Specific Expression of Genes Involved in Primary Metabolism and Water Transport.Front Plant Sci. 2019 Jan 15;9:1994. doi: 10.3389/fpls.2018.01994. eCollection 2018. Front Plant Sci. 2019. PMID: 30697225 Free PMC article.
-
Plant Abiotic Stress Proteomics: The Major Factors Determining Alterations in Cellular Proteome.Front Plant Sci. 2018 Feb 8;9:122. doi: 10.3389/fpls.2018.00122. eCollection 2018. Front Plant Sci. 2018. PMID: 29472941 Free PMC article. Review.
-
Isotopically Dimethyl Labeling-Based Quantitative Proteomic Analysis of Phosphoproteomes of Soybean Cultivars.Biomolecules. 2021 Aug 16;11(8):1218. doi: 10.3390/biom11081218. Biomolecules. 2021. PMID: 34439883 Free PMC article.
-
Redox and Ionic Homeostasis Regulations against Oxidative, Salinity and Drought Stress in Wheat (A Systems Biology Approach).Front Genet. 2017 Oct 17;8:141. doi: 10.3389/fgene.2017.00141. eCollection 2017. Front Genet. 2017. PMID: 29089961 Free PMC article. Review.
References
-
- The International Wheat Genome Sequencing Consortium (IWGSC) A chromosome-based draft sequence of the hexaploid bread wheat (Triticum aestivum) genome. Science. 2014 - PubMed
Publication types
MeSH terms
Substances
LinkOut - more resources
Full Text Sources
Other Literature Sources

