. 2016 Oct 14;291(42):22173-22195.
doi: 10.1074/jbc.M116.741959. Epub 2016 Aug 30.

Human Sex Determination at the Edge of Ambiguity: INHERITED XY SEX REVERSAL DUE TO ENHANCED UBIQUITINATION AND PROTEASOMAL DEGRADATION OF A MASTER TRANSCRIPTION FACTOR

Affiliations

Human Sex Determination at the Edge of Ambiguity: INHERITED XY SEX REVERSAL DUE TO ENHANCED UBIQUITINATION AND PROTEASOMAL DEGRADATION OF A MASTER TRANSCRIPTION FACTOR

Joseph D Racca et al. J Biol Chem. .

Abstract

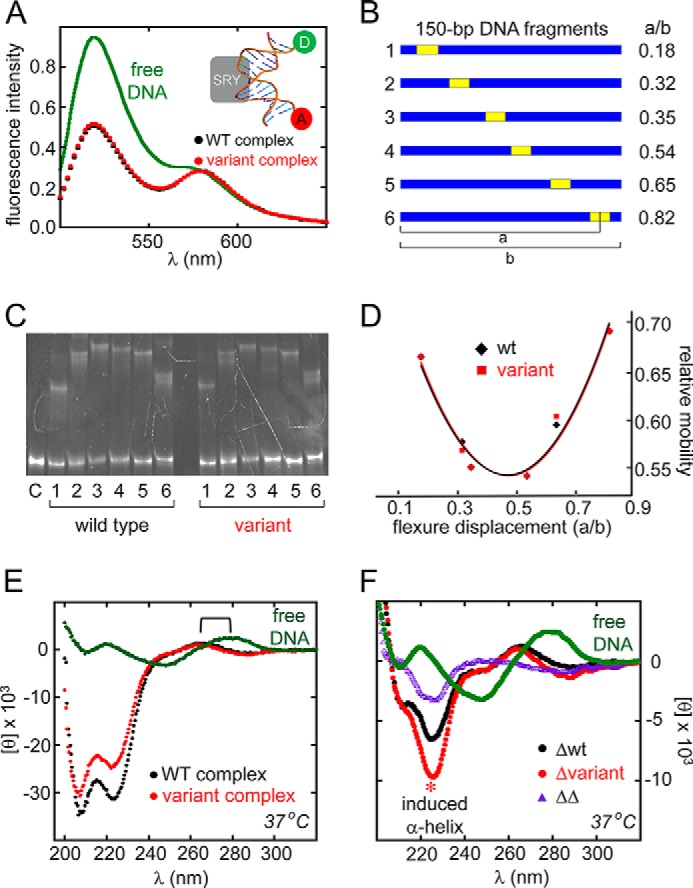
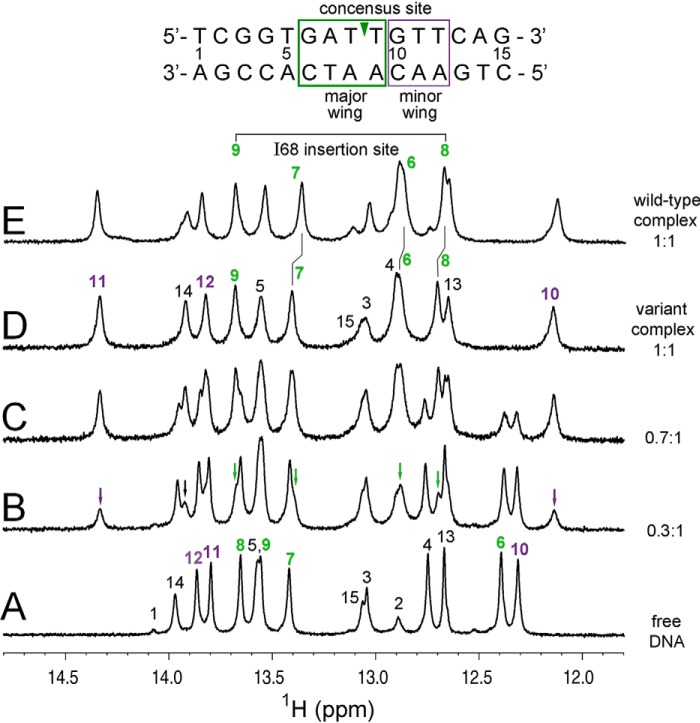
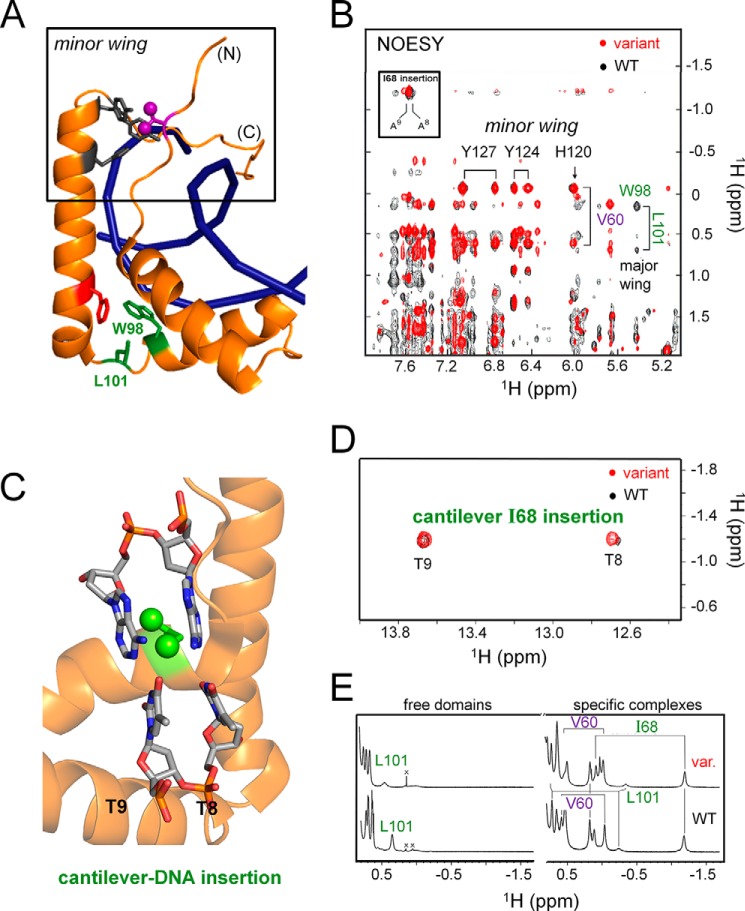
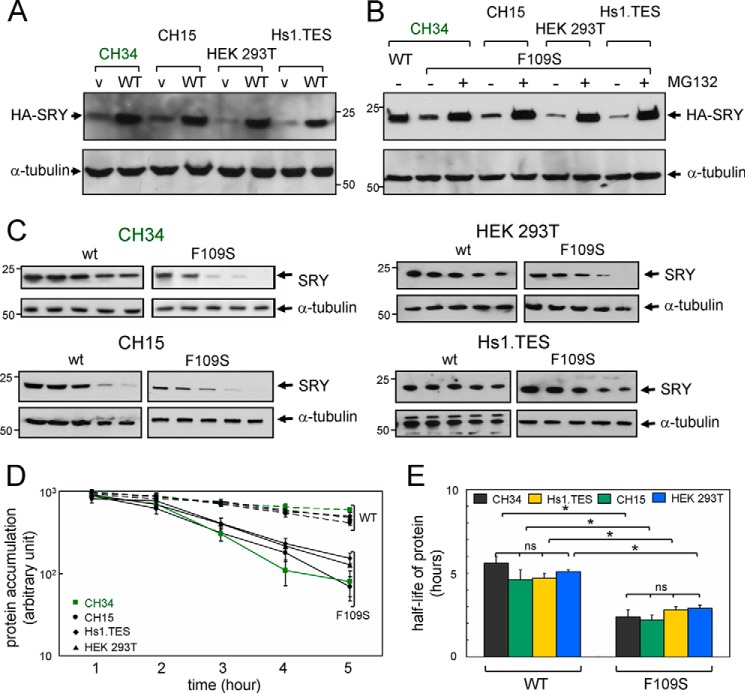
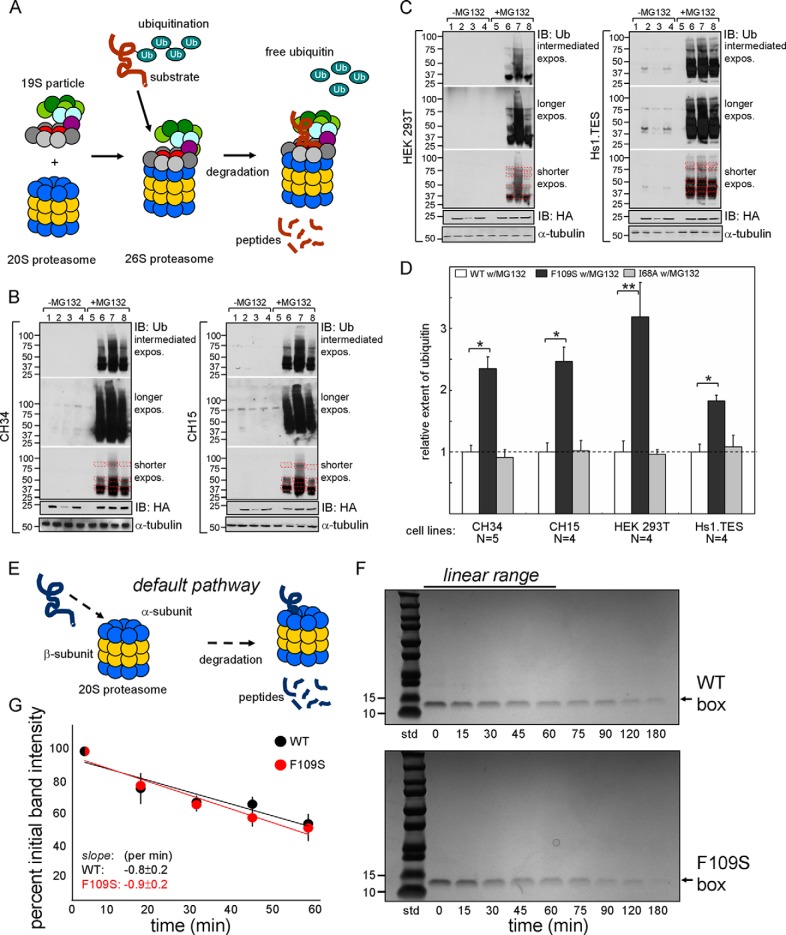
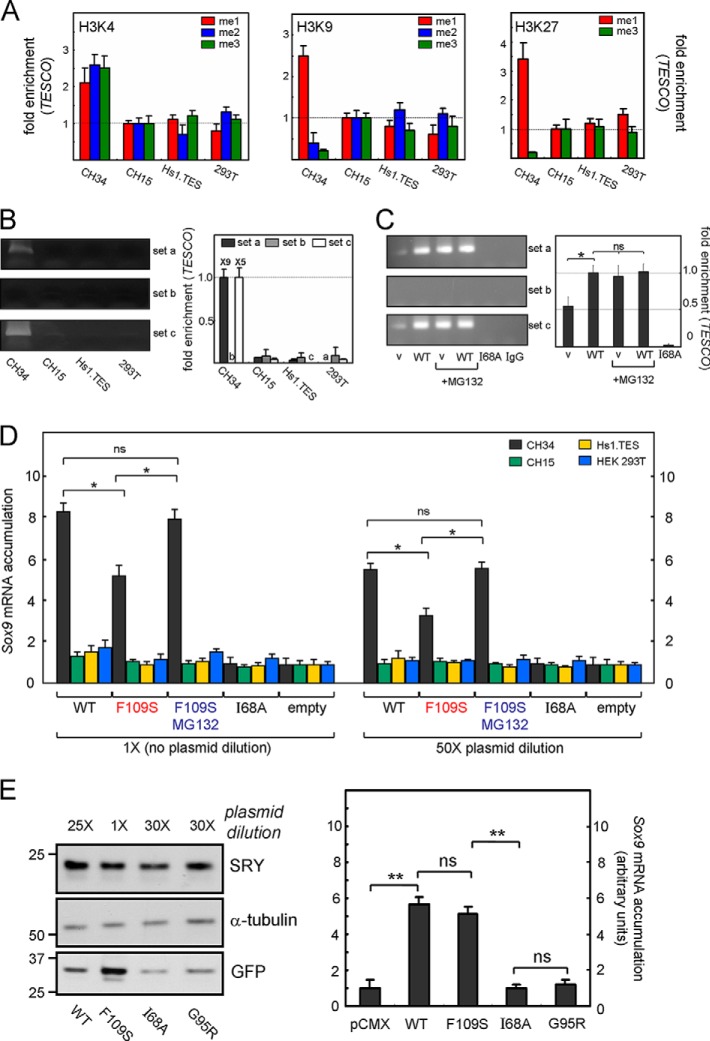
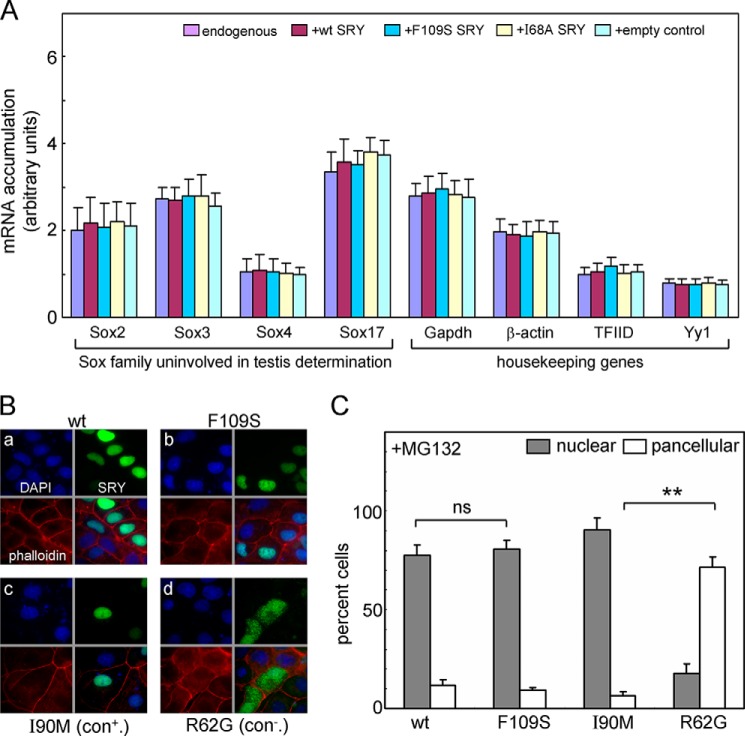
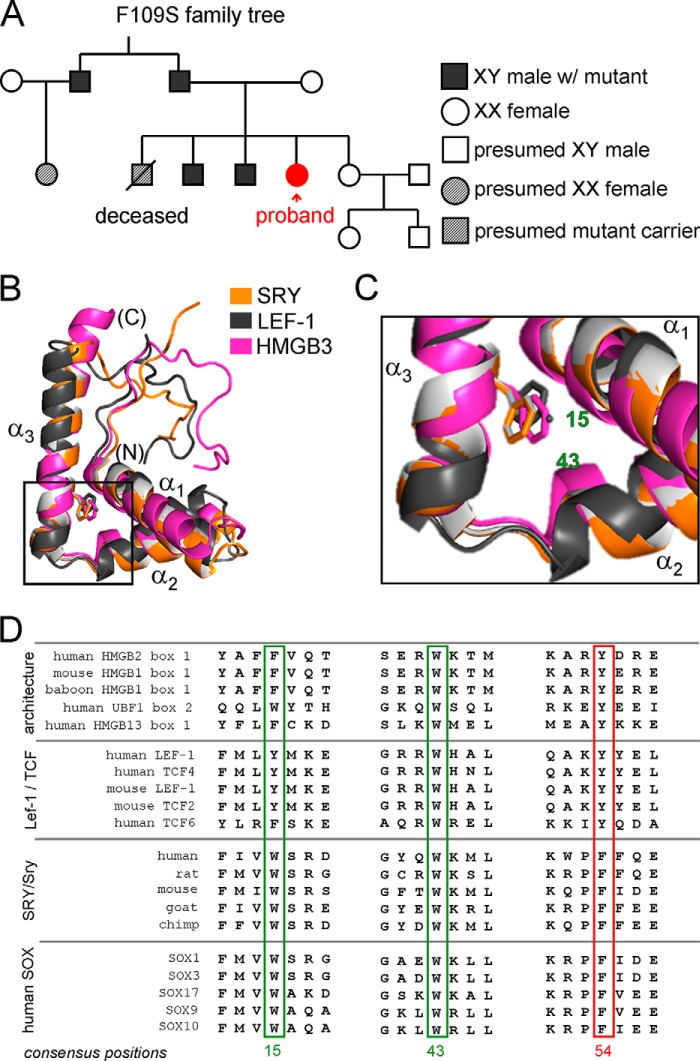
A general problem is posed by analysis of transcriptional thresholds governing cell fate decisions in metazoan development. A model is provided by testis determination in therian mammals. Its key step, Sertoli cell differentiation in the embryonic gonadal ridge, is initiated by SRY, a Y-encoded architectural transcription factor. Mutations in human SRY cause gonadal dysgenesis leading to XY female development (Swyer syndrome). Here, we have characterized an inherited mutation compatible with either male or female somatic phenotypes as observed in an XY father and XY daughter, respectively. The mutation (a crevice-forming substitution at a conserved back surface of the SRY high mobility group box) markedly destabilizes the domain but preserves specific DNA affinity and induced DNA bend angle. On transient transfection of diverse human and rodent cell lines, the variant SRY exhibited accelerated proteasomal degradation (relative to wild type) associated with increased ubiquitination; in vitro susceptibility to ubiquitin-independent ("default") cleavage by the 20S core proteasome was unchanged. The variant's gene regulatory activity (as assessed in a cellular model of the rat embryonic XY gonadal ridge) was reduced by 2-fold relative to wild-type SRY at similar levels of mRNA expression. Chemical proteasome inhibition restored native-like SRY expression and transcriptional activity in association with restored occupancy of a sex-specific enhancer element in principal downstream gene Sox9, demonstrating that the variant SRY exhibits essentially native activity on a per molecule basis. Our findings define a novel mechanism of impaired organogenesis, accelerated ubiquitin-directed proteasomal degradation of a master transcription factor leading to a developmental decision poised at the edge of ambiguity.

Keywords: DNA-binding domain; Sywer syndrome; developmental factor; disorders of sexual development; intersex; proteasome; protein degradation; reproduction; transcription.


Figures

FIGURE 1.
FIGURE 1.
SRY-regulated gene-regulatory network and structure of human SRY HMG box. A, pathway of SRY-dependent testis determination. Red box highlights the central SRY → SOX9 axis. Genetic inputs are shown at left and outputs at right. In the differentiating gonadal ridge, SOX9 functions to activate a male-specific gene-regulatory network, effecting in turn a hormonal pathway of Müllerian-duct regression (dashed ⊥; Müllerian inhibiting substance MIS, also designated anti-Müllerian hormone or AMH) and inhibit granulosa cell fate (solid ⊥; Wnt pathway). B, domain organization; the central HMG box is highlighted in gold. N-terminal serine phosphorylation sites and putative C-terminal PDZ-binding motif are indicated by maroon and gray boxes, respectively; bridge domain is labeled Br. Triangles indicate sites of clinical mutation: green, de novo; solid red, inherited; and open red, mosaic father. C, ribbon model of the SRY HMG box bound to DNA (middle) and with DNA omitted (left). This L-shaped domain consists of major and minor wings; their confluence (green circle) contains a hydrophobic core underlying an angular DNA-bending surface. D, environment of Phe-109 (red stick; consensus residue 54) within space-filling model of SRY domain-DNA complex. The SRY surface is coded by electrostatic potential (negative in red; positive, blue); the DNA surface is shown in gray. Phe-109 (within black box) partially exposed in nonpolar crevice on back surface of the domain. E, expanded view of ribbon model showing side chains near Phe-109 in core: Trp-70, Trp-98, and Leu-101 (consensus positions 15, 43, and 46). Side chains of Phe-67 and Val-69 (consensus positions 12 and 14) buttress the domain's wedge-cantilever motif (Ile-68; see Fig. 9). F, expanded view of Phe-109 side chain (red stick) in crevice boxed in C. Asterisks indicate main-chain borders, whereas neighboring side chains are without asterisks. Coordinates for structural models were obtained from Protein Data Bank (PDB) code 1J46 (27).
FIGURE 2.
FIGURE 2.
Stability of SRY domains. A, thermal unfolding transitions as monitored by CD at 222 nm: black, WT human; red, variant human; and blue, WT murine. B, derivatives of thermal unfolding curves. Arrows indicate midpoint temperatures (Tm in Table 1); the color code is as in A. C, intrinsic Trp fluorescence at 15 °C (filled circles) and 37 °C (open circles): solid black and open black circles, WT human; solid red and open red circles, variant human; and solid blue and open blue circles, WT murine. At a given temperature, decreased emission (due to increased core quenching) indicates more efficient desolvation of the conserved indole rings of Trp-70 and Trp-98 (box positions 15 and 43; Fig. 3E). The spectrum of each domain likewise exhibits a blue shift in emission maximum at the lower temperature (relative to its spectrum at the higher temperature). The human domain contains an additional non-conserved Trp exposed on its surface (Trp-107; box position 52) that is absent in the murine domain. D–F, far-UV CD spectra of the three domains are similar at 4 °C, but their respective α-helical signatures exhibit distinct patterns of attenuation at 25 and 37 °C. Relative to the WT human domain (black), loss of structure is more marked in the variant domain (red) than in the murine domain (blue) in accordance with their respective thermal unfolding transitions (A and B). G–I, guanidine (Gu·HCl)-induced unfolding at 4, 25, and 37 °C as monitored by CD at 222 nm. The variant and murine domains each exhibit greater sensitivity to chemical denaturation than does WT SRY (color code as in D–F). Estimates of Cmid and ΔGu were obtained at 4 °C by application of a two-state model (Table 1). Use of this model at the higher temperatures was limited by possible non-two-state behavior.
FIGURE 3.
FIGURE 3.
Temperature dependence of 1H-15N HSQC spectra and DNA-dependent folding. A and B, 1H-15N HSQC spectra of wild-type (A) and F109S variant (B) at 15 °C (blue peaks), 25 °C (gold), and 35 °C (green). For wild-type SRY, three cross-peaks corresponding each Trp side-chain indole NH were observed at 15 and 25 °C, respectively, whereas multiple sets of Trp side-chain cross-peaks were observed at 35 °C, indicating that wild-type Trp residues exist in multiple local conformation at 35 °C. C and D, for F109S mutant, multiple sets of Trp side-chain cross-peaks were observed even at 15 °C, also the main chain amide cross-peaks crowded in the center region (1HN chemical shift range in 7.5–8.5 ppm) at 25 °C (C); and the HSQC spectral pattern is similar as that of WT in 5 m urea (D), suggesting that F109S mutant exists in multiple conformation at lower temperature (15 °C) and partially random-coiled conformation at 35 °C. The results are consistent with the temperature dependence of 1D 1H NMR spectra of wild-type SRY and F109S mutant. E, ribbon model of major wing of the WT human SRY HMG box; helices α1–α3 are as labeled. Invariant Trp residues of the core (Trp-70 and Trp-98; box positions 15 and 43) are shown in green, and Phe-109 (box position 54) is in red. An additional non-conserved Trp shown in gray (Trp-107; box position 52) flexibly projects into solvent from the back surface of helix 3. The minor wing (data not shown) would extend to the top of the page. F and G, 1H-15N HSQC side-chain indole NH resonances of the free WT (F) and F109S (G) domains. Unlike the WT spectrum (which contains three cross-peaks corresponding to the three Trp side chains; assignments as labeled), the variant domain exhibits one cross-peak for Trp-107 but two or more cross-peaks for each of the core Trp side chains (red). H and I, 1H-15N HSQC side-chain indole NH resonances of the DNA-bound WT (H) and F109S (I) domains. The variant spectrum (like the WT spectrum) exhibits three cross-peaks, indicating DNA-dependent stabilization of a unique ground state. Presumptive assignments are as indicated. Black squares indicate positions of the WT resonances. Changes in 1H and 15N chemical shifts (arrows) may reflect the absence of the WT Phe-109 aromatic ring current and/or subtle reorganization of the core due to a residual packing defect around the variant Ser-109 side chain. Spectra were obtained at 25 °C at a proton frequency of 700 MHz; the proteins and their DNA complexes were made 0.5 mm in 50 mm KCl and 10 mm potassium phosphate (pH 7.4). Coordinates were obtained from PDB code 1J46 (27).
FIGURE 4.
FIGURE 4.
Specific DNA affinity and kinetic stability of the protein-DNA complexes. A, FRET-based dissociation constant (Kd) graphs at the temperatures reported in Table 1. The variant domains are in red (trace and axis label). B, stopped-flow FRET traces to determine dissociation rate constant (koff) values reported in Table 2; WT traces are in black and Phe-109 in red.
FIGURE 5.
FIGURE 5.
Specific DNA bending and mutual induced fit. A, FRET assay of protein-directed DNA bending. Inset, schematic model of 15-bp DNA site containing a 5′-fluoroscein label at one end (donor; D) and 5′-tetramethylrhodamine label at the other (acceptor; A). Relative to free (A, D)-labeled DNA, binding of the WT (black) or variant (red) SRY domains led to similar enhancements of FRET efficiency as indicated by decreased donor emission at 520 nm. B–D, permutation gel electrophoresis at 4 °C. B, 150-bp duplex DNA fragments, each containing an SRY target site (5′-ATTGTT-3′ and complement) at indicated position. Flexure displacements are at right. C, gel showing dependence of electrophoretic mobility of WT or variant protein-DNA complexes on position of DNA target site within probe. Lanes 1–6 in each set refer to DNA probes in B. Lane C at far left indicates free DNA probe. D, plot of electrophoretic mobilities (vertical axis) versus flexure displacement (horizontal axis). The similar patterns imply indistinguishable DNA bend angles in WT and variant complexes (∠Δθ∠ <1°). E and F, CD studies of mutual induced fit in SRY-DNA complex at 37 °C. E, CD spectra of the free DNA (green), WT complex (black), and variant complex (red). Bracket indicates blue-shift of DNA band reminiscent of classical B → A transition. F, CD difference spectra relative to spectrum of free DNA (green). Black and red spectra represent respective difference WT and variant spectra, obtained by subtracting the spectra of the free domain and free DNA from the spectrum of the complex (a buffer control was also added). Purple spectrum represents the difference between the spectra of the WT complex and variant complex (or equivalently, between the red and black curves). Asterisk highlights marked stabilization of α-helical structure in variant on specific DNA binding.
FIGURE 6.
FIGURE 6.
1H NMR protein-DNA titration. A, imino spectrum of free 15-bp DNA site (downfield guanosine N1H and thymidine N3H resonances). Assignments are as indicated (numbering scheme; top). Base pairs contacted by SRY major wing are labeled in green; contacted by its minor wing (including tail) are labeled in violet (boxes at top). B–D, spectra obtained on addition of successive aliquots of the variant SRY domain; protein-DNA stoichiometries are given at right. Arrows in B indicate complex-specific imino resonances in slow exchange on NMR time scale. E, WT imino spectrum. Vertical segments between E and D indicate small differences in chemical shifts of thymidine N3H resonances at positions 6–8; imino 1H NMR chemical shifts are otherwise similar. Horizontal bracket at top site of side-chain insertion between bp 8 and 9 by “cantilever” residue Ile-68 (triangle within DNA sequence at top) as demonstrated by intermolecular NOE contacts in the WT and variant domain-DNA complexes (see Fig. 7D).
FIGURE 7.
FIGURE 7.
1H NMR studies of the WT and variant SRY domain-DNA complexes. A, ribbon model of DNA-stabilized mini-core of the minor wing (upper box; Val-60 is shown in violet and Tyr-124 and Tyr-127 in gray) and key structural relationships in the major wing (bottom; Phe-109 in red and Trp-98 and Leu-101 in green). The trajectory of the DNA main chain is shown in blue. B, NMR features of the DNA-stabilized minor wing, complexation shifts and NOE contacts reflecting packing of the γ1-methyl group of Val-60 within the aromatic rings of His-120, Tyr-124, and Tyr-127, are essentially identical in the two complexes. A corresponding NMR signature of the DNA-stabilized major wing, upfield shift of the Leu-101 methyl resonances and NOEs to the Trp-98, is also similar. Box indicates NOEs between δ-methyl resonance of Ile-68 and adenine H2 protons of bp 8 and 9 in an expanded DNA minor groove. C, model of cantilever side chain Ile-68 (box position 13) inserting between successive AT bps in DNA target site (5′-ATTGTT-3 and complement; insertion site in bold). Portions of helices α1, α2, and α3 are shown as gold ribbons. DNA bp 8 and 9 are shown as sticks with following color code: gray, carbon; orange, phosphorus; red, oxygen; and blue, nitrogen. D, NOEs between the upfield-shifted δ-methyl resonance of Ile-68 and flanking imino protons of thymidines at bp 8 and 9. E, 1D 1H NMR aliphatic spectra of free domains (left) and specific DNA complexes (right). Overlay of 2D 1H-NOESY spectra of the WT domain-DNA complex (black) and variant complex (red). Coordinates for structural models were obtained from PDB code 1J46 (27).
FIGURE 8.
FIGURE 8.
F109S SRY exhibits accelerated proteasomal degradation irrespective of cellular context. A, upper box, expression of epitope-tagged WT SRY or variant SRY (v) in four cell lines as indicated. In each case expression of the variant is reduced. Gel represents a WB with anti-HA antiserum in single-well assays. A loading control was provided by α-tubulin (lower box). B, upper box, addition of proteasome inhibitor MG132 in each cell line rescue expression of epitope-tagged F109S SRY to a level similar to that of WT SRY in CH34 cells in the absence of MG132 (left-hand lane). WB employed anti-HA antiserum; loading-control α-tubulin is shown in lower box. C, cycloheximide assays in four cell lines as indicated. WBs exhibited similar time courses relative to α-tubulin. D, semilog plot of SRY expression as a function of time following cycloheximide arrest of translation: upper group, WT SRY; and lower group, F109S SRY (vertical brackets at right). Symbols are as defined at lower left: green ■, CH34 rat cells; ●, CH15 rat cells; ♦, Hs1.TES human cells; and ▴, HEK 293T human cells. Green line highlights data derived from CH34 cells as SRY-responsive model of the pre-Sertoli cell lineage (46). E, histogram showing half-lives of WT SRY (left) and F109S SRY (right) in each cell line. Statistical comparisons: *, Wilcox p values <0.05. Relative to α-tubulin, no significant differences were observed in the intracellular half-lives of WT SRY protein among the four cell lines and likewise for F109S SRY in the same cell lines. n.s., not significant.
FIGURE 9.
FIGURE 9.
F109S promotes ubiquitination but not default 20S proteolysis. A, pathway of ubiquitin-dependent 26S proteasomal degradation (42, 80, 82). Color code: azure, Ub; multicolor complex, 19S particle; blue and yellow, subunits of the 20S core proteasome. The protein substrate and its peptide fragments are shown in brown. B and C, representative anti-Ub Western blots pertaining to rat cell lines CH34 and CH15 (B) and human cell lines HEK 293T and Hs1.TES (C). Each panel contains the following: lanes 1 and 5, empty control; lanes 2 and 6, transient transfection of WT SRY; lanes 3 and 7, transient transfection of F109S SRY; lanes 4 and 8, transient transfection of control I68A SRY. WBs in lanes 1–4 were obtained in the absence of MG132; lanes 5–8 were obtained in the presence of MG132. In each case initial immunoprecipitation (IP) was effected by anti-HA beads. Three exposures are shown from top; below are shown anti-HA WBs as input controls (labeled IB: HA) and α-tubulin loading controls (bottom). Molecular weight markers are as shown at upper and lower left. Signal intensities were measured within red dashed boxes. D, histogram depicting relative extent of ubiquitination on MG132 treatment in each cell line: open bars, WT HA-tagged SRY; black bars, F109S HA-tagged SRY; and gray bars, I68A HA-tagged SRY. At bottom is given the number of biological replicates in each set. Statistical comparisons: * and **, Wilcox p values <0.05 and <0.01. E, pathway of default 20S proteasomal degradation (ubiquitin- and ATP-independent) (59, 80). F, representative Coomassie-stained SDS-polyacrylamide gels monitoring 20S-mediated core proteasomal degradation of isolated SRY HMG boxes (arrow at right; 86 residues) as a function of time: upper panel, WT domain; lower panel, F109S domain. G, quantitation of SDS-PAGE band intensity demonstrated no significant difference in initial rates of degradation. SDS-PAGE assays were conducted in triplicate. A and E were adapted from Ref. .
FIGURE 10.
FIGURE 10.
Epigenetic features of the Sox9 core enhancer (TESCO) correlate with SRY occupancy and specific transcriptional activity. A, histone marks in N-terminal arm of histone 3 (61): left, mono-, di-, and tri-methylation of Lys-4 (modifications me1, me2, or me3 in H3K4; shown in red, blue, and green, respectively). Fold-enrichment in TESCO (ChIP primer set a; see “Experimental Procedures”) was evaluated in untransfected cell lines CH34, CH15, Hs1.TES, and HEK 293T; middle, corresponding ChIP analysis of mono-, di-, and tri-methylation of Lys-9; right, ChIP analysis of mono- and tri-methylation of Lys-27. CH34 cells exhibited activating marks at H3K and H3K9 and reduction in repressive mark me3 at H3K9; the other three cell lines exhibited attenuated activating marks and repressive marks at H3K27. B, TESCO occupancy by WT HA-tagged SRY was selectively observed in CH34 cells (left-hand lane of gel with relative quantitation in histogram at right). Transfection conditions were “1×.” Primer sets a, b, and c were as defined by Sekido and Lovell-Badge (49) as homologous sets 4, 6, and 8 in mouse TES. Set b provided a negative control due to absence of specific SRY-binding sites. C, comparison of the relative TESCO occupancies of WT SRY and F109S SRY (variant, v) in CH34 cells. The variant exhibited 2-fold reduction in enhancer occupancy in the absence of MG132 but native occupancy on rescue of protein accumulation by MG132. Transfection conditions were 1×. Extent of attenuation in TESCO binding by F109S SRY is less marked under these conditions than its fold reduction in protein accumulation, reflecting baseline overexpression WT SRY under 1× transfection conditions. A negative control was provided by I68A SRY, which contains a substitution that blocks specific DNA binding (62). D, SRY-dependent transcriptional activation of Sox9 in CH34 cells. F109S SRY exhibited a 2-fold attenuation of Sox9 mRNA accumulation under both 1× and 50× transfection conditions (left- and right-hand histograms). This defect was mitigated by MG132 (blue labels). I68A SRY provided a negative control. E, analysis of SRY-stimulated Sox9 transcriptional activation at equal levels of expression of WT SRY and three variants: F109S, I68A, and G95R. Left, WB documenting equalization of WT and variant SRY accumulation by adjustment of plasmid dilution (see “Experimental Procedures”). α-Tubulin (middle panel) provided a loading control; GFP (bottom panel) mirrored extent of plasmid dilution and hence is strongest under 1× conditions (F109S), intermediate under 25× plasmid dilution, and weakest under 30× plasmid dilution. Right, histogram showing extent of Sox9 mRNA accumulation as stimulated by WT or variant SRY constructs, each at mean level of 105 protein molecules per transfected cell. I68A and G95R SRY variants provided negative controls, in each case due to impaired specific DNA binding (22, 62). Statistical comparisons: * and ** Wilcox p values <0.05 and <0.01, respectively, whereas “ns” indicates p values >0.05.
FIGURE 11.
FIGURE 11.
Control studies of off-target genes and nuclear localization in CH34 cells. A, transcriptional assays of selected genes activated by SRY variants in rat embryonic gonadal cell line. RT-Q-rt-PCR was employed to probe mRNA abundances of Sox family members uninvolved in testis development (left) and sex-unrelated housekeeping genes (right). qPCR was analyzed following transfection of SRY variant plasmids, empty vector, or control plasmid expressing a stable but inactive SRY variant (I68A); these genes were not affected by expression of transfected SRY. B and C, F109S does not perturb the nuclear localization of SRY in CH34 cells. B, subcellular localization of HA-tagged SRY variants: DAPI staining (blue, upper left), wild type or variants SRY staining (green, upper right), phalloidin staining for cytoskeletal (red, lower left), and the overly image (lower right). SRY variants: WT (panel a), F109S (panel b), I90M (positive control; panel c), and R62G (negative control; panel d). C, histograms describing the nuclear (light gray) and pan-cellular (white) distribution of SRY variants compared with that of wild type in the presence of proteasomal inhibitor, MG132. Statistical comparisons: **, Wilcox p values <0.01, whereas ns indicates p values > 0.05.
FIGURE 12.
FIGURE 12.
Patient pedigree and structural and sequence conservation of the aromatic at HMG consensus position 54. A, family trees pertaining to F109S SRY. Symbols are defined at right. The patient is one of five siblings. Two brothers and the parent uncle with F109S SRY gene are apparently normal. The patient was examined due to the primary amenorrhea. No signs of virilization. Streak gonads were detected, and the phenotypic phenomena of right streak gonad suggests the presence of gonadoblastoma. Cytogenetic studies suggest no evidence for mosaicism of the sex chromosomes. B, alignment of three different HMG domains; representative HMG boxes from architecture-specific (human HMB3 box 2, PDB code 2EQZ, magenta), mouse LEF-1 (PDB code 2LEF (111), dark gray), and human SRY (PDB code 1J46 (27), orange). Chain termini and α-helices are as labeled; the aromatic residue at consensus position 54 is shown as sticks. C, enlarged view of the crux of the angular DNA bending surface the consensus position 54 shown as sticks. The consensus positions of the remaining aromatic residues of the major hydrophobic core motif are labeled in green, which convene at the confluence of the three helices. D, sequence alignments of representative members of the HMG superfamily. Residues of the major core motif are highlighted by corresponding colored box, and consensus numbers are listed below alignments. Consensus positions 15 and 43 are boxed in green and the position 54 in red.

Comment in

  • The Fate of Sex: SRY on the Ridge.
    Gerhardt K. Gerhardt K. Biol Reprod. 2016 Nov;95(5):106. doi: 10.1095/biolreprod.116.145342. Epub 2016 Sep 28. Biol Reprod. 2016. PMID: 27856452 No abstract available.

References

    1. Atkinson M. R., Savageau M. A., Myers J. T., and Ninfa A. J. (2003) Development of genetic circuitry exhibiting toggle switch or oscillatory behavior in Escherichia coli. Cell 113, 597–607 - PubMed
    1. Johnson A. D., Poteete A. R., Lauer G., Sauer R. T., Ackers G. K., and Ptashne M. (1981) λ repressor and cro—components of an efficient molecular switch. Nature 294, 217–223 - PubMed
    1. Tian T., and Burrage K. (2006) Stochastic models for regulatory networks of the genetic toggle switch. Proc. Natl. Acad. Sci. U.S.A. 103, 8372–8377 - PMC - PubMed
    1. Ptashne M. (2004) A Genetic Switch: Phage λ Revisited, Cold Spring Harbor Laboratory Press, Cold Spring Harbor, NY
    1. Meyer B. J., Maurer R., and Ptashne M. (1980) Gene regulation at the right operator (O R) of bacteriophage λ: II. OR1, OR2, and OR3: Their roles in mediating the effects of repressor and cro. J. Mol. Biol. 139, 163–194 - PubMed

MeSH terms

LinkOut - more resources