. 2016 Aug 30;108(12):djw182.
doi: 10.1093/jnci/djw182. Print 2016 Dec.

IGF-1R and mTOR Blockade: Novel Resistance Mechanisms and Synergistic Drug Combinations for Ewing Sarcoma

Affiliations

IGF-1R and mTOR Blockade: Novel Resistance Mechanisms and Synergistic Drug Combinations for Ewing Sarcoma

Salah-Eddine Lamhamedi-Cherradi et al. J Natl Cancer Inst. .

Abstract

Background: Therapies cotargeting insulin-like growth factor receptor 1 (IGF-1R) and mammalian target of rapamycin (mTOR) have demonstrated remarkable, albeit short-lived, clinical responses in a subset of Ewing sarcoma (ES) patients. However, the mechanisms of resistance and applicable strategies for overcoming drug resistance to the IGF-1R/mTOR blockade are still undefined.

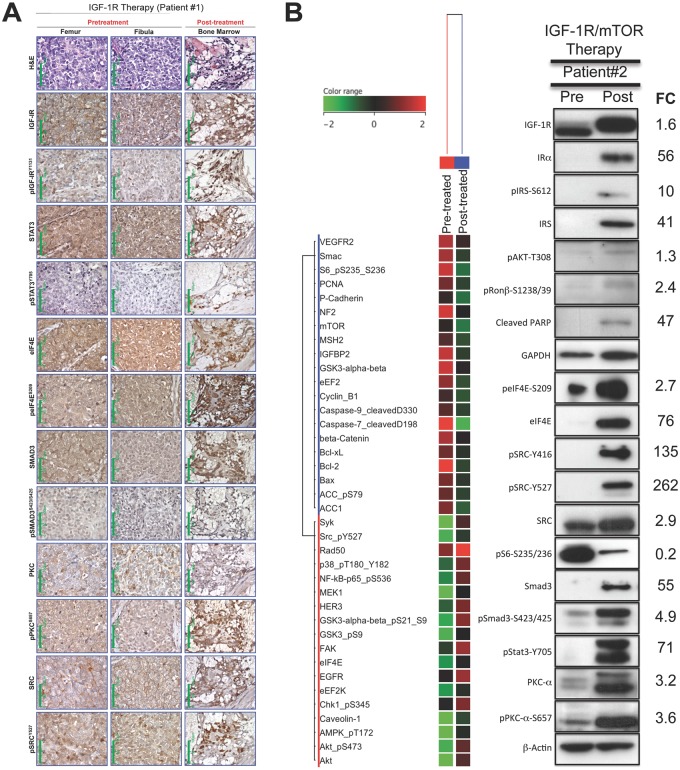
Methods: To elucidate predominant mechanism(s) of acquired drug resistance while identifying synergistic drug combinations that improve clinical efficacy, we generated more than 18 ES cell lines resistant to IGF-1R- or mTOR-targeted therapy. Two small-molecule inhibitors of IGF-1R were chosen, NVP-ADW-742 (IGF-1R-selective) and OSI-906 (a dual IGF-1R/insulin receptor alpha [IR-α] inhibitor). Reverse-phase protein lysate arrays (RPPAs) revealed proteomic changes linked to IGF-1R/mTOR resistance, and selected proteins were validated in cell-based assays, xenografts, and within human clinical samples. All statistical tests were two-sided.

Results: Novel mechanisms of resistance (MOR) emerged after dalotuzumab-, NVP-ADW-742-, and OSI-906-based targeting of IGF-1R. MOR to dalotuzumab included upregulation of IRS1, PI3K, and STAT3, as well as p38 MAPK, which was also induced by OSI-906. pEIF4E(Ser209), a key regulator of Cap-dependent translation, was induced in ridaforolimus-resistant ES cell lines. Unique drug combinations targeting IGF-1R and PI3K-alpha or Mnk and mTOR were synergistic in vivo and vitro (P < .001) as assessed respectively by Mantel-Cox and isobologram testing.

Conclusions: We discovered new druggable targets expressed by chemoresistant ES cells, xenografts, and relapsed human tumors. Joint suppression of these newfound targets, in concert with IGF-1R or mTOR blockade, should improve clinical outcomes.


Figures

Figure 1.
Figure 1.
Therapeutic effect of insulin-like growth factor receptor 1 (IGF-1R)/mammalian target of rapamycin (mTOR) blockade in Ewing sarcoma (ES) xenografts. Tumor-bearing mice volumes were reported after been treated with the IGF-1R mAb dalotuzumab (MK-0646, red), the mTORi ridaforolimus (MK-8669, blue), or both (Combination, green). The left panels show Kaplan-Meier curves and tumor growth delay times, and P values for differences between the treated and control mice were performed with the log-rank (Mantel-Cox) test; the middle panels show the smoothed grouped median relative tumor volumes; and the right panels show individual tumor volumes for selected EW5 (A) and TC71 (B) ES tumors. C) Temporary mTORi withdraw from EW5 xenografts treated with the IGF-1R inhibitor (IGF-1Ri)/mTOR inhibitor (mTORi) combination accelerated tumor growth. After 60 days post-treatment initiation, mTORi was temporarily withdrawn from treated mice with the IGF-1Ri/mTORi combination and restored when their tumor volume reached 200 to 250 mm3. The left panel shows individual tumor volumes, and the right panel shows the smoothed, grouped median relative tumor volumes.
Figure 2.
Figure 2.
Mechanisms of resistance and cell signaling pathway analyses following insulin-like growth factor receptor 1 inhibitors (IGF-1Ri) in Ewing sarcoma (ES) xenografts. MK-0646-induced downregulation of IGF-1R was validated in EW5 tumors (A) but not TC71 tumors (B). C) Normalized IGF-1R expression relative to β-actin in IGF-1Ri-treated and control xenografts with their respective unpaired two-tailed Student’s t test statistical analyses; bars show mean ± SD. D) Reverse-phase protein lysate array (RPPA) profiling of control (gray) and MK-0646-treated (red) EW5 tumors at the time when their volume reaches 1500 mm3 (GSE78123) identifies statistically significantly 13 proteins at a false discovery rate (FDR) of 0.2. Abbreviated gene of the indicated protein is provided in the Supplementary Table (available online) of proteins analyzed in RPPA. E) Immunoblot validation of proteins differentially identified by RPPA (Figure 2D) after β-actin normalization. The P values were derived from statistical analyses using the unpaired, two-tailed Student’s t test; bars show mean ± SD. F and G) In vivo combination of dalotuzumab and alpelisib synergistically repress ES cell growth. EW5 tumor–bearing mice volumes were reported after being treated with the IGF-1R mAb dalotuzumab (MK-0646, red), the PI3Kα inhibitor alpelisib (NVP-BYL719, brown), or both (Combination; green). The curves show individual tumor volumes (F) and smoothed, grouped median relative tumor volumes (G). H) Ingenuity pathway analysis following dalotuzumab of EW5 tumors using a Fisher’s exact test with a fold-change greater than 1.5 and a P value of less than .05 showed the top 10 selected pathways. The bar chart displays the percentages of biomarkers. I) Microarray gene expression analysis between control- and dalotuzumab-treated EW5 xenografts (GSE67529) identifies statistically significantly 173 genes and expressed sequence tags (EST) at an FDR of 0.17 and a P value cutoff of .002. IGF-1R = insulin-like growth factor 1 receptor.
Figure 3.
Figure 3.
Ewing sarcoma (ES) in vitro resistance to OSI-906 and NVP-ADW-742. Stable, drug-resistant clones (colored lines) were derived from parental cell lines that were exposed to high concentrations of OSI-906 (A) or NVP-ADW-742 (B). Cell proliferation assay after 72 hours of exposure to insulin-like growth factor receptor 1 inhibitor (IGF-1Ri). The IC50 values of each drug-sensitive parental and selected IGF-1R-resistant cell lines are also shown. C and D) Validation of ES cell drug resistance to OSI-906 (C) or NVP-ADW-742 (D) after two weeks’ exposure using colony formation assay. Curves and columns represent the mean values of three independent experiments, and bars represent standard deviations. IC50 = half maximal inhibitory concentration.
Figure 4.
Figure 4.
Synergistic effects of OSI-906 and dasatinib in Ewing sarcoma (ES) cell lines. A) Reverse-phase protein lysate array (RPPA) analysis of ES cell lines sensitive (parental) or resistant to OSI-906 and NVP-ADW-742 separated the 25 samples into three groups (columns) and identified 17 proteins statistically significantly associated with the treatment at a false discovery rate (FDR) of 0.05 (GSE78121). B) Immunoblotting validation of the differentially expressed proteins identified by RPPA in (A). C) RPPA analysis of OSI-906-sensitive and -resistant ES cell lines separated the 16 samples into three groups (columns) and identified 25 proteins statistically significantly associated with the treatment at an FDR of 0.1 (GSE78121). D) Immunoblotting validation of the differentially expressed proteins identified by RPPA in (C). E) RPPA analysis of OSI-906- and NVP-ADW-742-resistant ES cell lines identified nine proteins statistically significantly associated with the treatment at an FDR of 0.3 (GSE78121). F) Immunoblotting validation of the differentially expressed proteins identified by RPPA in (E). All the RPPA analysis of ES cell lines sensitive or resistant to insulin-like growth factor receptor 1 inhibitors were performed with an unsupervised hierarchical clustering using the Euclidian distance between proteins (rows) and Ward’s linkage clustering method. Abbreviated gene of the indicated protein is provided in the Supplementary Table (available online) of proteins analyzed in RPPA. G) Isobologram analysis showed a synergistic inhibition of parental sensitive TC71 ES cell proliferation after in vitro combination of OSI-906 and dasatinib. Combination index (CI) values are given for each ratio, with synergism < 1, additivity = 1, and antagonism > 1. H) Heat map summarizing the in vitro dose response effect of OSI-906 and/or dasatinib in the TC71 ES cell proliferation. The data are the mean of nine replicates from three different experiments.
Figure 5.
Figure 5.
Efficacy of mammalian target of rapamycin inhibitor (mTORi) and mitogen-activated protein kinase–interacting protein kinase inhibitor (Mnki) in Ewing sarcoma (ES) cells and xenografts. A) Proteomic analysis of sensitive and resistant ES cell lines to ridaforolimus (MK-8669). Reverse-phase protein lysate array (RPPA) analysis of ES cell lines sensitive and resistant to ridaforolimus. Unsupervised hierarchical clustering separated the 13 samples into three groups of cell lines (columns) and identified 34 proteins (rows) statistically significantly associated with the treatment at a false discovery rate of 0.002 (GSE78122). B) Immunoblotting validation of the differentially expressed proteins identified by RPPA in (A). Abbreviated gene of the indicated protein is provided in the Supplementary Table (available online) of proteins analyzed in RPPA. C) Signal integration between Mnk and insulin-like growth factor receptor 1/mTOR pathways describing the identified mechanism of resistance to mTORi and possible targeted therapies to overcome this resistance. D) Isobologram analysis showed that mTORi and Mnki are synergistic in inhibiting parental sensitive TC71 ES cell proliferation. Combination index (CI) values are given for each ratio, with synergism < 1, additivity = 1, and antagonism > 1. E) Heat map summarizing the in vitro dose response effect of ridaforolimus and/or CGP57380 in the TC71 ES cell proliferation. The data are the mean of nine replicates from three different experiments. F) EW5 tumor-bearing mice volumes were reported after being treated with the mTORi ridaforolimus (MK-8669, blue), the Mnk inhibitor (CGP57380, brown), or both (Combination, green). The curves show smoothed, grouped median relative tumor volumes. EIF4E-S209 = eukaryotic translation initiation factor 4E; ERK = extracellular signal-regulated kinase; IGF-1Ri = insulin-like growth factor 1 receptor inhibitor; MAPK = mitogen-activated protein kinase; MEK inhibitor = MAPK/ERK kinase inhibitor; Mnki = MAPK-interacting protein kinase inhibitor; mTORi = mammalian target of rapamycin inhibitor.
Figure 6.
Figure 6.
Unique in vivo mechanisms of resistance to insulin-like growth factor receptor 1 (IGF-1R)/mammalian target of rapamycin (mTOR) blockade. A) Reverse-phase protein lysate array (RPPA)–based proteomic analysis of EW5 Ewing sarcoma (ES)–sensitive xenograft tumors after three days of IGF-R inhibitor (IGF-1Ri), mTOR inhibitor (mTORi), or combination treatments. B) RPPA analysis of EW5 tumors after 75 days of treatment (or sooner if they reached 1500 mm3) with unsupervised double hierarchical clustering that separated the 17 samples into four treatment groups (columns) and identified 25 proteins that are differentially expressed among the four treatment conditions at a false discovery rate (FDR) of 0.05 (GSE78123). Abbreviated gene of the indicated protein is provided in the Supplementary Table (available online) of proteins analyzed in RPPA. C-F) Immunoblotting validation of the proteins after β-actin normalization that are: (C) unaffected by treatment with IGF-1Ri or mTORi alone but statistically significantly downregulated by IGF-1Ri plus mTORi (cluster A in panel B) and inhibited by IGF-1Ri alone or combination but not by mTORi (cluster B in panel B), (D) inhibited by mTORi alone but not by IGF-1Ri (cluster C in panel B), (E) markedly upregulated following treatment with IGF-1Ri/mTORi and that might be potential biomarkers of resistance to this combined treatment (cluster D in panel B), and (F) differentially expressed among all groups of treated xenografts according to the unsupervised double hierarchical clustering analysis illustrated in (B) but with a lower FDR of 0.07 and a P value cutoff of .039; bars show mean ± SD.
Figure 7.
Figure 7.
Insulin-like growth factor receptor 1 (IGF-1R)– and mammalian target of rapamycin (mTOR)–induced alterations upon the canonical IGF-1R signaling cascade, mitogen-activated protein kinase (MAPK) and receptor tyrosine kinase RTKs in Ewing sarcoma (ES). Average expression of teverse-phase protein lysate array (RPPA) data extracted from EW5 xenograft tumors treated with IGF-1R/mTOR blockade (Figure 6B) have been mapped onto manually curated canonical signaling cascades. The IGF-1R/PI3K/AKT/mTORC1 pathway, which is constitutively active in ES, is highly active in xenograft-control states. Blockade of IGF-1R (second column) or mTOR (third column), respectively, induced cross-resistance by either upregulating pIR-α or maintaining the enhanced activation of downstream oncogenic proteins such as PI3K, AKT, or eIF4E. The IGF-1R/mTOR blockade (Combination, fourth column) statistically significantly inhibited the IGF-1R/mTOR pathway, with prominent effects on IRS1, pPI3K, pAkt, p4EBP1, pS6, and others. The blockade of either IGF-1R or mTOR maintained MAPK pathway signaling levels, which were similar to those of the control group; the blockade of both IGF-1R and mTOR led to greater MEK1/2 inhibition, with the exception of pSRC-Y416. The IGF-1Ri–mTORi combination inhibited several RTKs that are frequently activated in other cancer types, including c-Kit, HER3, and epidermal growth factor receptor (EGFR); however, this treatment upregulated estrogen receptor (ER)-α. Key proteins that were not present in the RPPA or immunoblot panels are given in bold text only. pIR proteins were present in the immunoblot analyses (Figure 6F; Supplementary Figure 7, available online) and are represented here accordantly. Abbreviated gene of the indicated protein is provided in the Supplementary Table (available online) of proteins analyzed in RPPA.
Figure 8.
Figure 8.
Clinical validation for biomarker of resistance to insulin-like growth factor receptor 1 inhibitor (IGF-1Ri)/mammalian target of rapamycin inhibitor (mTORi) in relapsed Ewing sarcoma (ES) tumor patients. A) Histological and immunohistochemical evaluations of relapsed ES patient tumor before and after IGF-1R therapy. Hematoxylin and eosin (H&E)–stained tumor sections from the first (left femur) and second (left fibula) pretreated specimens. The H&E stain of the bone marrow post-treated specimen showed almost complete lack of normal hematopoietic cellular elements and, instead, interstitial infiltration by small ES cells with a high N:C ratio. Immunohistochemical staining showed that after treatment there was remarkable upregulation of pIGF-IR, pSTAT3, and peIF4E and a moderate increase in the expression of pSMAD3 as compared with the pretreated specimens. Original magnification is × 400; 100 μm scale bars are shown. B) Reverse-phase protein lysate array (RPPA) and immunoblotting evaluations of relapsed ES patient tumor before (lung) and after (lung) IGF-1R/mTOR therapies obtained less than one week after the IGF-1Ri/mTORi drug combination was discontinued secondary to tumor progression. IGF-1R, Stat3, eIF4E, and Smad3, putative biomarkers of resistance to IGF-1R or/and mTOR blockades were highly expressed within post-treated ES patient tumor that had a near-complete response to combined IGF-1Ri and mTORi. Abbreviated gene of the indicated protein is provided in the Supplementary Table (available online) of proteins analyzed in RPPA. FC = fold-change; IGF-1R = insulin-like growth factor 1 receptor; mTOR = mammalian target of rapamycin.

Similar articles

Cited by

References

    1. Tomazou EM, Sheffield NC, Schmidl C, et al. Epigenome mapping reveals distinct modes of gene regulation and widespread enhancer reprogramming by the oncogenic fusion protein EWS-FLI1. Cell Rep. 2015;10(7):1082–1095. - PMC - PubMed
    1. Moore JBt, Loeb DM, Hong KU, et al. Epigenetic reprogramming and re-differentiation of a Ewing sarcoma cell line. Front Cell Dev Biol. 2015;3:15. - PMC - PubMed
    1. Riggi N, Knoechel B, Gillespie SM, et al. EWS-FLI1 utilizes divergent chromatin remodeling mechanisms to directly activate or repress enhancer elements in Ewing sarcoma. Cancer Cell. 2014;26(5):668–681. - PMC - PubMed
    1. Kolb EA, Gorlick R. Development of IGF-IR Inhibitors in Pediatric Sarcomas. Curr Oncol Rep. 2009;11(4):307–313. - PubMed
    1. Tolcher AW, Sarantopoulos J, Patnaik A, et al. Phase I, pharmacokinetic, and pharmacodynamic study of AMG 479, a fully human monoclonal antibody to insulin-like growth factor receptor 1. J Clin Oncol. 2009;27(34):5800–5807. - PubMed

MeSH terms

Substances