

Pre-B-cell colony-enhancing factor protects against apoptotic neuronal death and mitochondrial damage in ischemia
- PMID: 27576732
- PMCID: PMC5006239
- DOI: 10.1038/srep32416
Pre-B-cell colony-enhancing factor protects against apoptotic neuronal death and mitochondrial damage in ischemia
Abstract
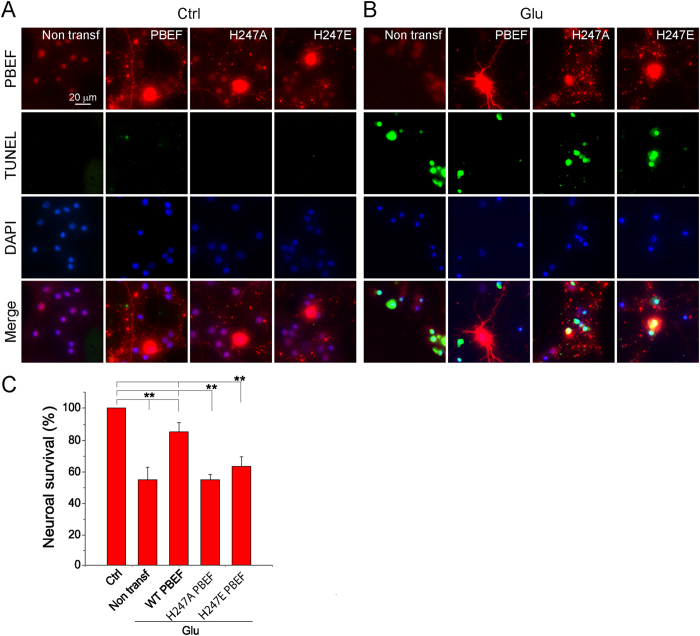
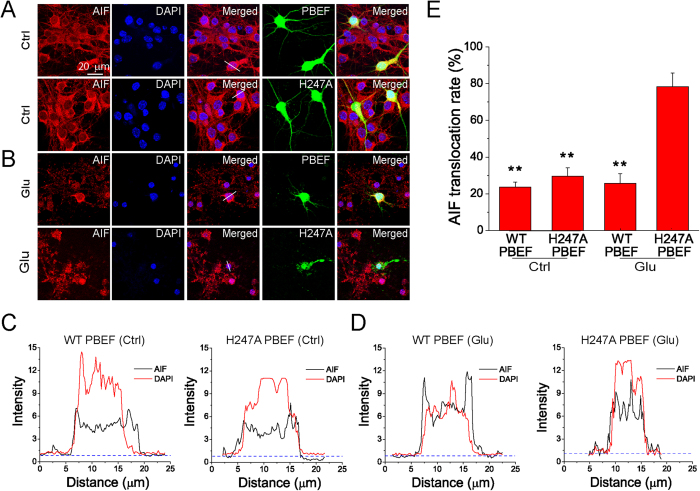
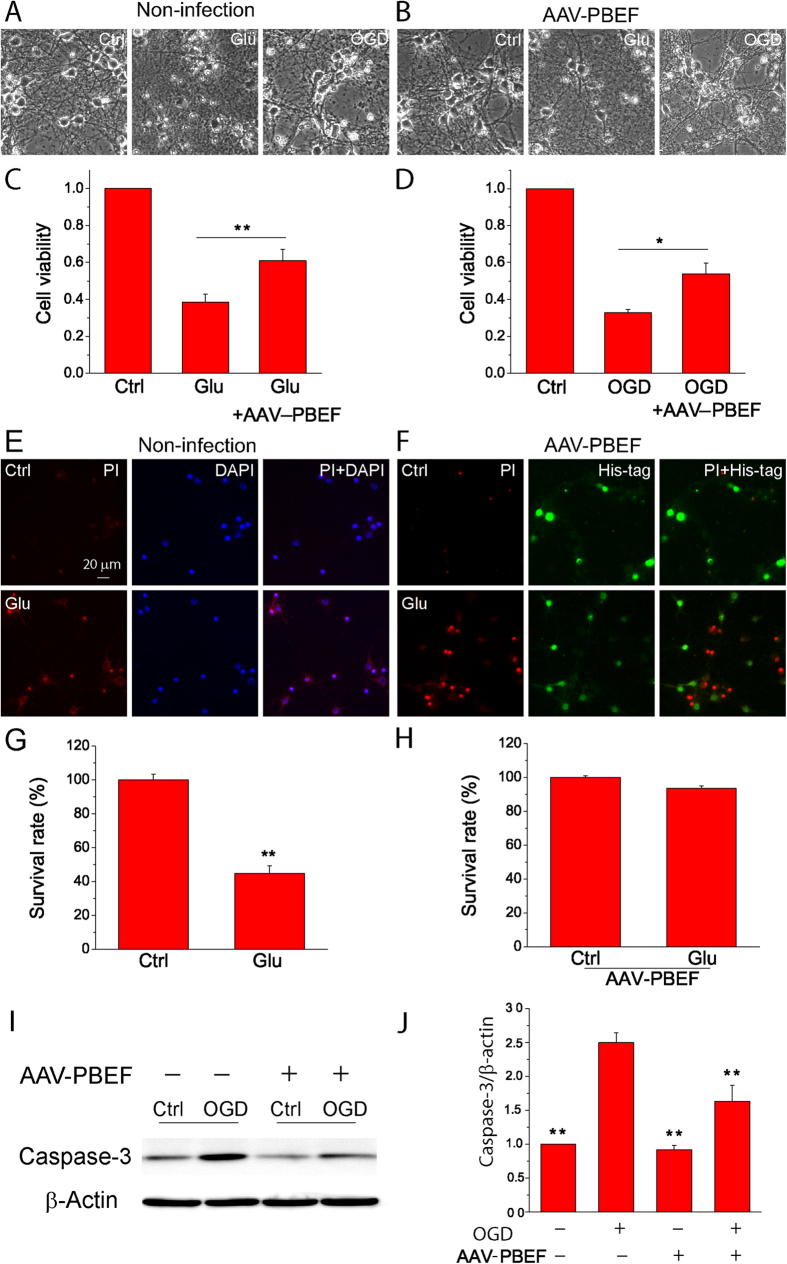
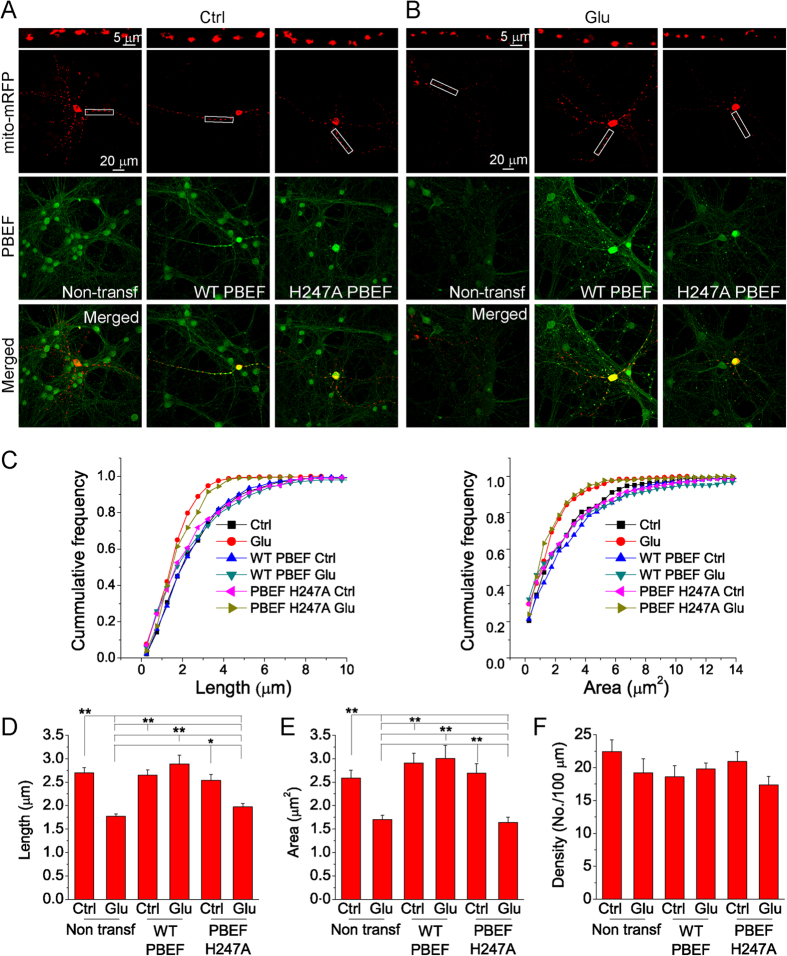
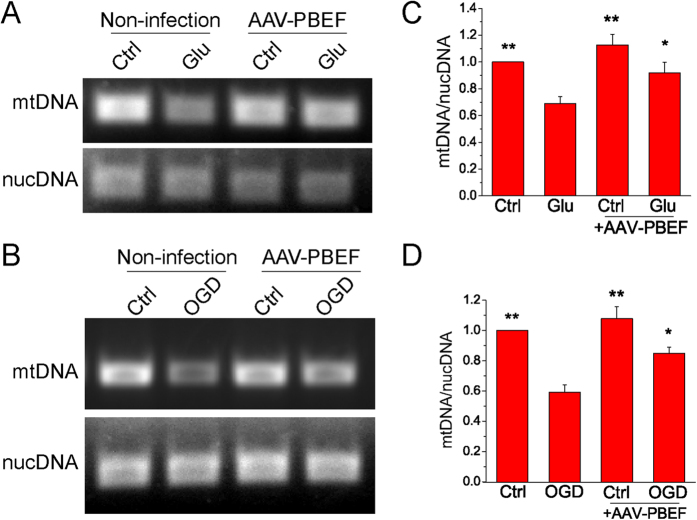
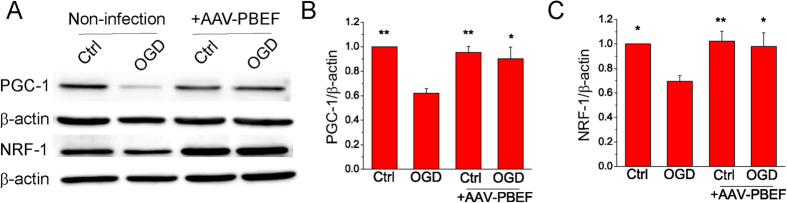
We previously demonstrated that Pre-B-cell colony-enhancing factor (PBEF), also known as nicotinamide phosphoribosyltransferase (NAMPT), the rate-limiting enzyme in mammalian NAD(+) biosynthesis pathway, plays a brain and neuronal protective role in ischemic stroke. In this study, we further investigated the mechanism of its neuroprotective effect after ischemia in the primary cultured mouse cortical neurons. Using apoptotic cell death assay, fluorescent imaging, molecular biology, mitochondrial biogenesis measurements and Western blotting analysis, our results show that the overexpression of PBEF in neurons can significantly promote neuronal survival, reduce the translocation of apoptosis inducing factor (AIF) from mitochondria to nuclei and inhibit the activation of capase-3 after glutamate-induced excitotoxicity. We further found that the overexpression of PBEF can suppress glutamate-induced mitochondrial fragmentation, the loss of mitochondrial DNA (mtDNA) content and the reduction of PGC-1 and NRF-1 expressions. Furthermore, these beneficial effects by PBEF are dependent on its enzymatic activity of NAD(+) synthesis. In summary, our study demonstrated that PBEF ameliorates ischemia-induced neuronal death through inhibiting caspase-dependent and independent apoptotic signaling pathways and suppressing mitochondrial damage and dysfunction. Our study provides novel insights into the mechanisms underlying the neuroprotective effect of PBEF, and helps to identify potential targets for ischemic stroke therapy.
Figures
Similar articles
-
Subcellular NAMPT-mediated NAD+ salvage pathways and their roles in bioenergetics and neuronal protection after ischemic injury.J Neurochem. 2019 Dec;151(6):732-748. doi: 10.1111/jnc.14878. Epub 2019 Oct 16. J Neurochem. 2019. PMID: 31553812 Free PMC article.
-
Pre-B-cell colony-enhancing factor exerts a neuronal protection through its enzymatic activity and the reduction of mitochondrial dysfunction in in vitro ischemic models.J Neurochem. 2012 Jan;120(2):334-46. doi: 10.1111/j.1471-4159.2011.07566.x. Epub 2011 Nov 24. J Neurochem. 2012. PMID: 22044451 Free PMC article.
-
Neuronal protective role of PBEF in a mouse model of cerebral ischemia.J Cereb Blood Flow Metab. 2010 Dec;30(12):1962-71. doi: 10.1038/jcbfm.2010.71. Epub 2010 May 19. J Cereb Blood Flow Metab. 2010. PMID: 20485294 Free PMC article.
-
Apoptotic and antiapoptotic mechanisms in stroke.Cell Tissue Res. 2000 Jul;301(1):173-87. doi: 10.1007/s004419900154. Cell Tissue Res. 2000. PMID: 10928290 Review.
-
Pre-B cell colony-enhancing factor (PBEF)/visfatin: a novel mediator of innate immunity.J Leukoc Biol. 2008 Apr;83(4):804-16. doi: 10.1189/jlb.0807581. Epub 2008 Feb 5. J Leukoc Biol. 2008. PMID: 18252866 Review.
Cited by
-
Evaluation of the NAD+ biosynthetic pathway in ALS patients and effect of modulating NAD+ levels in hSOD1-linked ALS mouse models.Exp Neurol. 2020 May;327:113219. doi: 10.1016/j.expneurol.2020.113219. Epub 2020 Jan 31. Exp Neurol. 2020. PMID: 32014438 Free PMC article.
-
Nicotinamide phosphoribosyltransferase in NAD+ metabolism: physiological and pathophysiological implications.Cell Death Discov. 2025 Aug 8;11(1):371. doi: 10.1038/s41420-025-02672-w. Cell Death Discov. 2025. PMID: 40775221 Free PMC article. Review.
-
Metabolomic and transcriptional profiling reveals bioenergetic stress and activation of cell death and inflammatory pathways in vivo after neuronal deletion of NAMPT.J Cereb Blood Flow Metab. 2021 Aug;41(8):2116-2131. doi: 10.1177/0271678X21992625. Epub 2021 Feb 9. J Cereb Blood Flow Metab. 2021. PMID: 33563078 Free PMC article.
-
Astroglia Abnormalities in Post-stroke Mood Disorders.Adv Neurobiol. 2021;26:115-138. doi: 10.1007/978-3-030-77375-5_6. Adv Neurobiol. 2021. PMID: 34888833 Free PMC article. Review.
-
Subcellular NAMPT-mediated NAD+ salvage pathways and their roles in bioenergetics and neuronal protection after ischemic injury.J Neurochem. 2019 Dec;151(6):732-748. doi: 10.1111/jnc.14878. Epub 2019 Oct 16. J Neurochem. 2019. PMID: 31553812 Free PMC article.
References
-
- Dirnagl U., Iadecola C. & Moskowitz M. A. Pathobiology of ischaemic stroke: an integrated view. Trends Neurosci 22, 391–397 (1999). - PubMed
-
- Luk T., Malam Z. & Marshall J. C. Pre-B cell colony-enhancing factor (PBEF)/visfatin: a novel mediator of innate immunity. J Leukoc Biol 83, 804–816 (2008). - PubMed
-
- Dahl T. B., Holm S., Aukrust P. & Halvorsen B. Visfatin/NAMPT: A Multifaceted Molecule with Diverse Roles in Physiology and Pathophysiology. Annu. Rev. Nutr. 32, 229–243 (2012). - PubMed
-
- Revollo J. R. et al.. The regulation of nicotinamide adenine dinucleotide biosynthesis by Nampt/PBEF/visfatin in mammals. [Review] [85 refs]. Current Opinion in Gastroenterology 23, 164–170 (2007). - PubMed
Publication types
MeSH terms
Substances
Grants and funding
LinkOut - more resources
Full Text Sources
Other Literature Sources
Medical
Miscellaneous
