. 2017 Feb 1;19(2):229-241.
doi: 10.1093/neuonc/now164.

A novel 3D human glioblastoma cell culture system for modeling drug and radiation responses

Affiliations

A novel 3D human glioblastoma cell culture system for modeling drug and radiation responses

Natividad Gomez-Roman et al. Neuro Oncol. .

Abstract

Background: Glioblastoma (GBM) is the most common primary brain tumor, with dismal prognosis. The failure of drug-radiation combinations with promising preclinical data to translate into effective clinical treatments may relate to the use of simplified 2-dimensional in vitro GBM cultures.

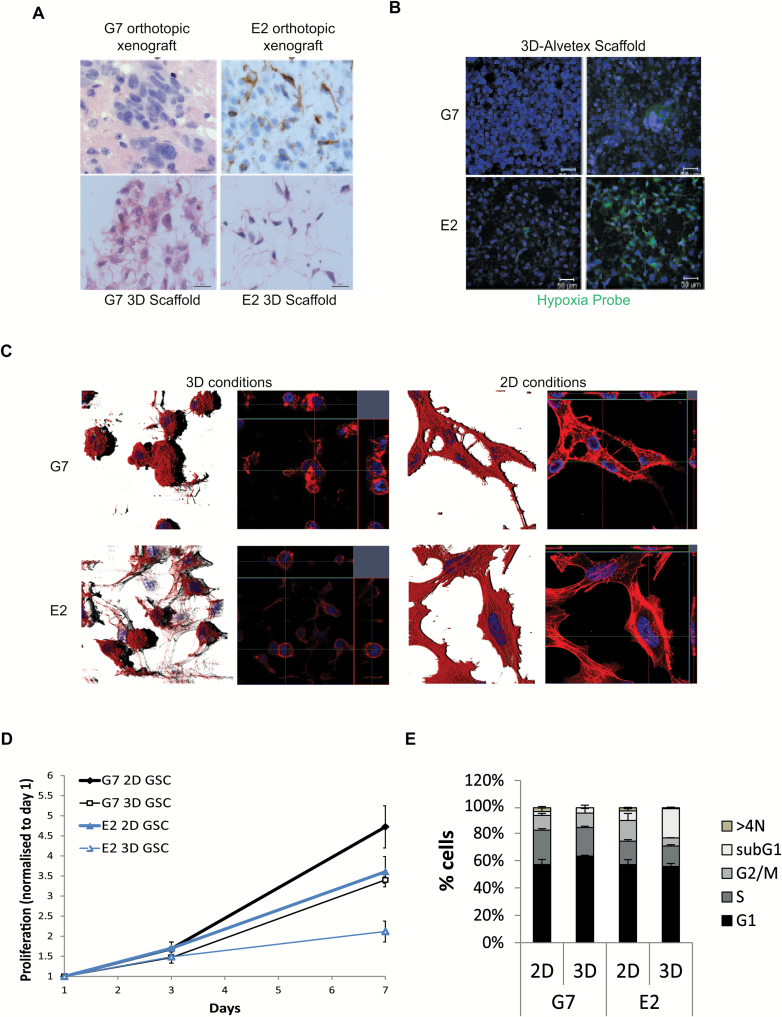
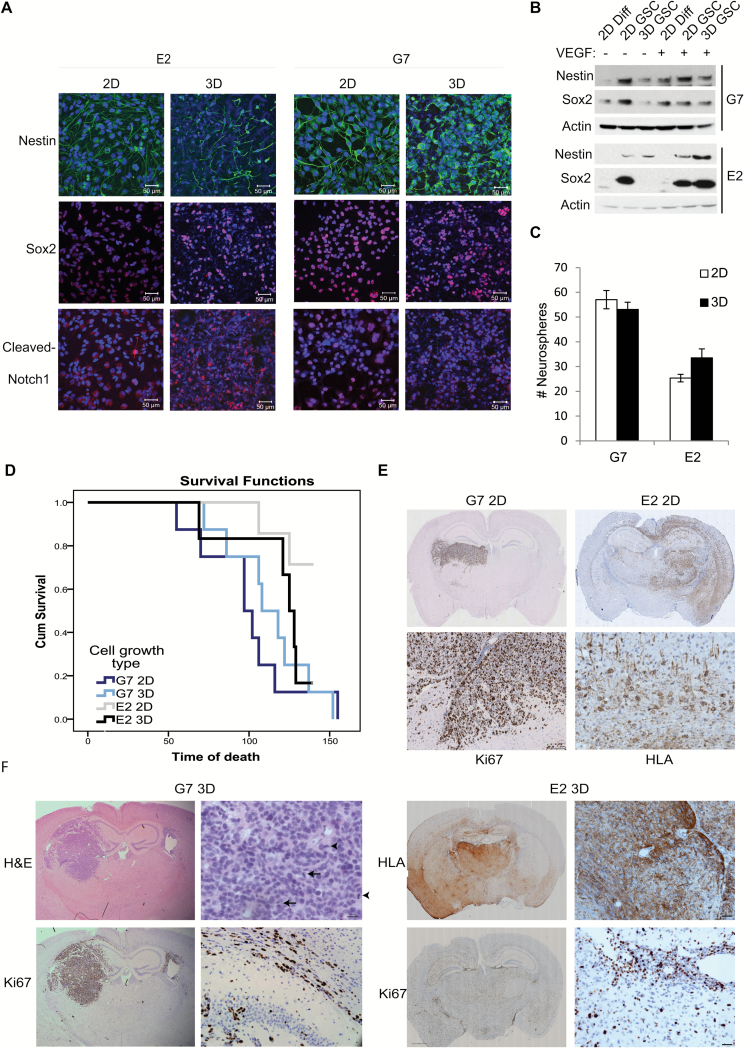
Methods: We developed a customized 3D GBM culture system based on a polystyrene scaffold (Alvetex) that recapitulates key histological features of GBM and compared it with conventional 2D cultures with respect to their response to radiation and to molecular targeted agents for which clinical data are available.

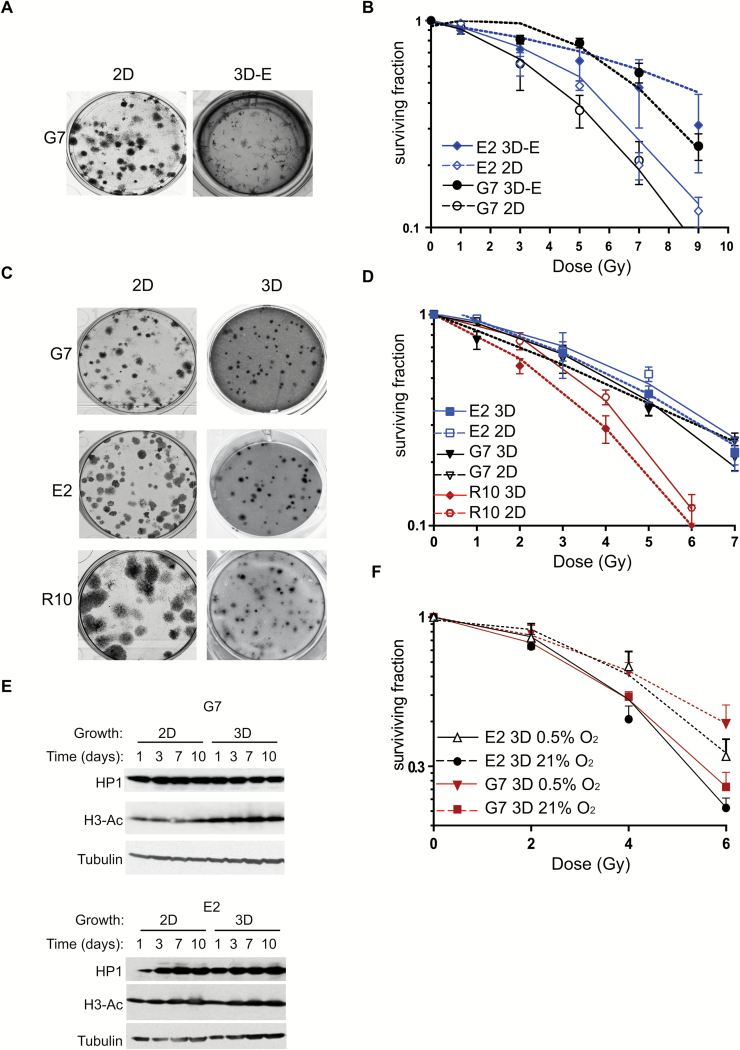
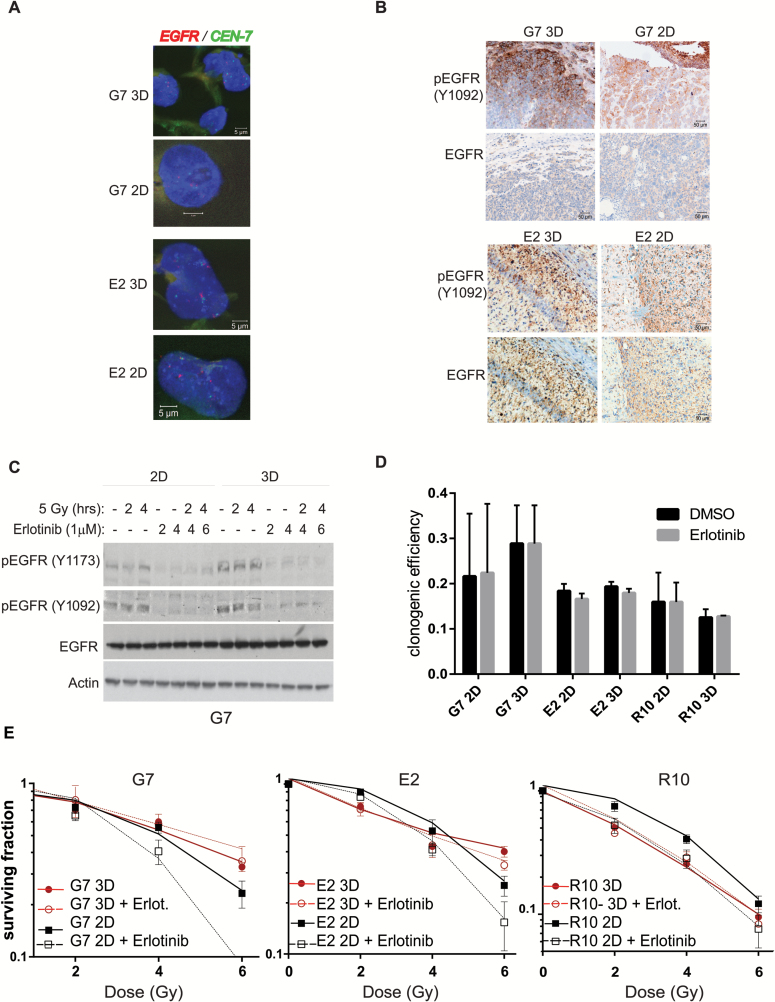
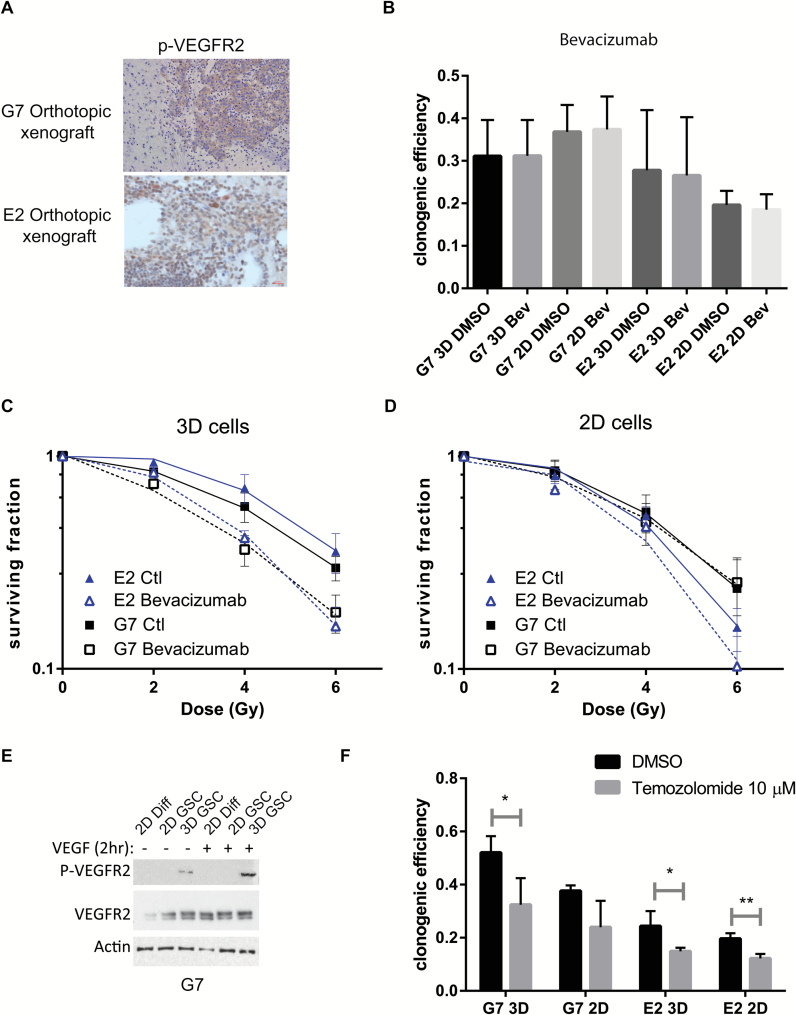
Results: In 3 patient-derived GBM lines, no difference in radiation sensitivity was observed between 2D and 3D cultures, as measured by clonogenic survival. Three different molecular targeted agents, for which robust clinical data are available were evaluated in 2D and 3D conditions: (i) temozolomide, which improves overall survival and is standard of care for GBM, exhibited statistically significant effects on clonogenic survival in both patient-derived cell lines when evaluated in the 3D model compared with only one cell line in 2D cells; (ii) bevacizumab, which has been shown to increase progression-free survival when added to standard chemoradiation in phase III clinical trials, exhibited marked radiosensitizing activity in our 3D model but had no effect on 2D cells; and (iii) erlotinib, which had no efficacy in clinical trials, displayed no activity in our 3D GBM model, but radiosensitized 2D cells.

Conclusions: Our 3D model reliably predicted clinical efficacy, strongly supporting its clinical relevance and potential value in preclinical evaluation of drug-radiation combinations for GBM.

Keywords: VEGF; erlotinib; glioblastoma; glioma stemlike cells; ionizing radiation; three-dimensional.


Figures

Fig. 1
Fig. 1
Characterization of GSC grown in 3D conditions. (A) Representative hematoxylin and eosin and human leukocyte antigen images of orthotopic tumors derived from intracranially injected G7 or E2 cells, respectively, and G7 or E2 cells grown on 3D-Alvetex scaffolds. (B) GSCs were grown in Alvetex scaffolds and incubated with pimonidazole one hour prior to fixation (2% paraformaldehyde). Scaffolds were immunostained using an anti-pimonidazole antibody (green) and counterstained with DAPI (blue). Two representative images of 3D cultures are shown for each cell line. (C) Immunofluorescent images of F-actin (Alexa Fluor 568 Phalloidin, red) and nuclear staining (DAPI; blue) of cells in 3D and 2D GSC conditions. (D) G7 and E2 GSC (5x10⁴) were seeded in 12-well Alvetex scaffolds or in T25 flasks and proliferation of 2D and 3D cultured cells measured according to Alvetex scaffolds MTT viability assay instructions (http://reinnervate.com/using-alvetex/workflow-2-culturing-monitoring-3d-cell-growth/). Graph of mean±SD (n = 3). Statistical significance is observed in both cell lines at day 7 (t-test, P<.005). (E) Cell cycle distribution of GSC cultured in 2D or 3D conditions for 24 hours and analyzed by flow cytometry after propidium iodide staining (n = 3). Graph of mean±SEM (n = 3).
Fig. 2
Fig. 2
GSCs grown on 3D conditions retain their stemness and tumorigenicity. (A, B) Immunofluorescent images (A, scale bar 50 µm) and western blot analysis (B) of E2 and G7 GSCs grown on 2D or 3D conditions of stem cell marker expression. (C) Neurosphere formation assays for G7 and E2 GSC previously grown for 7 days in 2D or 3D stem cell conditions. Mean values ±SEM (n = 3). (D) Kaplan–Meier survival curves showing overall survival of individual cohorts of mice orthotopically injected with G7 and E2 cells grown on 2D or 3D conditions. Pairwise comparisons using log rank (Mantel–Cox) analysis: E2 2D versus E2 3D cells P = .082; G7 2D versus 3D cells P = .519. (E and F) Hematoxylin and eosin, Ki67, and human leukocyte antigen (HLA) immunohistochemistry of paraffin-embedded brain sections containing orthotopic tumors derived from intracranially injected G7 cells or E2 cells grown in 2D conditions (E) or 3D conditions (F) for 7 days prior to injection (n = 8). → indicates mitotic bodies.
Fig. 3
Fig. 3
Radiation responses of GSC in 2D and 3D conditions. (A, C) Representative images of GSC colonies after 21 days growing on plastic (2D), embedded in Matrigel (3D-E, A) or in 3D-Alvetex scaffolds (3D, C). (B, D) Clonogenic survival curves of G7 and E2 cells grown in 2D and 3D-E (B) or 2D and 3D-Alvetex scaffold conditions (D) and irradiated with single doses of X-rays (0–9 Gy; n = 3). Curves are significantly different in (B) for both cell lines by 2-way ANOVA (2D vs 3D-E P < .0001, calculated by ANOVA general linear model. No statistical significance was observed for 2D versus 3D G7 (P = .1) or E2 (P = .1) data in (D). R10 3D cultures were significantly more radiosensitive than 2D cultures (P = .01). (E) Western blot analysis of G7 and E2 cell lysates extracted from cells grown in 2D or 3D. (F) Clonogenic survival curves as (D). Hypoxic cultures of both G7 and E2 GSCs are significantly more resistant than normoxic cultures (2-way ANOVA analysis; P = .0021 and P = .0004, respectively).
Fig. 4
Fig. 4
Radiosensitization of GSCs by EGFR inhibition is determined by growth conditions. (A) Representative immunofluorescence images of EGFR gene (green) and chromosome 7 centromere (red) staining by FISH assay in G7 and E2 2D and 3D GSC. Nonnuclear staining reflects background autofluorescence. (B) Representative immunohistochemistry images of phosphorylated and total EGFR in G7 and E2 orthotopic tumors from cells grown on 3D or 2D conditions for 7 days. (C) Protein extracts of G7 GSCs grown in 2D or 3D conditions obtained at different time points after treatment with erlotinib (1 µM) and/or ionizing radiation (5 Gy) were analyzed for total and phosphorylated EGFR by western blot. Actin served as loading control. (D) Clonogenic survival efficiency of G7, E2, and R10 cells treated with either vehicle (dimethyl sulfoxide [DMSO]) or erlotinib (1 µM) 20 hours following seeding and left for the duration of the experiment (18 days). Graph depicts mean±SD. (E) Clonogenic survival of G7, E2, and R10 cells grown in 2D and 3D conditions and irradiated with single doses of X-rays (0–6 Gy; n = 3) 2 hours after treatment with erlotinib (1 µM) or DMSO. Erlotinib treatment significantly increased the radiosensitivity of G7, E2, and R10 GSCs under 2D conditions (ANOVA; P < .0001, P = .0006, and P = .0016, respectively). No effect of erlotinib was observed in 3D conditions compared with DMSO (G7 P = .1; E2 P = .1007 and R10 P = .842).
Fig. 5
Fig. 5
Radiosensitization of GSCs by bevacizumab and temozolomide is determined by growth conditions. (A) Representative immunohistochemistry images of phospho-VEGFR2 in G7 and E2 orthotopic tumors grown from 3D GSC. (B) Clonogenic survival efficiency of G7 and E2 cells treated with either vehicle (PBS) or bevacizumab (0.1 µg/mL) 20 hours following seeding and left for the duration of the experiment (18 days). Graph depicts mean±SD. (C and D) Clonogenic survival of G7, E2, and R10 cells grown in 3D (C) and 2D (D) conditions and irradiated with single doses of X-rays (0–6 Gy; n = 3) 2 hours after treatment with bevacizumab (0.1 µg/ mL) or vehicle (PBS). Bevacizumab treatment significantly increased the radiosensitivity of G7 and E2 GSCs under 3D conditions (ANOVA; control vs bevacizumab P < .01 and P < .05, respectively). (E) Protein extracts of G7 GSCs grown in 2D or 3D conditions in the absence or presence of VEGF-A (30ng/mL) were analyzed for total and phospho-VEGFR2 by western blot. (F) Clonogenic survival efficiency of G7 and E2 cells treated with either vehicle (dimethyl sulfoxide; DMSO) or temozolomide (10 µM) as in (B). Statistical significance (t-test) *P < .05, **P < 0.05.
Fig. 6
Fig. 6
RNA-seq analysis of 3D versus 2D GSC cultures. (A) Gene ontology (GO) analysis of transcripts significantly upregulated in the 3D model in both G7 and E2 cultures. GO of molecular function (upper chart) and cellular components (lower chart) are represented. (B) Bar charts representing differentially expressed genes in 3D compared with 2D G7 and E2 cells within the cytoskeleton, extracellular matrix region, and receptor activity categories. (C) Real-time PCR validation of representative genes upregulated in the 3D GBM model. Bars represent mean±SD of cDNA expression from 3 independent experiments performed in duplicate. t-Test *P < .05; **P < .005. (D) Immunofluorescent images of vimentin (upper panel) and glial fibrillary acidic protein (lower panel) of G7 cells grown in either 2D or 3D conditions.

References

    1. Stupp R, Mason WP, van den Bent MJ, et al. Radiotherapy plus concomitant and adjuvant temozolomide for glioblastoma. New Engl J Med. 2005;352(10):987–996. - PubMed
    1. Bao S, Wu Q, McLendon RE, et al. Glioma stem cells promote radioresistance by preferential activation of the DNA damage response. Nature. 2006;444(7120):756–760. - PubMed
    1. Cancer Genome Atlas Research Network. Comprehensive genomic characterization defines human glioblastoma genes and core pathways. Nature. 2008;455(7216):1061–1068. - PMC - PubMed
    1. Rich JN, Reardon DA, Peery T, et al. Phase II trial of gefitinib in recurrent glioblastoma. J Clin Oncol. 2004;22(1):133–142. - PubMed
    1. Luca AC, Mersch S, Deenen R, et al. Impact of the 3D Microenvironment on Phenotype, Gene Expression, and EGFR Inhibition of Colorectal Cancer Cell Lines. PloS one. 2013;8(3). - PMC - PubMed

MeSH terms

Substances