. 2016 Sep 27;7(39):63690-63707.
doi: 10.18632/oncotarget.11628.

Hypoxia inducible factor-1 mediates the expression of the immune checkpoint HLA-G in glioma cells through hypoxia response element located in exon 2

Affiliations

Hypoxia inducible factor-1 mediates the expression of the immune checkpoint HLA-G in glioma cells through hypoxia response element located in exon 2

Layale Yaghi et al. Oncotarget. .

Abstract

HLA-G is an immune checkpoint molecule with specific relevance in cancer immunotherapy. It was first identified in cytotrophoblasts, protecting the fetus from maternal rejection. HLA-G tissue expression is very restricted but induced in numerous malignant tumors such as glioblastoma, contributing to their immune escape. Hypoxia occurs during placenta and tumor development and was shown to activate HLA-G. We aimed to elucidate the mechanisms of HLA-G activation under conditions combining hypoxia-mimicking treatment and 5-aza-2'deoxycytidine, a DNA demethylating agent used in anti-cancer therapy which also induces HLA-G. Both treatments enhanced the amount of HLA-G mRNA and protein in HLA-G negative U251MG glioma cells. Electrophoretic Mobility Shift Assays and luciferase reporter gene assays revealed that HLA-G upregulation depends on Hypoxia Inducible Factor-1 (HIF-1) and a hypoxia responsive element (HRE) located in exon 2. A polymorphic HRE at -966 bp in the 5'UT region may modulate the magnitude of the response mediated by the exon 2 HRE. We suggest that therapeutic strategies should take into account that HLA-G expression in response to hypoxic tumor environment is dependent on HLA-G gene polymorphism and DNA methylation state at the HLA-G locus.

Keywords: HIF-1; HLA-G; exon 2 HRE; glioma.


Conflict of interest statement

CONFLICTS OF INTEREST

None.

Figures

Figure 1
Figure 1. Hypoxia-mimicking conditions induce HLA-G expression in HLA-G negative glioblastoma cell line U251MG
(A) Real-time RT-PCR analysis, targeting all HLA-G mRNA forms, carried out on cells cultured with normal growth conditions or treated with DFX at 400 μM for 24 h, 5-aza-2′-deoxycytidine (5-aza-dC) at 100 μM for 72 h, or 5-aza-dC combined to DFX (3 independent experiments in duplicates). The cells exposed to 5-aza-dC exhibit a ~103 mean-fold increase in HLA-G transcript level, while combined treatments give an additional ~2 mean-fold increase in HLA-G transcript level (3 independent experiments in duplicates). Data is presented as mean ± SEM and statistical analysis was performed using Mann-Whitney U tests (* indicates a p value < 0.05 and ** indicate a p value < 0.01). (B) Representative western blot analysis of HLA-G activation revealed with 4H84 mAb (2 independent experiments). U251MG cells were either treated with conditions described above or not (Unt: untreated). α-Tubulin was used as an internal control. JEG-3: choriocarcinoma cell line expressing HLA-G.
Figure 2
Figure 2. HIF-1 is implicated in the activation of HLA-G expression in hypoxia-mimicking conditions
(A) Representative western blot and real-time RT-PCR analysis of HIF-1α expression in U251MG wild type cells (WT), or transfected with an irrelevant shRNA (sh-IRR) or HIF-1α specific shRNA (sh-HIF-1α). Cells were treated with DFX (400 μM) for 3 h. Western blot was performed with cytoplasmic extracts and β-actin as an internal control. HIF-1α and β-actin bands were collected from the same gel to assemble the picture. qRT-PCR results were compared to those of U251MG WT (assigned a value of 1). (B) Real-time RT-PCR analysis of HLA-G expression in transfected U251MG cells (U251MG sh-IRR and U251MG sh-HIF-1α; 2 independent experiments in duplicates for each transfectant), either treated with 5-aza-dC (100 μM) for 72 h and DFX (400 μM) for 24 h, or not. Results were compared to those of HLA-G positive cell line JEG-3 (assigned a value of 1).
Figure 3
Figure 3. HIF-1α activates HLA-G expression through HREs located on the HLA-G locus
(A) Schematic representation of the location of HREs in the 1.4 kb-5′URR and 1.4 kb-Exon2 fragments of HLA-G cloned in pGL3 basic vector upstream of the firefly luciferase gene. The sequence of each HRE is described. −966 HBS contains a natural G/A polymorphism indicated as −966(G) and −966(A). +281 HRE contains a double HBS that was cloned either in its wild type (WT) or double mutated (mutEx2) forms. (B) Luciferase activity assayed with U251MG transfected with either constructs, treated or not with DFX (400 μM) for 24 h. Results were normalized to luciferase activity in U251MG cells transfected with pGL3 Promoter vector (Promega), and compared to luciferase activity in untreated cells (assigned a value of 1). A co-transfected pRL-TK Renilla Luciferase reporter vector served as internal control for transfection efficiency and extract preparation. Data are presented as mean ± SEM of 3 independent experiments in duplicates, and statistical analysis was performed using Wilcoxon matched-pairs signed rank test (* indicates a p value < 0.05, ** indicate a p value < 0.01 and *** indicate a p value < 0.001).
Figure 4
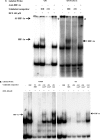
Figure 4. Absence of HIF-1α binding on −966 and −242 HREs of HLA-G promoter in EMSA performed with nuclear extracts of U251MG cells treated (+) or not (−) with DFX (400 μM) for 3 h
Radiolabeled probe TFHBS (transferrin gene HBS) was used as a positive control for HIF-1α binding. (A) EMSA performed with radiolabeled probes −966(G) and −242. Competition experiments were carried out by adding a 100-fold molar excess of unlabeled double stranded irrelevant (IRR) or cold specific probe. HIF-1α is demonstrated by supershift analysis using nuclear extracts incubated overnight with an anti-HIF-1α antibody prior to binding experiments. The supershifted complex is indicated by «SS HIF-1α» and «*». (B) EMSA performed with radiolabeled probe TFHBS and 100-fold molar excess of unlabeled competitors. −966(A) is the mutated form of −966(G) HBS. (C) EMSA performed with radiolabeled probes containing abasic sites: −242 F abasic; −966 (G) F abasic 1; −966 (G) F abasic 2 (see Material and methods). The HIF-1α/Probe complex is indicated by an arrow «HIF-1α» on the gel.
Figure 5
Figure 5. EMSA validation of HIF-1α binding to the HRE located in exon 2 of HLA-G gene (+281) with nuclear extracts of U251MG cells treated (+) or not (−) with DFX (400 μM) for 3 h
A) EMSA performed with radiolabeled HLA-G probes containing +281 HRE with 2 HBS (5′ and 3′), either wild type (+281) or abasic (+281 R abasic). Competition experiments were realized by adding a 100- fold molar excess of unlabeled double stranded irrelevant or specific cold probe. The HIF-1α/Probe complex is indicated by an arrow «HIF-1α». Nuclear extracts were also incubated overnight with an anti-HIF-1α antibody prior to binding experiments. The supershifted complex is indicated by an arrow «SS HIF-1α» and «*». (B) EMSA performed with radiolabeled control probe TFHBS (Transferrin gene HBS) and +281 HRE in the presence of a 100-fold molar excess of unlabeled competitors: IRR (irrelevant), TFHBS, +281, +281 mut5′ (5′ HBS mutated 5′-CATGGGCTAAAAGGACGACACGCAGTTCGT-3′), 281 mut3′ (3′ HBS mutated 5′-CATGGGCTACGTGGACGACTTTCAGTTCGT-3′) and +281 mut (3′ and 5′ HBS mutated 5′-CATGGGCTAAAAGGACGACTTTCAGTTCGT-3′). (C) EMSA performed with TFHBS and +281 probe with nuclear extracts incubated overnight with anti-HIF-2α antibody prior to binding experiments.
Figure 6
Figure 6. HIF-1 binding to the HLA-G gene in U251MG cells treated with 100 μM 5-aza-dC (72 hours) and 400 μM DFX (additional 3 hours)
ChIP experiment performed with anti-HIF-1α antibody or control Rabbit IgG. G25′AAV / G257R indicates primer set used for PCR targeting exon 2 of HLA-G gene; Input indicates input chromatin used as PCR control.

Similar articles

Cited by

References

    1. Ebos JM, Kerbel RS. Antiangiogenic therapy: impact on invasion, disease progression, and metastasis. Nat Rev Clin Oncol. 2011;8:210–221. - PMC - PubMed
    1. Mouillot G, Marcou C, Zidi I, Guillard C, Sangrouber D, Carosella ED, Moreau P. Hypoxia modulates HLA-G gene expression in tumor cells. Hum Immunol. 2007;68:277–285. - PubMed
    1. Chang CC, Murphy SP, Ferrone S. Differential in vivo and in vitro HLA-G expression in melanoma cells: potential mechanisms. Hum Immunol. 2003;64:1057–1063. - PubMed
    1. Paul P, Rouas-Freiss N, Khalil-Daher I, Moreau P, Riteau B, Le Gal FA, Avril MF, Dausset J, Guillet JG, Carosella ED. HLA-G expression in melanoma: a way for tumor cells to escape from immunosurveillance. Proc Natl Acad Sci USA. 1998;95:4510–4515. - PMC - PubMed
    1. Patel R, Shervington L, Lea R, Shervington A. Epigenetic silencing of telomerase and a non-alkylating agent as a novel therapeutic approach for glioma. Brain Res. 2008;1188:173–181. - PubMed

MeSH terms