. 2016 Dec;12(4):673-685.
doi: 10.1007/s11302-016-9531-6. Epub 2016 Aug 30.

Adenosine arrests breast cancer cell motility by A3 receptor stimulation

Affiliations

Adenosine arrests breast cancer cell motility by A3 receptor stimulation

Carola Ledderose et al. Purinergic Signal. 2016 Dec.

Abstract

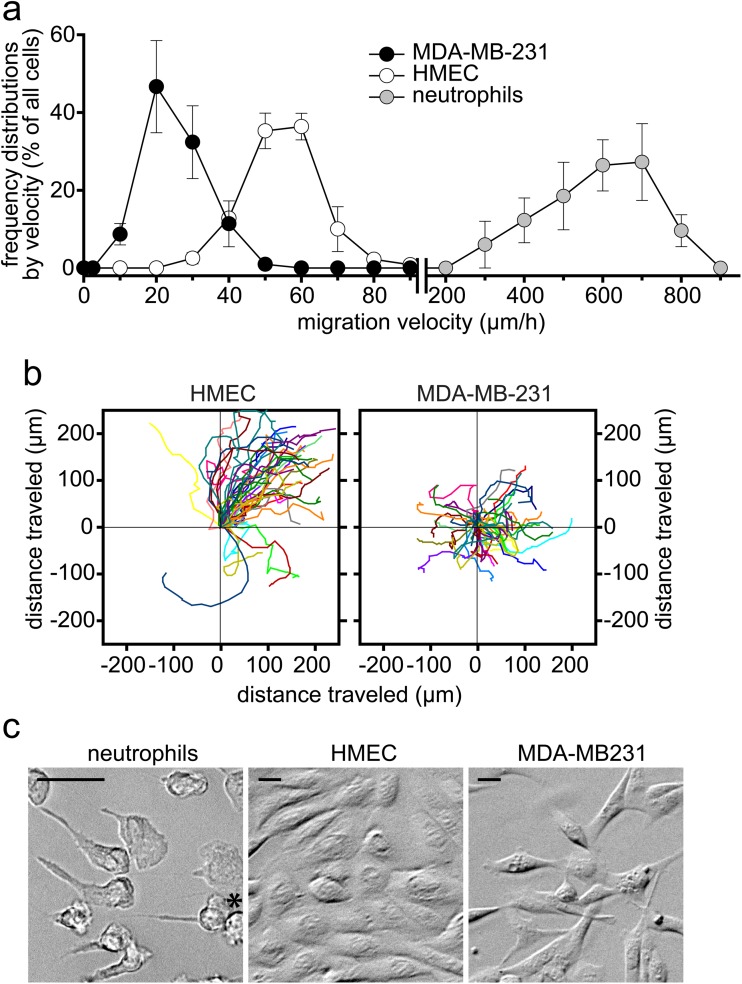
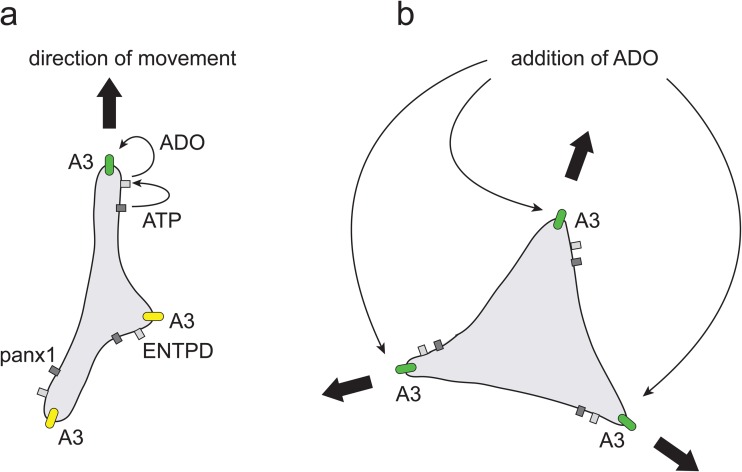
In neutrophils, adenosine triphosphate (ATP) release and autocrine purinergic signaling regulate coordinated cell motility during chemotaxis. Here, we studied whether similar mechanisms regulate the motility of breast cancer cells. While neutrophils and benign human mammary epithelial cells (HMEC) form a single leading edge, MDA-MB-231 breast cancer cells possess multiple leading edges enriched with A3 adenosine receptors. Compared to HMEC, MDA-MB-231 cells overexpress the ectonucleotidases ENPP1 and CD73, which convert extracellular ATP released by the cells to adenosine that stimulates A3 receptors and promotes cell migration with frequent directional changes. However, exogenous adenosine added to breast cancer cells or the A3 receptor agonist IB-MECA dose-dependently arrested cell motility by simultaneous stimulation of multiple leading edges, doubling cell surface areas and significantly reducing migration velocity by up to 75 %. We conclude that MDA-MB-231 cells, HMEC, and neutrophils differ in the purinergic signaling mechanisms that regulate their motility patterns and that the subcellular distribution of A3 adenosine receptors in MDA-MB-231 breast cancer cells contributes to dysfunctional cell motility. These findings imply that purinergic signaling mechanisms may be potential therapeutic targets to interfere with the motility of breast cancer cells in order to reduce the spread of cancer cells and the risk of metastasis.

Keywords: ATP; Adenosine; Adenosine receptor; Breast cancer; Cell motility; Purinergic signaling.


Conflict of interest statement

The authors declare that they have no conflicts of interest. Ethical approval All procedures performed in this study involving human participants were in accordance with the ethical standards of the institutional research committee and with the 1964 Helsinki Declaration and its later amendments or comparable ethical standards. Informed consent Informed consent was obtained from all individual participants included in the study.

Figures

Fig. 1
Fig. 1
MDA-MB-231 cells display a disorganized motility pattern. a The velocities of individual HMEC, MDA-MB-231 cells, and neutrophils were assessed by live cell microscopy and the results plotted to show the frequency distribution of cell speeds. Neutrophil chemotaxis was induced by generating a chemotactic gradient field with a micropipette loaded with 100 nM N-formyl-methionyl-leucyl-phenylalanine (fMLP). Data shown are means ± SD of n = 3 (HMEC) or n = 4 (neutrophils and MDA-MC-231 cells) separate experiments, each comprising tracking data from at least 40 individual cells. b Cell motility patterns of HMEC and MDA-MB-231 cells were analyzed from tracking data acquired over 5 h of time-lapse video microscopy (see also related Video 1). Migration paths of n = 40 cells aligned with their origins at x = y = 0 μm are shown. c Cell shapes of migrating neutrophils, HMEC, and MDA-MB-231 cells. Left panel: The asterisk indicates the position of the micropipette tip loaded with 100 nM fMLP to generate a chemotactic gradient field. Scale, 20 μm
Fig. 2
Fig. 2
MDA-MB-231 cells possess ectonucleotidases that facilitate adenosine formation. a Ectonucleotidase expression profiles of HMEC and MDA-MB-231 cells were characterized by qPCR (n = 2). The preferred ATP hydrolysis products of key enzymes are indicated by arrows. b–e The ability of HMEC and MDA-MB-231 cells to hydrolyze ATP was assessed by incubating equal numbers of HMEC and MDA-MB-231 cells with exogenous ATP (5 μM) and measuring the concentrations of the remaining ATP (b) and its breakdown products ADP (c), AMP (d), and adenosine (ADO) (e) with HPLC after the indicated incubation times. ATP was added immediately (∼3 s) before the first sample was taken for HPLC analysis (t = 0 min). Values are expressed as the mean ± SD of n = 3 experiments; *p < 0.05, HMEC vs. MDA-MB-231 (t test)
Fig. 3
Fig. 3
Endogenous adenosine formation and autocrine stimulation of A3 receptors contribute to MDA-MB-231 cell motility. a MDA-MB-231 cells were treated with CBX (10 μM), adenosine deaminase (ADA; 10 U/ml), pentostatin (100 nM), DPCPX (A1 antagonist, 20 nM), CSC (A2a antagonist, 200 nM), MRS 1754 (A2b antagonist, 100 nM), or MRS 1191 (A3 antagonist, 20 nM) and the velocity of random cell motility was assessed by time-lapse microscopy. At least 30 randomly selected cells were tracked over 16 h to calculate the mean velocity for each well. Results represent the mean values ± SD of n = 4–10 separate experiments. Statistical comparisons were done with one-way ANOVA; *p < 0.05. b MDA-MB-231 cells were stained with antibodies for the different P1 receptor subtypes (green) and with phalloidin (red) to evaluate F-actin accumulation at the leading edge. Note arrows indicating A3 receptor accumulation at multiple leading edges. The histograms depict the fluorescence intensity distributions of adenosine receptors (green) and F-actin (red) along the region of interest marked in the merged image. Images were taken with a Zeiss LSM 510 confocal microscope using a ×63 objective. Scale bar, 20 μm
Fig. 4
Fig. 4
Exogenous adenosine elicits shape changes and spreading of MDA-MB-231 cells. a Cell shapes of MDA-MB-231 cells treated or not (contol) with 10 μM adenosine (ADO) for 6 h (×10 objective). Scale bar, 50 μm. b Four different groups were identified and their frequency distributions were assessed in the presence or absence of 10 μM adenosine. All cells (150–200) in a randomly selected microscopic field were analyzed. Data show the mean values ± SD of n = 4 separate experiments; *p < 0.05 (t test). c Surface area of cells treated or not with adenosine. Data show the mean values ± SD of n = 4 separate experiments, each comprising 150–200 cells; *p < 0.05 (t test)
Fig. 5
Fig. 5
Addition of adenosine arrests breast cancer cell motility. a, b The motility of MDA-MB-231 cells was assessed by time-lapse microscopy over a period of 3 h after the addition of adenosine (a), ATP, or the non-hydrolyzable ATP analog ATPγS (b). The velocity of random migration was calculated from the tracks of individual cells (n = 24–30 cells). Values are expressed as the mean ± SD of n = 3 experiments and statistical comparisons were done with one-way ANOVA; *p < 0.05 vs. untreated control. c, d Motility of MDA-MB-231 cells (c) or MCF-7 cells (d) in the absence (control) or presence of 10 μM adenosine was assessed by time-lapse video microscopy over a period of 3 h and individual cell tracks (n = 30) were aligned with their origins at coordinate x = y = 0 μm (see related Video 2)
Fig. 6
Fig. 6
Adenosine reversibly inhibits breast cancer cell motility through A3 receptors. a MDA-MB-231 cells were treated with adenosine (10 μM), CPA (selective A1 agonist, 50 nM), CGS 21680 (selective A2a agonist, 50 nM), or IB-MECA (selective A3 agonist, 20 nM) and the velocity of random cell motility was assessed by time-lapse video microscopy. At least 30 randomly selected cells were tracked to calculate the mean velocity for each well. Results represent the mean values ± SD of n = 4–10 separate experiments. Statistical comparisons were done with one-way ANOVA; *p < 0.05. b MDA-MB-231 cells were treated with siRNA targeting the A3 receptor or with nonsense control siRNA and the velocity of random cell motility in the presence or absence of adenosine (10 μM) was assessed. Results are expressed as percentage of the random cell motility of cells treated with the respective siRNA but not with adenosine. Mean values ± SD of n = 4 separate experiments are shown; *p < 0.05 (t test). c MDA-MB-231 cells were treated with adenosine (10 μM) at the indicated time point (t = 4 h). At t = 8 h, adenosine was washed out and motility was observed for another 16 h (see also related Video 3). Data represent the mean values ± SEM of n = 60 cells of two independent experiments
Fig. 7
Fig. 7
Proposed model of the regulation of MDA-MB-231 cell migration by endogenous and exogenous stimulation of A3 receptors. a ATP release through pannexin1 (panx1) channels and adenosine formation by ectonucleotidases (ENTPD) result in endogenous A3 receptor stimulation at the nearest leading edge and random motility of MDA-MB-231 cells in the corresponding direction. b Exogenous adenosine simultaneously stimulates A3 receptors on all leading edges of a cell, causing the cell to spread out in opposing directions and thus arresting MDA-MB-231 cell motility

Similar articles

Cited by

References

    1. Merrill RM, Sloan A. Risk-adjusted female breast cancer incidence rates in the United States. Cancer Epidemiol. 2012;36:137–140. doi: 10.1016/j.canep.2011.08.004. - DOI - PubMed
    1. Burnstock G. Purine and pyrimidine receptors. Cell Mol Life Sci. 2007;64:1471–1483. doi: 10.1007/s00018-007-6497-0. - DOI - PMC - PubMed
    1. Chen Y, Corriden R, Inoue Y, Yip L, Hashiguchi N, Zinkernagel A, Nizet V, Insel PA, Junger WG. ATP release guides neutrophil chemotaxis via P2Y2 and A3 receptors. Science. 2006;314:1792–1795. doi: 10.1126/science.1132559. - DOI - PubMed
    1. Corriden R, Chen Y, Inoue Y, Beldi G, Robson SC, Insel PA, Junger WG. Ecto-nucleoside triphosphate diphosphohydrolase 1 (E-NTPDase1/CD39) regulates neutrophil chemotaxis by hydrolyzing released ATP to adenosine. J Biol Chem. 2008;283:28480–28486. doi: 10.1074/jbc.M800039200. - DOI - PMC - PubMed
    1. Inoue Y, Chen Y, Hirsh MI, Yip L, Junger WG. A3 and P2Y2 receptors control the recruitment of neutrophils to the lungs in a mouse model of sepsis. Shock. 2008;30:173–177. - PMC - PubMed

Publication types

MeSH terms

Substances