Comparative Study
. 2016 Aug 30;16(1):692.
doi: 10.1186/s12885-016-2720-4.

Performance comparison of two commercial human whole-exome capture systems on formalin-fixed paraffin-embedded lung adenocarcinoma samples

Affiliations
Comparative Study

Performance comparison of two commercial human whole-exome capture systems on formalin-fixed paraffin-embedded lung adenocarcinoma samples

Silvia Bonfiglio et al. BMC Cancer. .

Abstract

Background: Next Generation Sequencing (NGS) has become a valuable tool for molecular landscape characterization of cancer genomes, leading to a better understanding of tumor onset and progression, and opening new avenues in translational oncology. Formalin-fixed paraffin-embedded (FFPE) tissue is the method of choice for storage of clinical samples, however low quality of FFPE genomic DNA (gDNA) can limit its use for downstream applications.

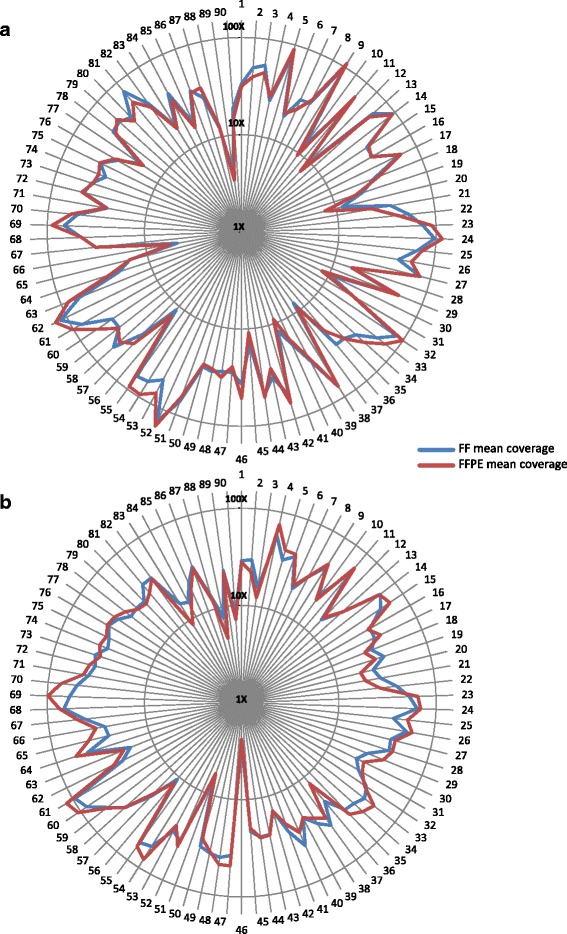
Methods: To investigate the FFPE specimen suitability for NGS analysis and to establish the performance of two solution-based exome capture technologies, we compared the whole-exome sequencing (WES) data of gDNA extracted from 5 fresh frozen (FF) and 5 matched FFPE lung adenocarcinoma tissues using: SeqCap EZ Human Exome v.3.0 (Roche NimbleGen) and SureSelect XT Human All Exon v.5 (Agilent Technologies).

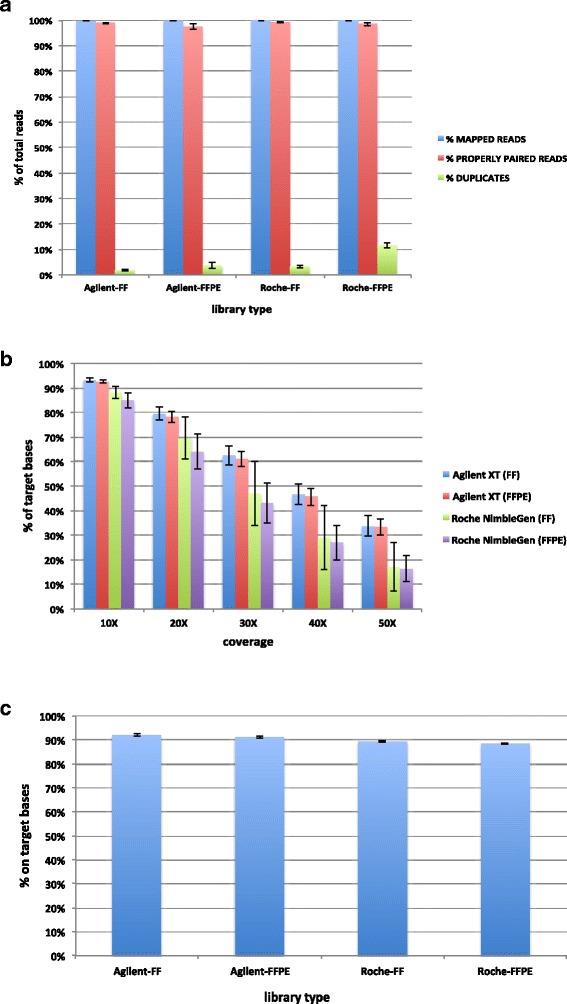
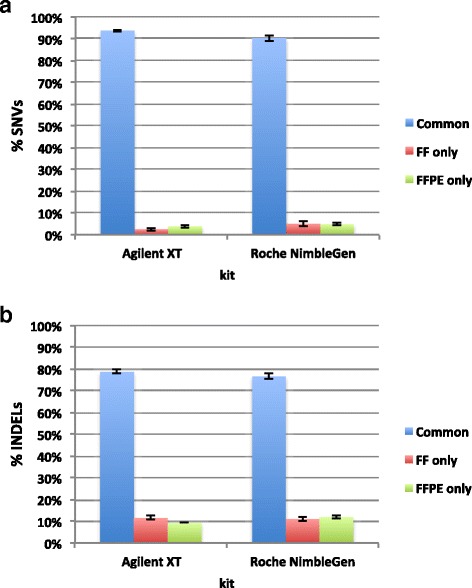
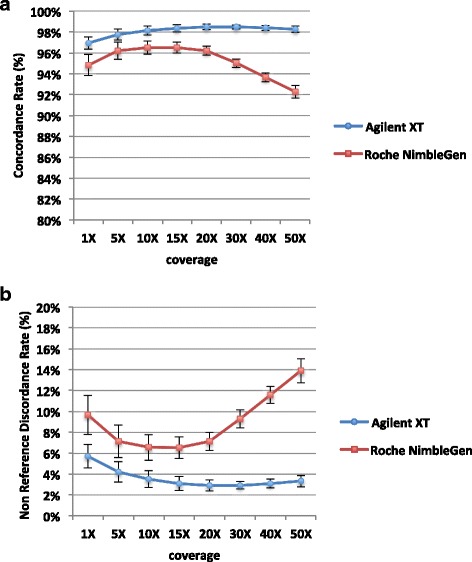
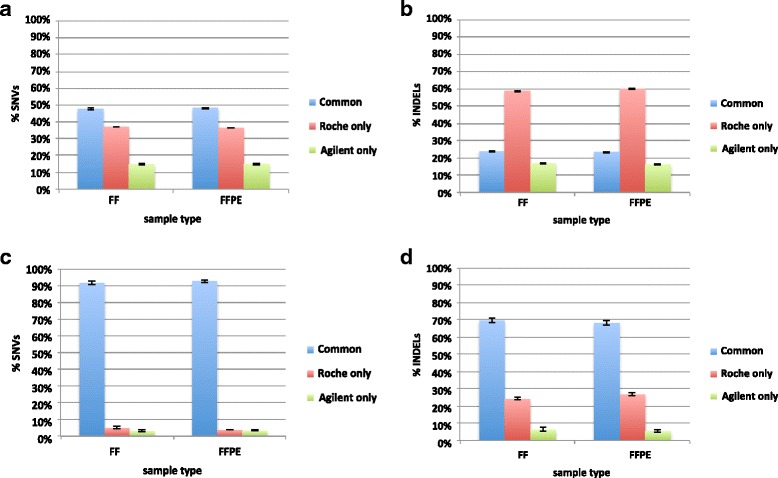
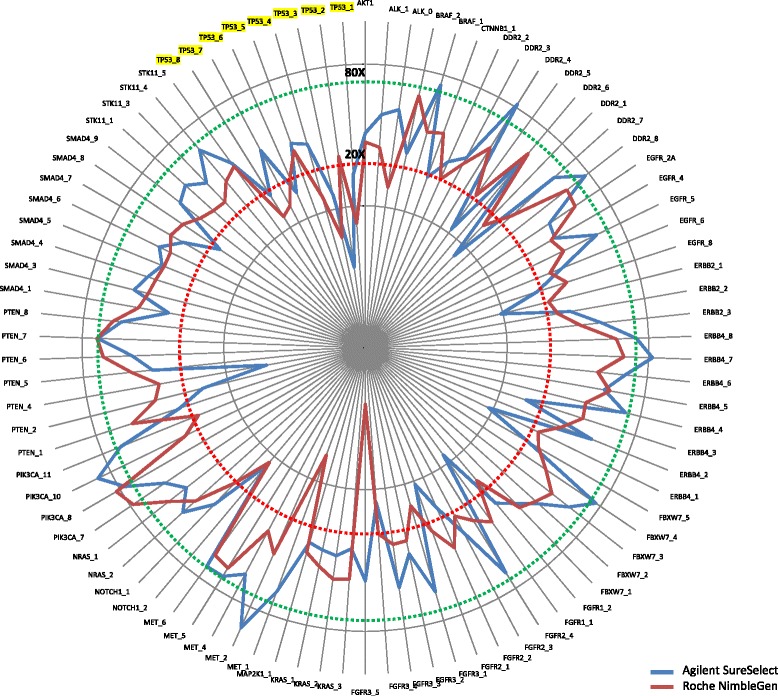
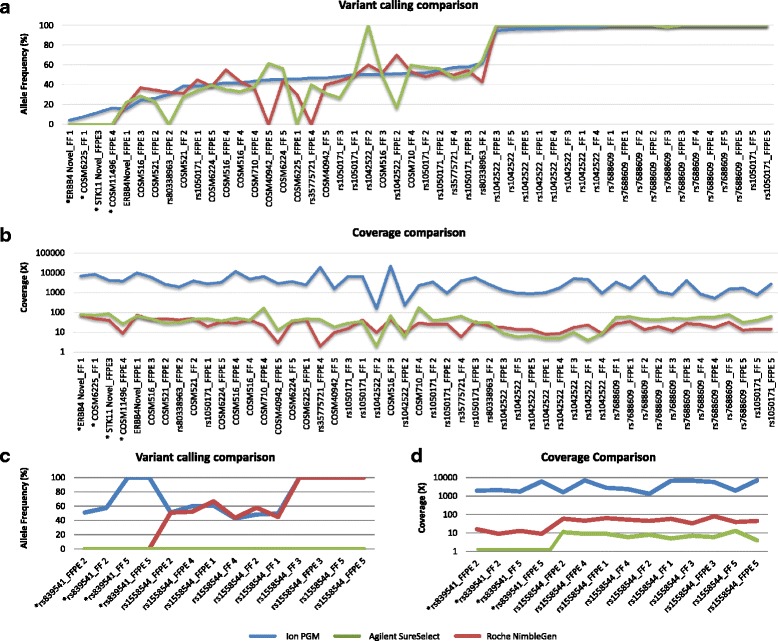
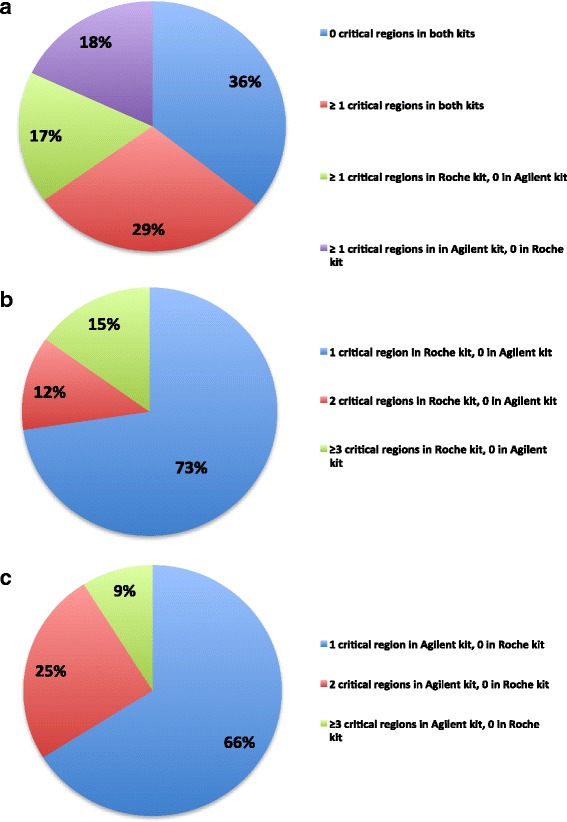
Results: Sequencing metrics on Illumina HiSeq were optimal for both exome systems and comparable among FFPE and FF samples, with a slight increase of PCR duplicates in FFPE, mainly in Roche NimbleGen libraries. Comparison of single nucleotide variants (SNVs) between FFPE-FF pairs reached overlapping values >90 % in both systems. Both WES showed high concordance with target re-sequencing data by Ion PGM™ in 22 lung-cancer genes, regardless the source of samples. Exon coverage of 623 cancer-related genes revealed high coverage efficiency of both kits, proposing WES as a valid alternative to target re-sequencing.

Conclusions: High-quality and reliable data can be successfully obtained from WES of FFPE samples starting from a relatively low amount of input gDNA, suggesting the inclusion of NGS-based tests into clinical contest. In conclusion, our analysis suggests that the WES approach could be extended to a translational research context as well as to the clinic (e.g. to study rare malignancies), where the simultaneous analysis of the whole coding region of the genome may help in the detection of cancer-linked variants.

Keywords: Cancer-related genes; Exome sequencing; FFPE; Lung adenocarcinoma; Quality control; Solution-based capture.


Figures

Fig. 1
Fig. 1
WES metrics comparison. Mean percentage ± SD (n = 5) of mapped, properly paired and duplicated reads obtained for each exome capture technology in both FF and FFPE libraries (a). Mean percentage ± SD (n = 5) of target bases achieving a certain coverage value or higher for each library type suggests that Roche kit tends to accumulate reads in low coverage regions (b). Mean percentage ± SD (n = 5) of on target bases for each library type. On target bases are referred to the number of aligned bases that map either on or near a bait within a 100 bp interval (c)
Fig. 2
Fig. 2
Variant calling comparison between FF and FFPE samples. The mean ± SD, computed across five matched FF-FFPE pairs, of the percentage of SNVs (a) and InDels (b) common to both sample types (blue) and unique to either FF (red) or FFPE (green) samples is reported for both capture systems. They both show on average ≥ 90 % of shared SNVs, and < 80 % of common InDels between FF and FFPE samples
Fig. 3
Fig. 3
Genotype concordance (CR) and non-reference discordance (NRDR) rates between matched FF-FFPE pairs computed at increasing coverage thresholds. The mean ± SD across five matched FF-FFPE pairs of the CR % (a) or of the NRDR % (b) is reported at each coverage threshold for both Agilent and Roche kit
Fig. 4
Fig. 4
Variant calling comparison between Agilent SureSelect and Roche NimbleGen kit. Mean percentage ± SD of SNVs and InDels common to both library prep kits (blue), and private to either Roche (red) or Agilent (green) kit in both FF and FFPE samples. The average percentage of common SNVs (a) and InDels (b) was approximately 48 % (FF: 47.8 %; FFPE: 48.5 %) and 24 % (FF: 24 %; FFPE: 23.5 %) across the whole target region specific for each kit. The average percentage of common SNVs (c) and InDels (d) was approximately 92 % (FF: 91.9 %; FFPE: 93 %) and 69 % (FF: 69.7 %; FFPE: 69.1 %) across the 42 Mb target region shared between the two kits
Fig. 5
Fig. 5
Coverage distribution across 90 PCR-capture amplicons between FF and FFPE samples. Coverage distribution across the 90 ‘AmpliSeq Colon and Lung Cancer Panel’ regions displays a similar trend between the FF (blue) and FFPE (red) libraries in both Agilent SureSelect (a) and Roche NimbleGen (b) libraries respectively, with a slightly better coverage in FFPE samples. Each amplicon is identified by a number as reported in Additional file 3: TableS7
Fig. 6
Fig. 6
Comparison of coverage distribution across 90 PCR-capture amplicons of both WES systems. The comparison shows a lower uniformity across the amplicons in Agilent libraries, with a higher number of low read depth regions (20 amplicons with coverage <20× vs 14 of Roche) or very high coverage (10 amplicons with coverage >80× vs 2 of Roche). Both whole exome capture systems showed a poor coverage in TP53 with 5/8 unsuccessfully covered amplicons (<20×) in each WES system. Coverage values were transformed in logarithmic scale
Fig. 7
Fig. 7
Variant calling comparison between Ion PGM data and both WES systems. Variant calling comparison between Ion PGM data (blue) and both Agilent SureSelect (green) and Roche NimbleGen (red) data in exon regions shows 88 % of concordance (44/50) in both WES capture systems (a). Both systems failed to call 4 genetic variants (*) detected by Ion PGM platform at low frequencies (4-16 %). Further 4 variants were missed as follows: 2 by Agilent (COSM6225, rs80338963) and 2 by Roche NimbleGen (COSM40942, rs35775721). Horizontal axis reports the genetic variants (Additional file 3: Table S8a) ordered from lowest to highest frequency (vertical axis) as assessed by Ion PGM platform. Variant coverage displays a quite similar trend between Agilent (green) and Roche NimbleGen (red) libraries, and is far lower than Ion PGM platform (blue) (b). Two Roche libraries report a low coverage in the uncalled variants (COSM40942, rs35775721). Vertical axis displays the variant coverage in logarithmic scale. Variant calling comparison between Ion PGM data (blue) and both Agilent (green) and Roche NimbleGen (red) data in non-exon regions shows a poor performance of both WES technologies (c). Both WES systems failed to call the rs839541 (*) SNP in ERBB4 gene, whereas rs1558544 SNP in EGFR was missed by all 10 Agilent libraries. Vertical axis reports the frequency of the genetic variants. Variant coverage comparison between Ion PGM data (blue) and both Agilent (green) and Roche NimbleGen (red) data in non-exon (intron/downstream/upstream) regions reports a low coverage in both exome capture kits (d); rs839541 SNP was completely uncovered in Agilent libraries. Vertical axis displays coverage values in logarithmic scale
Fig. 8
Fig. 8
Coverage distribution across all the coding exons of 623 cancer-related genes in both WES platforms. Distribution summary of 623 cancer-related genes according to their coverage performance achieved in the two tested WES systems (a). Specifically, 36 % of the genes (red) were completely well covered by both Agilent and Roche kits; 29 % (blue) had at least one ‘critical’ region in both kits; 18 % were completely well covered by Roche NimbleGen kit, but had one or more ‘critical’ region in Agilent SureSelect kit; finally, 17 % of the genes were completely well covered by Agilent SureSelect kit, but had one or more problematic region in Roche NimbleGen kit. Distribution summary of cancer-related genes having one (73 %), two (12 %) or more (15 %) critical regions in NimbleGen Roche kit, but completely well-covered in Agilent SureSelect kit (b). Distribution summary of cancer-related genes having one (66 %), two (25 %) or more (9 %) critical regions in Agilent SureSelect kit, but completely well-covered in Roche NimbleGen kit (c)

Similar articles

Cited by

References

    1. Kan Z, Jaiswal BS, Stinson J, Janakiraman V, Bhatt D, Stern HM, et al. Diverse somatic mutation patterns and pathway alterations in human cancers. Nature. 2010;466:869–73. doi: 10.1038/nature09208. - DOI - PubMed
    1. Lawrence MS, Stojanov P, Polak P, Kryukov GV, Cibulskis K, Sivachenko A, et al. Mutational heterogeneity in cancer and the search for new cancer-associated genes. Nature. 2013;499:214–18. doi: 10.1038/nature12213. - DOI - PMC - PubMed
    1. Cancer Genome Atlas Research Network Comprehensive genomic characterization of squamous cell lung cancers. Nature. 2012;489:519–25. doi: 10.1038/nature11404. - DOI - PMC - PubMed
    1. Wood LD, Parsons DW, Jones S, Lin J, Sjöblom T, Leary RJ, et al. The genomic landscapes of human breast and colorectal cancers. Science. 2007;318:1108–13. doi: 10.1126/science.1145720. - DOI - PubMed
    1. Timmermann B, Kerick M, Roehr C, Fischer A, Isau M, Boerno ST, et al. Somatic mutation profiles of MSI and MSS colorectal cancer identified by whole exome next generation sequencing and bioinformatics analysis. PLoS One. 2010;5 doi: 10.1371/journal.pone.0015661. - DOI - PMC - PubMed

Publication types