. 2016 Aug 31:7:12658.
doi: 10.1038/ncomms12658.

Neutrophil recruitment limited by high-affinity bent β2 integrin binding ligand in cis

Affiliations

Neutrophil recruitment limited by high-affinity bent β2 integrin binding ligand in cis

Zhichao Fan et al. Nat Commun. .

Abstract

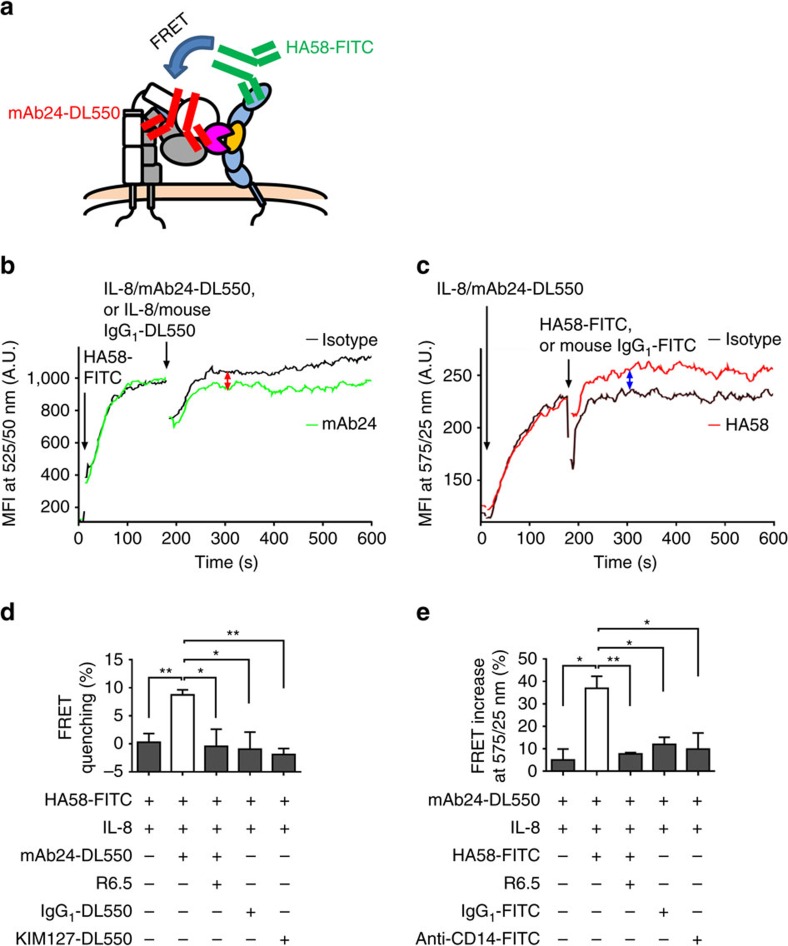
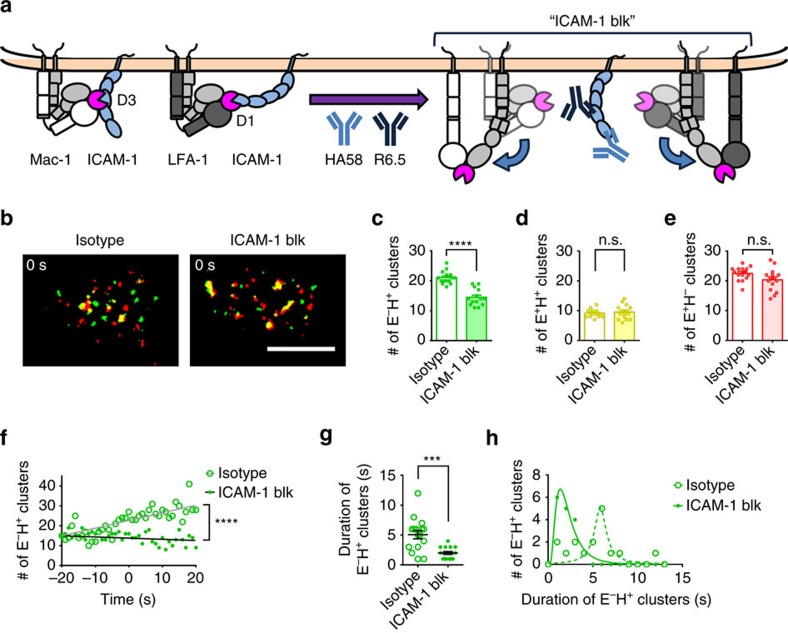
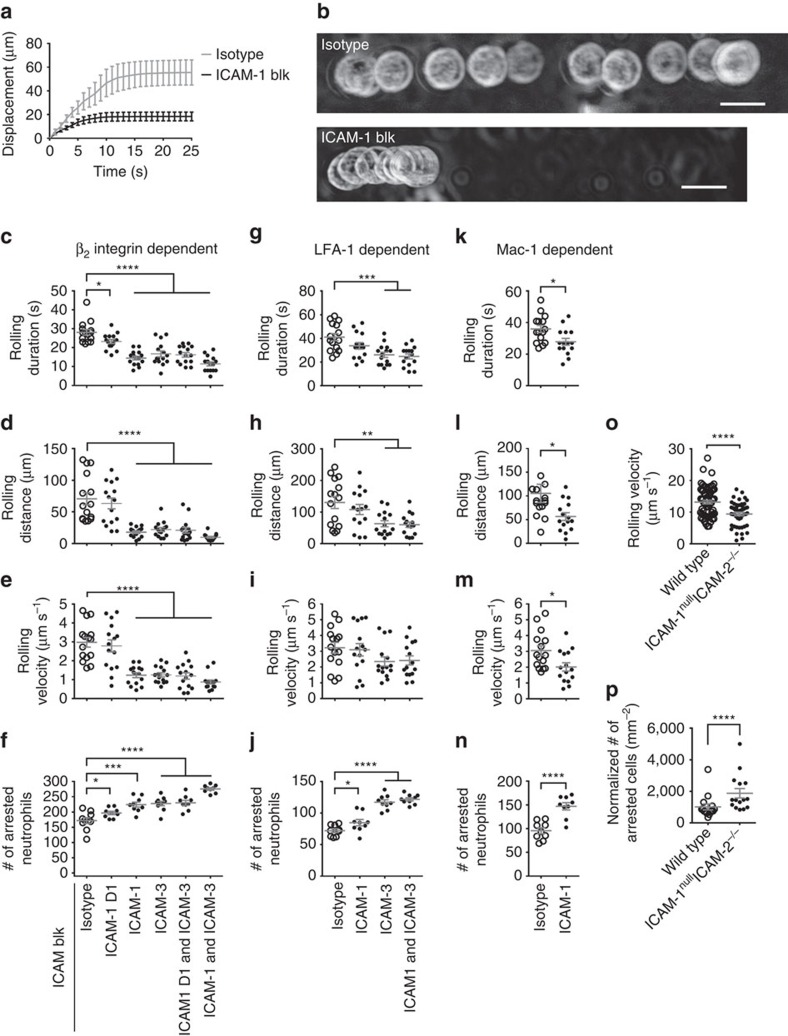
Neutrophils are essential for innate immunity and inflammation and many neutrophil functions are β2 integrin-dependent. Integrins can extend (E(+)) and acquire a high-affinity conformation with an 'open' headpiece (H(+)). The canonical switchblade model of integrin activation proposes that the E(+) conformation precedes H(+), and the two are believed to be structurally linked. Here we show, using high-resolution quantitative dynamic footprinting (qDF) microscopy combined with a homogenous conformation-reporter binding assay in a microfluidic device, that a substantial fraction of β2 integrins on human neutrophils acquire an unexpected E(-)H(+) conformation. E(-)H(+) β2 integrins bind intercellular adhesion molecules (ICAMs) in cis, which inhibits leukocyte adhesion in vitro and in vivo. This endogenous anti-inflammatory mechanism inhibits neutrophil aggregation, accumulation and inflammation.


Figures

Figure 1
Figure 1. β2 integrin E+ and H+ conformations on human neutrophil footprint.
(a) A typical image of fluorescently labelled neutrophil membrane. (b) Footprint outline of a neutrophil generated from membrane fluorescence in a. (c) Footprint outlines of a typical cell during rolling on the P-selectin/ICAM-1/IL-8 substrate at a wall shear stress of 6 dyn cm−2 (arrest at time=0 s); time was coded in rainbow colours as shown in colour bar. (df) E+ β2 integrins identified by KIM127-DL550 (red in d and f), and H+ by mAb24-DL488 (green in e and f) during neutrophil rolling on P-selectin/ICAM-1/IL-8 substrate. Footprint outlines shown in white in f. Binary images generated by smart segmentation; E+H+, E+H and EH+ clusters appear yellow, red and green, respectively, in f; scale bars, 5 μm.
Figure 2
Figure 2. Differential effects of ICAM-1 and IL-8 on integrin activation in human neutrophils.
(ad) Displacements of typical cells (n=9, mean±s.e.m.) during rolling on P-selectin/ICAM-1/IL-8 (a, arrest at time=0 s), P-selectin only (b), P-selectin/ICAM-1 (c) or P-selectin/IL-8 (d) substrates, respectively. Average rolling velocity (for a: before arrest) determined from linear regression. (e) Dynamics of cluster number per cell (E+H red, EH+ green, E+H+ yellow) rolling on P-selectin/ICAM-1/IL-8. (fh) Number of E+H+ (f), E+H (g) or EH+ (h) clusters averaged before (−30 and −15 s, n=16) and after (0, 15 and 30 s, n=24) arrest in eight cells rolling on P-selectin/ICAM-1/IL-8; each time point of each cell represented by one dot, mean±s.e.m. **P<0.01, **** P<0.0001. (it) E+H (red), EH+ (green) and E+H+ (yellow) clusters for neutrophils rolling on P-selectin only (i), P-selectin/ICAM-1 (m), and P-selectin/IL-8 (q) coated substrates. E+H+ (j,n,r), E+H (k,o,s) and EH+ (l,p,t) clusters in the footprint of cells rolling on P-selectin only (jl), P-selectin/ICAM-1 (np) or P-selectin/IL-8 (rt) in the first 50 s (first) and the next ∼50 s (next) of rolling. Mean values and s.e.ms (error bars) were presented. * P<0.05, **** P<0.0001 in unpaired student t-test.
Figure 3
Figure 3. Two pathways of conformational transitions during β2 integrin activation.
(a) Three examples of KIM127-DL550 (red, E+H) or mAb24-DL488 (green, EH+) clusters transitioning to E+H+ (yellow) over 4 s in the footprint of primary human neutrophils rolling on P-selectin, ICAM-1 and IL-8; scale bars, 0.5 μm. (be) Mean values of pixel numbers per cluster in colours as indicated (b,d) and percentage of E+H+ pixels (c,e) of 15 clusters starting as E+H (b,c) or 15 clusters starting as EH+ (d,e); s.e.ms were shown as error bars. Data collected from static cells (pre-arrest and arrested). (f) Transition history of the clusters on arrested cells (n=15, one dot per cell). Mean values and s.e.ms (error bars) were presented.
Figure 4
Figure 4. 3D distributions of β2 integrin activation clusters in primary human neutrophils.
(a) Neutrophil membrane (CellMask DeepRed) before and after arrest (0 s) of one representative neutrophil rolling on P-selectin, ICAM-1 and IL-8. (b) Membrane signal converted to hills (microvilli) and valleys (space between microvilli). (c,d) Hills (blue) and valleys (magenta) segmented (c) or E+H (red), EH+ (green) or E+H+ (yellow) clusters (d) were identified at time of arrest (0 s). (e,f) Top-view (e) and side-view (f) of the 3D topography overlaid with E+H (red), EH+ (green) or E+H+ (yellow) clusters; binary images. Horizontal scale bars, 5 μm, vertical scale bar, 20 nm for d, scale bar, 50 nm for f. (gi) Most E+H+ (g, 70±4%) and E+H (h, 68±4%) cluster pixels were on hills. Most EH+ cluster pixels (i, 71±0%) were in valleys before arrest (P<0.01 and P<0.05 compared with E+H and E+H cluster pixels in unpaired student t-test, respectively) and more EH+ cluster pixels (52±6%) localized to the hills after arrest (P<0.05 and P<0.01 compared with E+H and E+H cluster pixels in unpaired student t-test, respectively). The E+H+ (g), E+H (h) and EH+ (i) cluster pixels on the hills increased with time (the slopes were significantly non-zero, F-test, P<0.01). (jl) Distance (Δ) of E+H+ (yellow, j), E+H (red, k) or EH+ (green, l) integrin clusters to the substrate. The dashed line at 50 nm separates the integrin clusters within reach (≤50 nm) from those beyond reach (>50 nm). Each cluster represented by one dot, mean values and s.e.ms (error bars) were presented. (m) Number of clusters within 50 nm to the substrate per cell (E+H red, EH+ green, E+H+ yellow) during rolling on the substrate of P-selectin/ICAM-1/IL-8 (arrest at 0 s).
Figure 5
Figure 5. EH+ Mac-1 binds ICAM-1 in cis.
(a) Schematic of assessing the cis interaction between EH+ Mac-1 and neutrophil ICAM-1 by FRET between ICAM-1 domain 1 (HA58-FITC, donor) and H+ integrin (mAb24-DL550, acceptor). (b,c) Donor fluorescence decrease (green in b) and acceptor fluorescence increase (red in c) shows FRET of HA58-FITC with mAb24-DL550, but not with isotype controls (IgG1-DL550 as acceptor, black in b; and IgG1-FITC as donor, black in c). (d,e) Donor fluorescence decrease (d) and acceptor fluorescence increase (e) of HA58-FITC-mAb24-DL550 pairs and controls measured at 2–3 min after adding IL-8 and acceptor or donor, respectively. Blocking of EH+ Mac-1-ICAM-1 interactions (mAb R6.5) eliminated the donor fluorescence decrease and acceptor fluorescence increase. n=3, mean values and s.e.ms (error bars) were presented. * P<0.05, ** P<0.01 in unpaired student t-test. A.U., arbitrary unit.
Figure 6
Figure 6. Blocking EH+ integrin binding to neutrophil ICAM-1 promotes its transition to E+H+.
(a) Schematic showing the hypothesis that the cis interactions of EH+ integrin (both LFA-1 and Mac-1) and neutrophil ICAM-1 may stabilize the EH+ integrin. (b) Integrin clusters (E+H red, EH+ green, E+H+ yellow) on arresting neutrophils rolling on P-selectin/ICAM-1/IL-8 with or without neutrophil ICAM-1 blocking by mAbs HA58 and R6.5; scale bar, 5 μm. (ce) ICAM-1 blocking decreased the number of EH+ clusters at arrest (c, n=15 cells). The number of E+H+ (d, n=15 cells) and E+H clusters (e, n=15 cells) at arrest with or without ICAM-1 blocking. (f) Dynamics of EH+ clusters with or without ICAM-1 blockade on cells rolling on P-selectin/ICAM-1/IL-8. (g,h) ICAM-1 blocking decreased the duration of EH+ clusters before transitioning to E+H+ clusters (g, n=16 clusters). Duration histograms (h, bin=1 s). Mean values and s.e.ms (error bars) were presented in (ce) and (g). Log Gaussian (ICAM-1 blk) and Lorentzian (isotype) fits were used in h. n.s. P>0.05, ** P<0.01, *** P<0.001, **** P<0.0001 in unpaired student t-test. n.s., not significant.
Figure 7
Figure 7. Blocking EH+ integrin binding to neutrophil ICAMs promotes leukocyte adhesion.
(a) Displacements of human neutrophils (n=5) with or without blockade of neutrophil ICAM-1 during rolling on P-selectin/ICAM-1/IL-8. (b) Maximum intensity projection of a typical bright-field-imaged human neutrophil with (13 frames) or without (30 frames) blockade of neutrophil ICAM-1 rolling on P-selectin/ICAM-1/IL-8. Flow direction is from left to right. Scale bar, 10 μm. (cf) Rolling duration until arrest (c, n=15 cells per group), rolling distance until arrest (d, n=15 cells per group), rolling velocity before arrest (e, n=15 cells per group) and the number of arrested human neutrophils (f, n=9 observations per group) with or without blockade of neutrophil ICAM-1 D1 (domain 1, binds LFA-1, mAb HA58), or ICAM-1 (binds both LFA-1 and Mac-1, mAbs HA58 and R6.5), and/or ICAM-3 (binds LFA-1, mAb CBR-IC3/1). (gj) Upon blockade of Mac-1 by mAb ICRF44, LFA-1-dependent cis binding was analysed with or without blockade of LFA-1 cis binding to neutrophil ICAM-1 (mAb HA58), and/or ICAM-3 (mAb CBR-IC3/1). n=15, 15, 15 and 9 cells per group in g,h,i and j, respectively. (kn) Upon blockade of LFA-1 (mAb TS1/22), Mac-1-dependent cis binding was analysed with or without blockade of Mac-1 cis binding to neutrophil ICAM-1 (mAb R6.5). n=15, 15, 15 cells, and nine observations per group in k,l,m and n. (o) Leukocyte rolling velocity (n=48 for ICAM-1nullICAM-2−/− and 65 for wild typeDsRed cells) in mouse cremaster muscle venules of ICAM-1nullICAM-2−/−/wild typeDsRed mixed chimeric mice before intravenous injection of CXCL1. (p) The number of adherent leukocytes (n=15 observations) in mouse cremaster muscle venules of the mixed chimeric mice 1 min after intravenous injection of 600 ng CXCL1. Mean values and s.e.ms (error bars) were presented in a,cp. *P<0.05, **P<0.01, *** P<0.001, **** P<0.0001 in unpaired student t-test for a,co and paired student t-test for p.

Similar articles

Cited by

References

    1. Yipp B. G. et al.. Infection-induced NETosis is a dynamic process involving neutrophil multitasking in vivo. Nat. Med. 18, 1386–1393 (2012). - PMC - PubMed
    1. Taylor P. R. et al.. Activation of neutrophils by autocrine IL-17A-IL-17RC interactions during fungal infection is regulated by IL-6, IL-23, RORgammat and dectin-2. Nat. Immunol. 15, 143–151 (2014). - PMC - PubMed
    1. Iversen M. B. et al.. An innate antiviral pathway acting before interferons at epithelial surfaces. Nat. Immunol. 17, 150–158 (2016). - PubMed
    1. Chen F. et al.. Neutrophils prime a long-lived effector macrophage phenotype that mediates accelerated helminth expulsion. Nat. Immunol. 15, 938–946 (2014). - PMC - PubMed
    1. Autenrieth S. E. et al.. Depletion of dendritic cells enhances innate anti-bacterial host defense through modulation of phagocyte homeostasis. PLoS Pathog. 8, e1002552 (2012). - PMC - PubMed

Publication types

MeSH terms