. 2016 Oct 1;143(19):3470-3480.
doi: 10.1242/dev.134098. Epub 2016 Aug 30.

Identification, visualization and clonal analysis of intestinal stem cells in fish

Affiliations

Identification, visualization and clonal analysis of intestinal stem cells in fish

Narges Aghaallaei et al. Development. .

Abstract

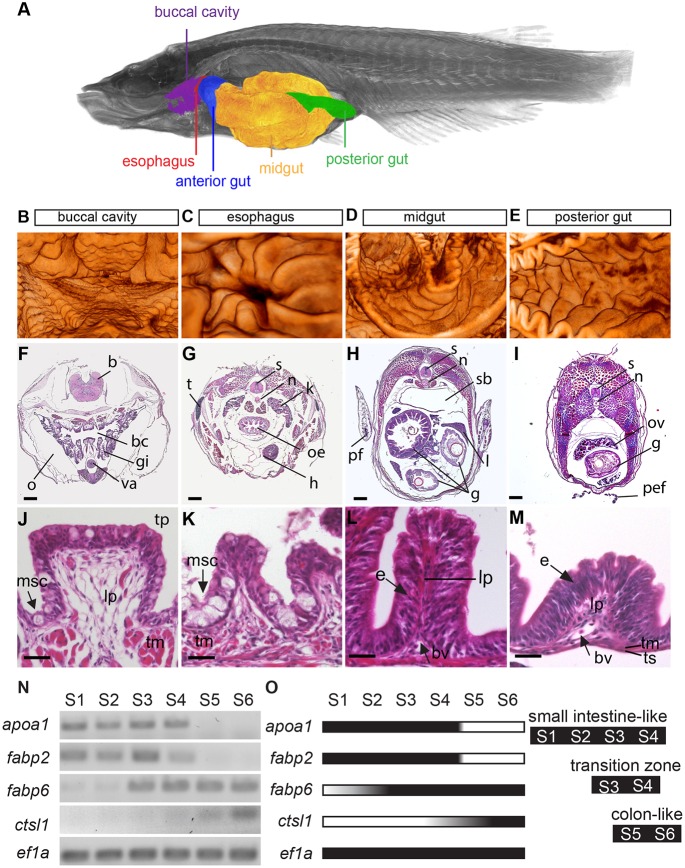
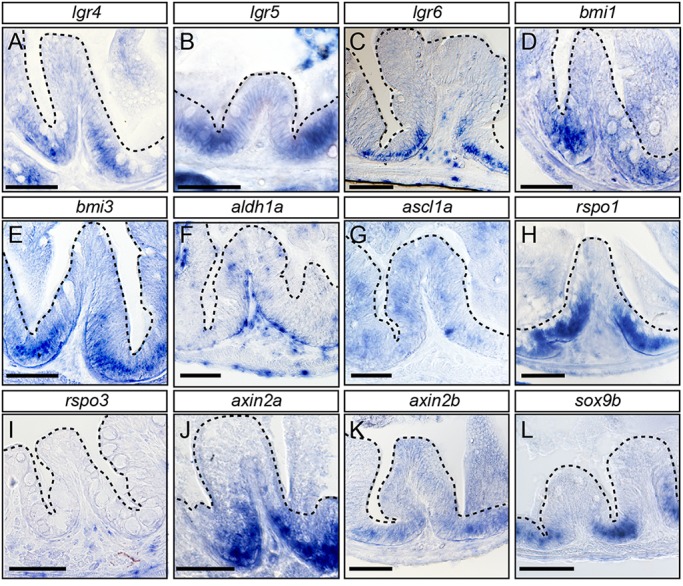
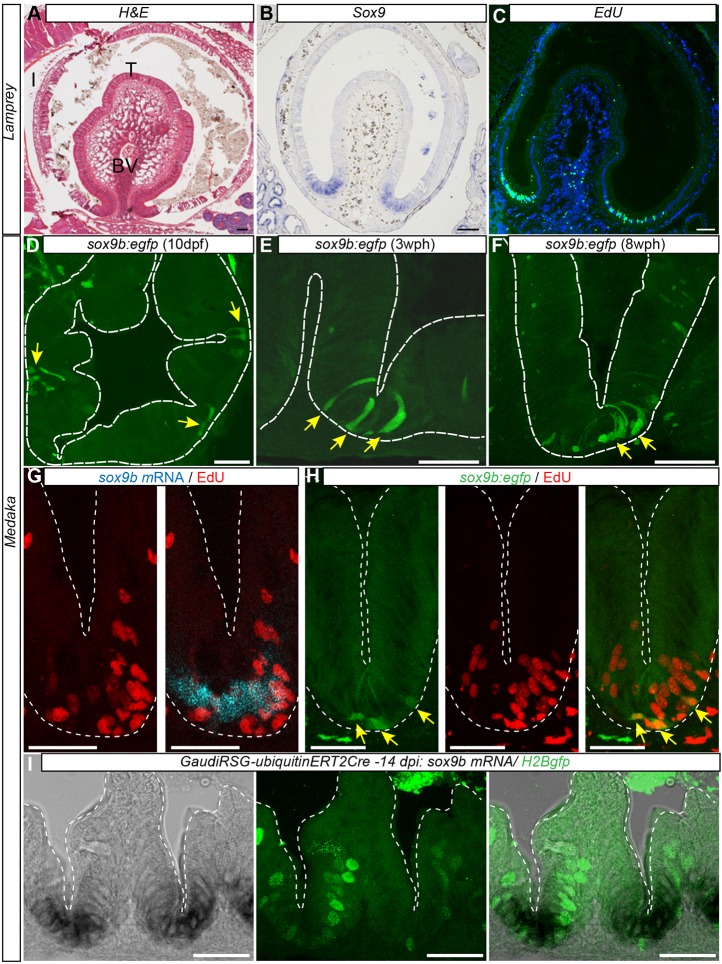
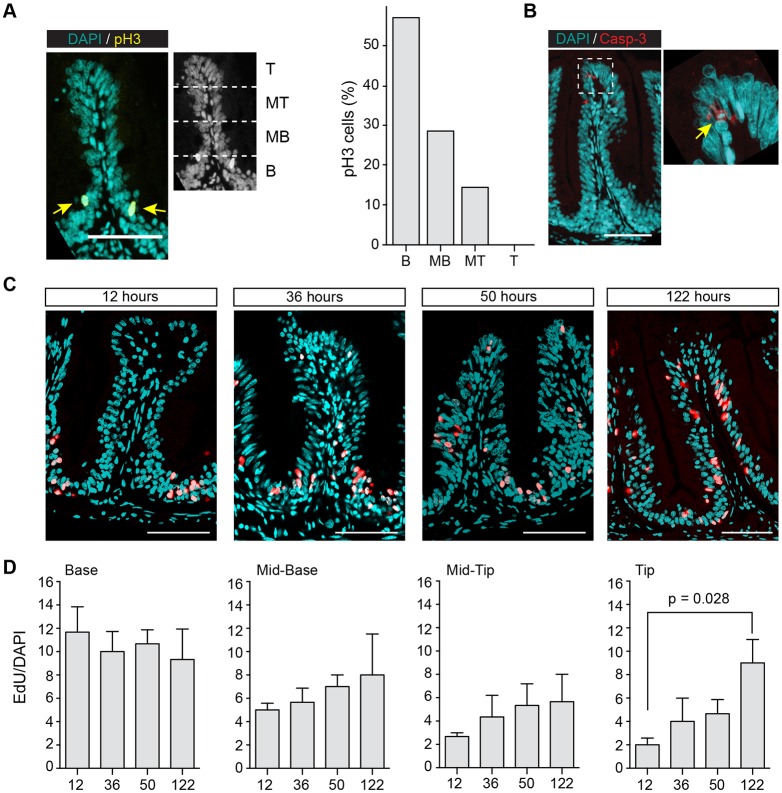
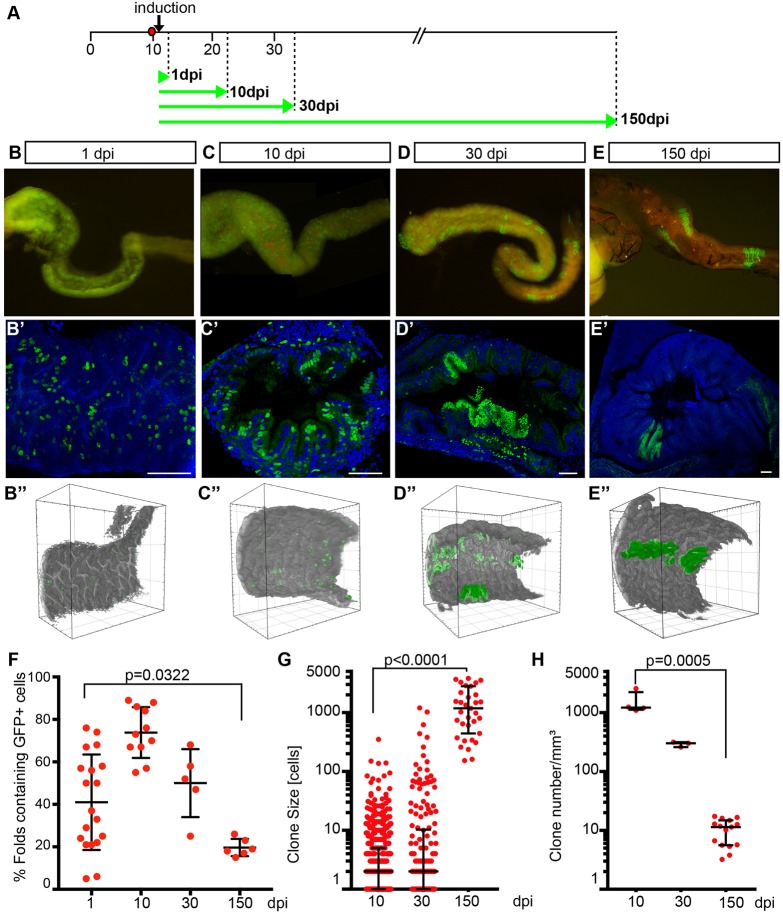
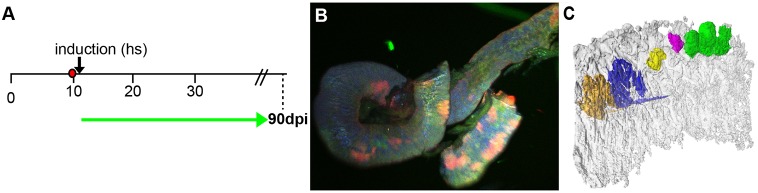
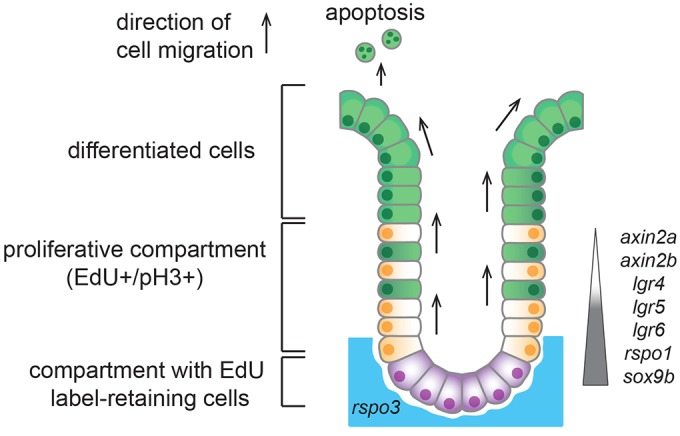
Recently, a stochastic model of symmetrical stem cell division followed by neutral drift has been proposed for intestinal stem cells (ISCs), which has been suggested to represent the predominant mode of stem cell progression in mammals. In contrast, stem cells in the retina of teleost fish show an asymmetric division mode. To address whether the mode of stem cell division follows phylogenetic or ontogenetic routes, we analysed the entire gastrointestinal tract of the teleost medaka (Oryzias latipes). X-ray microcomputed tomography shows a correlation of 3D topography with the functional domains. Analysis of ISCs in proliferation assays and via genetically encoded lineage tracing highlights a stem cell niche in the furrow between the long intestinal folds that is functionally equivalent to mammalian intestinal crypts. Stem cells in this compartment are characterized by the expression of homologs of mammalian ISC markers - sox9, axin2 and lgr5 - emphasizing the evolutionary conservation of the Wnt pathway components in the stem cell niche of the intestine. The stochastic, sparse initial labelling of ISCs ultimately resulted in extended labelled or unlabelled domains originating from single stem cells in the furrow niche, contributing to both homeostasis and growth. Thus, different modes of stem cell division co-evolved within one organism, and in the absence of physical isolation in crypts, ISCs contribute to homeostatic growth.

Keywords: Cell division mode; Digestive tract; Intestinal stem cells; Medaka.


Conflict of interest statement

The authors declare no competing or financial interests.

Figures

Fig. 1.
Fig. 1.
Medaka intestinal tract shows morphological and functional homology to mammalian intestine. (A) 3D image of adult medaka taken by X-ray microCT. Anatomical landmarks are highlighted. Data were used for reconstruction of the buccal cavity (B), esophagus (C) (rostral to caudal perspective in B,C), midgut (D; anterior: left with densely packed folds; posterior: right with elongated folds), posterior gut (E; anterior: left; posterior: right). (F-I) H&E stained transverse sections of adult gut along rostro-caudal axis. Histology of intestinal folds in each segment is shown below in J-M. Morphology of folds varies along rostro-caudal axis. (N) Gene expression of selected marker genes in six rostro-caudal segments of adult intestine. Control: elongation factor 1α. Note that apoa1 and fabp2 are only detectable in four rostral segments. Expression of large intestinal marker fabp6 is confined to caudal segments S3 to S6 and ctsl1 to segments S5, S6. (O) Schematic summary of RT-PCR results. b, brain; bc, buccal cavity; bv, blood vessel; e, enterocyte; g, gut; gi, gills; h, heart; l, liver; lp, lamina propria; msc, mucous-secreting goblet cells; n, notochord; o, operculum; oe, oesophagus; ov, ovary; pef, pelvic fin; pf, pectoral fin; sb, swim bladder; s, spinal cord; t, thymus; tm, tunica muscularis; tp, tongue papilla-like; ts, tunica serosa; va, ventral aorta. Scale bars: 200 µm for F-I and 25 µm for J-M.
Fig. 2.
Fig. 2.
Stem cell marker genes are expressed at the base of intestinal folds in the adult intestine. RNA in situ hybridization of markers on sections of the medaka adult intestine, anterior and midgut. (A-C) Graded expression of lgr4, lgr5 and lgr6 from base to centre of intestinal folds. (D-F) Weak bmi1, bmi3 and aldh1a expression, with more prominent aldh1a in lamina propria and supporting tissues. (G) ascl1a expression restricted to patches. (H,I) rspo1 is expressed within fold, whereas rspo3 is confined to underlying connective tissue. (J-L) axin (axin2a and axin2b) and sox9b show clear expression confined to the base of the fold. Dashed lines delineate intestinal folds. Scale bars: 50 µm.
Fig. 3.
Fig. 3.
Expression pattern of intestinal sox9 is conserved from lamprey to medaka. (A) Transverse section of lamprey larval intestine stained with H&E, highlighting the typhlosole as a single fold. (B) In situ detection of Sox9 expression at the base of the typhlosole. (C) EdU+ cells (24 h after injection) reveal basal proliferation zone (green; nuclei: DAPI, blue). (D-F) Medaka Sox9b:eGFP-expressing cells mark proliferative intestinal cells at the base of furrows. Confocal images of transverse cryosections of sox9b:gfp transgenic intestine at 10 dpf (D) in 3-week-old juveniles (E) and 8-week-old adult fish (F). Arrows indicate position of sox9b:eGFP-expressing cells at the base of folds. (G) Colocalization of endogenous sox9b expression domain shown by in situ hybridization and proliferation in EdU+ cells. (H) Colocalization of sox9b:eGFP-expressing cells and EdU staining. Arrows indicate sox9b:eGFP-expressing cells. Note that sox9b:eGFP-expressing cells are EdU+. (I) Sox9b endogenous expression shown by in situ hybridization in GaudíRSG-ubiquitin:ERT2Cre transgenic fish (left panel), clonal analysis of GaudíRSG-ubiquitin:ERT2Cre transgenic fish 2 weeks after induction. At the base of the furrow, proliferating GFP+ stem cells (middle panel) express sox9b (right panel). Scale bars: 100 µm (A-C); 25 µm (D,G,H,I); 50 µm (E,F). BV, blood vessel; I, intestine; T, typhlosole.
Fig. 4.
Fig. 4.
Intestinal stem cells are located in furrows between intestinal folds. (A) pH3 immunostaining on transverse sections of fold. Fold was divided into four equally sized regions: base (B), mid-base (MB), mid-tip (MT) and tip (T). Arrows in left panel indicate pH3+ cells. Respective frequency of pH3+ cells is shown in right panel. The majority of pH3+ cells are seen at the base of the fold. (B) Caspase-3 immunostaining on transverse sections of a fold. Caspase-3+ cells located at fold tip. (C,D) EdU pulse-chase assay. Adult fish were incubated in EdU for 24 h and fixed after 12, 36, 50, 122 h. For each time point, a representative fold from anterior and mid gut is shown in C. (D) Frequency of EdU+ cells in each region was analysed with KNIME. For each time point, three fish were analysed and nuclei from around 50 folds were counted for each region. Values are mean±s.e.m. A significant difference between 122 and 12 hours in the tip region was found using unpaired Student's t-test; P=0.028. Scale bars: 50 µm.
Fig. 5.
Fig. 5.
Clonal analysis in the GaudíRSG line indicates symmetric cell division in the medaka intestine. (A) Experimental timeline. Double transgenic fish GaudíRSG-ubiquitin:ERT2Cre were used with an inducible Cre recombinase that triggers a shift in reporter colour and localization. Cre-mediated recombination of GaudíRSG construct was triggered at larval stage by tamoxifen treatment (5-10 µM, 3 h). Green arrows indicate time point of imaging and analysis of the intestine after induction. (B) Whole mount representation (macroscope) of dissected intestines at different time points (B) 1 day (C) 10 days (D) 30 days (E) 150 days post induction. (B′-E′) Confocal images of intestinal sections of corresponding fish showing labelling of discrete, single cells at 1 dpi, larger clonal strings extending from bottom to top of folds (10 dpi) and coverage of entire folds with descendants of individual recombined (or non-recombined, 30 dpi, 150 dpi) cells. Each panel represents a 3D projection of 60-100 optical sections (plane=0.5 µm). H2B-GFP, green; DAPI-stained DNA, blue. Scale bars: 50 µm. (B″-E″) MuVi-Spim 3D visualization of gut segments (532 µm) at different time points after induction showing labelling in the context of the organ. (F) GFP+ folds were counted using sections from 19 fish at 1 dpi, 11 fish at 10 dpi, 5 fish at 30 dpi, 6 fish at 150 dpi; unpaired t-test, P=0.0322. (G) Quantification of clone size of intestinal segments shown in B″-E″ at 10, 30, 150 dpi; data are represented at logarithmic scale; Mann–Whitney test, P<0.0001. (H) Clone density per volume (mm3) of intestinal segments shown in B″-E″. Cell numbers were derived from light sheet analyses and are represented at logarithmic scale; Mann–Whitney test, P=0.0005. Black bars indicate mean±s.d. in F and interquartile range in G,H.
Fig. 6.
Fig. 6.
Clonal cell lineage tracing using GaudíLxBBW line confirms mode of cell division in the medaka intestine. (A) Experimental timeline. Double transgenic fish Hsp70::nlsCRE were used. Temperature shift inducible Cre recombinase triggers stochastic shift in reporter colour and localization. The shift was triggered at larval stage (12 dpf) and intestines were analysed 90 dpi as indicated by green arrow. (B) Representation of multicolour GaudíLxBBW intestinal segment. Note that recombination in the tandem array of the LxBBW cassette results in multiple combinations of colours and localization, unambiguously barcoding each individual cell. (C). High-resolution MuVi-Spim visualization (false colour) of intestinal segment (532 µm) showing multi-colour labelling in the context of the organ.
Fig. 7.
Fig. 7.
Model of ISCs in adult medaka fish. Bulging of the medaka intestinal epithelial surface creates folds and furrows. Proliferatively active intestinal epithelial stem cells are located in furrows at the base of intestinal folds. Apically adjacent, EdU+/pH3+ domain represents transit-amplifying compartment. Differentiated cells are pushed towards fold tip, where they are shed. Lgr4/5/6, axin2a, axin2b and rspo1 stem cell markers show graded expression in intestine at base of folds up to mid-base part. Sox9b expression is confined to base of folds.

References

    1. Aghaallaei N., Bajoghli B., Walter I. and Czerny T. (2005). Duplicated members of the Groucho/Tle gene family in fish. Dev. Dyn. 234, 143-150. 10.1002/dvdy.20510 - DOI - PubMed
    1. Aghaallaei N., Gruhl F., Schaefer C. Q., Wernet T., Weinhardt V., Centanin L., Loosli F., Baumbach T. and Wittbrodt J. (2016). Data from: Identification, visualization and clonal analysis of intestinal stem cells in fish. Dryad Digital Repository. doi:10.5061/dryad.591gf 10.5061/dryad.591gf - DOI - PMC - PubMed
    1. Bajoghli B., Aghaallaei N., Hess I., Rode I., Netuschil N., Tay B. H., Venkatesh B., Yu J. K., Kaltenbach S. L., Holland N. D. et al. (2009). Evolution of genetic networks underlying the emergence of thymopoiesis in vertebrates. Cell 138, 186-197. 10.1016/j.cell.2009.04.017 - DOI - PubMed
    1. Bajoghli B., Guo P., Aghaallaei N., Hirano M., Strohmeier C., McCurley N., Bockman D. E., Schorpp M., Cooper M. D. and Boehm T. (2011). A thymus candidate in lampreys. Nature 470, 90-94. 10.1038/nature09655 - DOI - PubMed
    1. Baker A.-M., Graham T. A., Elia G., Wright N. A. and Rodriguez-Justo M. (2015). Characterization of LGR5 stem cells in colorectal adenomas and carcinomas. Sci. Rep. 5, 8654 10.1038/srep08654 - DOI - PMC - PubMed

Publication types