. 2016 Aug 19:11:4051-63.
doi: 10.2147/IJN.S104686. eCollection 2016.

Targeting T1 and T2 dual modality enhanced magnetic resonance imaging of tumor vascular endothelial cells based on peptides-conjugated manganese ferrite nanomicelles

Affiliations

Targeting T1 and T2 dual modality enhanced magnetic resonance imaging of tumor vascular endothelial cells based on peptides-conjugated manganese ferrite nanomicelles

Mingfu Gong et al. Int J Nanomedicine. .

Abstract

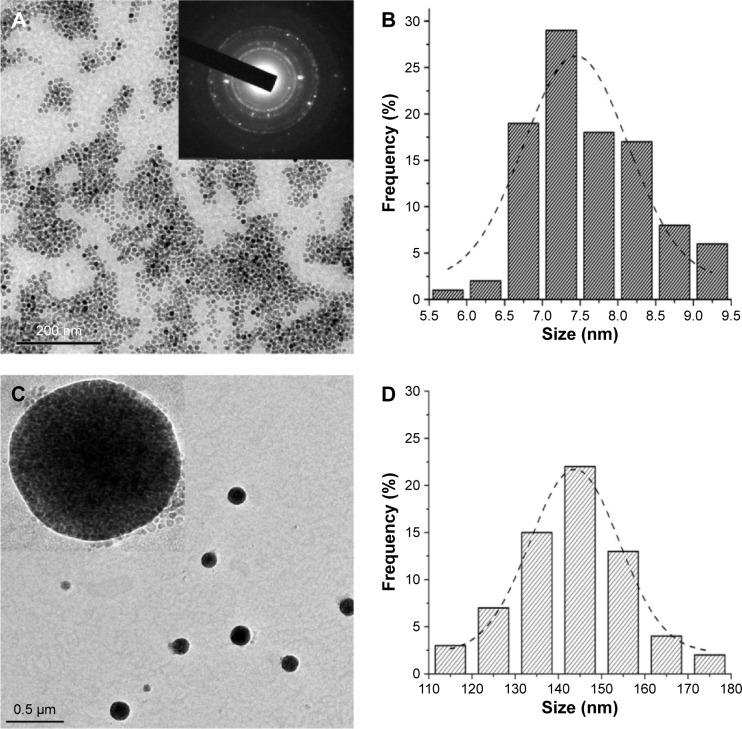
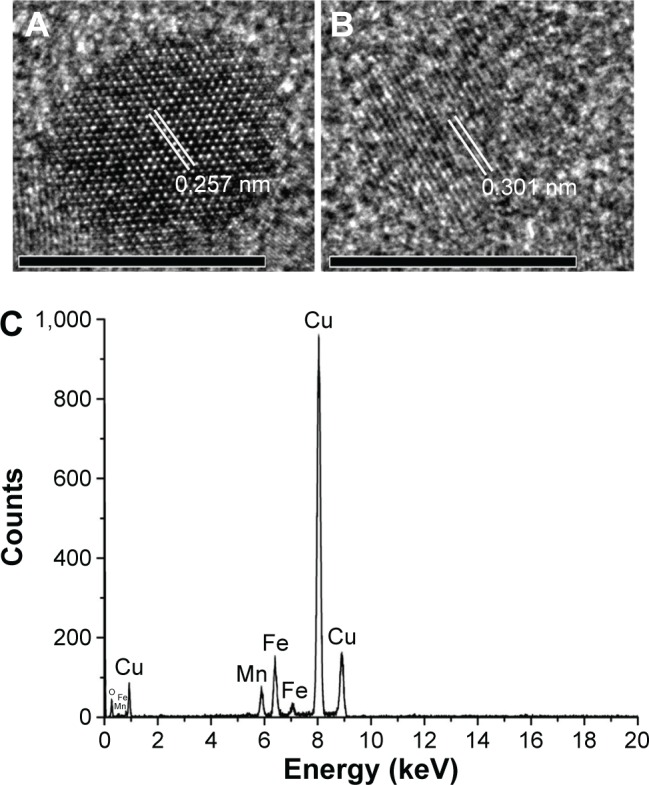
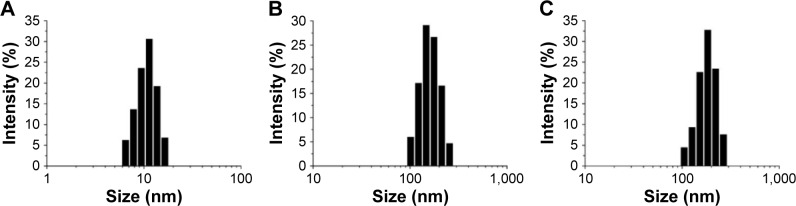
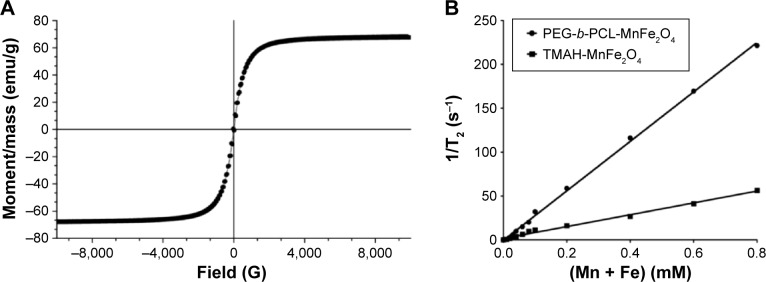
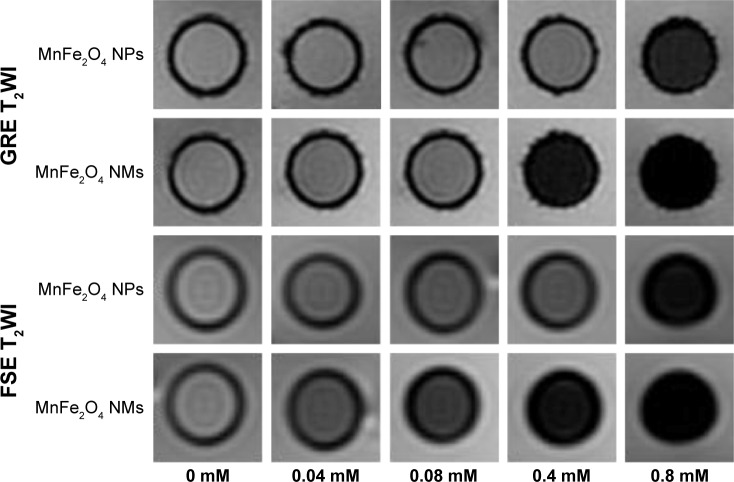
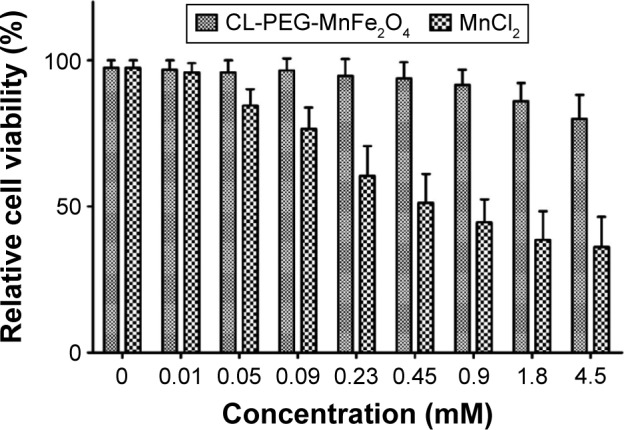
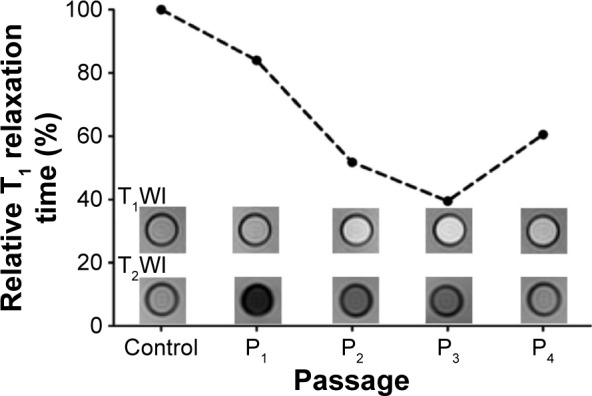
Tumor angiogenesis plays very important roles for tumorigenesis, tumor development, metastasis, and prognosis. Targeting T1/T2 dual modality magnetic resonance (MR) imaging of the tumor vascular endothelial cells (TVECs) with MR molecular probes can greatly improve diagnostic sensitivity and specificity, as well as helping to make an early diagnosis of tumor at the preclinical stage. In this study, a new T1 and T2 dual modality nanoprobe was successfully fabricated. The prepared nanoprobe comprise peptides CL 1555, poly(ε-caprolactone)-block-poly(ethylene glycol) amphiphilic copolymer shell, and dozens of manganese ferrite (MnFe2O4) nanoparticle core. The results showed that the hydrophobic MnFe2O4 nanoparticles were of uniform spheroidal appearance and narrow size distribution. Due to the self-assembled nanomicelles structure, the prepared probes were of high relaxivity of 281.7 mM(-1) s(-1), which was much higher than that of MnFe2O4 nanoparticles (67.5 mM 1 s(-1)). After being grafted with the targeted CD105 peptide CL 1555, the nanomicelles can combine TVECs specifically and make the labeled TVECs dark in T2-weighted MR imaging. With the passage on, the Mn(2+) ions were released from MnFe2O4 and the size decreased gradually, making the signal intensity of the second and third passage of labeled TVECs increased in T1-weighted MR imaging. Our results demonstrate that CL-poly(ethylene glycol)-MnFe2O4 can conjugate TVECs and induce dark and bright contrast in MR imaging, and act as a novel molecular probe for T1- and T2-enhanced MR imaging of tumor angiogenesis.

Keywords: CD105; CL 1555; CL-PEG-MnFe2O4; TVECs; tumor angio genesis.


Figures

Figure 1
Figure 1
TEM characterization of MnFe2O4 NPs and PEG-b-PCL-MnFe2CO4 NMs. Notes: MnFe2O4 NPs were of spheroidal appearance and narrow size distribution (A) and the average size was 7.6±1.0 nm (B). The diameter of PEG-b-PCL-MnFe2O4 NMs was 146.7±25.9 nm (C and D). Inset of (A) is SAED of MnFe2O4 NPs. Inset of (C) is an enlarged TEM of a single PEG-b-PCL-MnFe2O4 NM; magnification ×200,000. Abbreviations: NMs, nanomicelles; NPs, nanoparticles; PEG-b-PCL, polyethylene glycol-block-poly(ε-caprolactone); SAED, selected area electron diffraction; TEM, transmission electron microscopy.
Figure 2
Figure 2
HRTEM and EDS characterization of MnFe2O4 NPs. Notes: HRTEM image of a single MnFe2O4 NP showed that the spacing between the lattice fringes of planes (220) and (311) was around 0.257 nm (A) and 0.301 nm (B). The chemical composition of the nanocrystals was confirmed using EDS measurement. EDS (C) of the prepared NPs indicated the presence of Mn, Fe, and O, and the atomic ratio of Fe to Mn was around 2:1. Scale bar =10 nm. Abbreviations: EDS, energy dispersive spectrometer; HRTEM, high resolution transmission electron microscopy; NPs, nanoparticles.
Figure 3
Figure 3
Hydrodynamic diameter of MnFe2O4 NPs and NMs. Notes: The hydrodynamic diameter of MnFe2O4 dispersed in hexane was 10.3±1.2 nm (A) and that of PEG-b-PCL-MnFe2O4 and CL-PEG-b-PCL-MnFe2O4 was 162.6±28.9 nm (B) and 183.4±26.5 (C), respectively. Abbreviations: NMs, nanomicelles; NPs, nanoparticles; PEG-b-PCL, polyethylene glycol-block-poly(ε-caprolactone).
Figure 4
Figure 4
Hysteresis loop and T2 relaxivity. Notes: The hysteresis loop of MnFe2O4 NPs (A) showed that the magnetization rose nonlinearly with the increase of applied magnetic field and no remaining net magnetization in the absence of an external field, indicating that the MnFe2O4 NPs are superparamagnetic at 300 K. The MnFe2O4 NPs saturation magnetization was 68.2 emu/g (A). The linear fitting of concentration and 1/T2 showed that the r2 of PEG-b-PCL-MnFe2O4 NMs was 281.7 mM−1 s−1, which was ~4.2 times higher than that of TMAH-MnFe2O4 NPs (67.5 mM−1 s−1) (B). Abbreviations: NMs, nanomicelles; NPs, nanoparticles; PEG-b-PCL, polyethylene glycol-block-poly(ε-caprolactone); r2, transverse relaxivity; T2, transverse relaxation time; TMAH, tetramethylammonium hydroxide.
Figure 5
Figure 5
MRI of MnFe2O4 TMAH-MnFe2O4 NPs and PEG-b-PCL-MnFe2O4 NMs. Notes: TMAH-MnFe2O4 NPs and PEG-b-PCL-MnFe2O4 NMs both exhibited a concentration-dependent signal drop in the GRE T2WI and FSE T2WI. The signal intensity decreased gradually with the increase of the metal ions concentration, while NMs induced greater hypointensity at an identical concentration compared with NPs. Abbreviations: MRI, magnetic resonance imaging; NMs, nanomicelles; NPs, nanoparticles; PEG-b-PCL, polyethylene glycol-block-poly(ε-caprolactone); TMAH, tetramethylammonium hydroxide; T2WI, T2-weighted imaging; GRE, gradient echo; FSE, fast spin echo.
Figure 6
Figure 6
Cytotoxicity analysis. Notes: The RCV of TVECs labeled with CL-PEG-MnFe2O4 within 0.9 mM decreased only 7%–9% compared to controls. As the concentration increased, the RCV decreased correspondingly, and a significant decrease of ~19% in viability of TVECs incubated with 4.5 mM CL-PEG-MnFe2O4 solution was measured. On the contrary, a notable decrease of ~15% in viability of TVECs incubated with only 0.05 mM MnCl2 solution was observed. When the TVECs were incubated with MnCl2 solution as high as 4.5 mM, there were only 36.2% cells that survived. Abbreviations: NMs, nanomicelles; PEG, poly(ethylene glycol); RCV, relative cell viability; TVECs, tumor vascular endothelial cells.
Figure 7
Figure 7
ROS of TVECs labeled with CL-PEG-MnFe2O4. Notes: The ROS levels of TVECs labeled with 0.05 (B), 0.23 (C), 0.45 (D), and 0.9 (E) mM CL-PEG-MnFe2O4 solutions were very low and depicted an insignificant elevation of ROS level compared with the control (A). However, a 3.18% higher intracellular ROS level was measured in the cells incubated with 4.5 mM CL-PEG-MnFe2O4 solution compared with 0.9 mM CL-PEG-MnFe2O4 (F). Abbreviations: PEG, poly(ethylene glycol); ROS, reactive oxygen species; TVECs, tumor vascular endothelial cells.
Figure 8
Figure 8
In vitro labeling of TVECs with CL-PEG-MnFe2O4. Notes: Prussian blue staining (200×) of control group (A), TVECs labeled with CL-PEG-MnFe2O4 (B), PEG-b-PCL-MnFe2O4 (C) and the mixture of CL-PEG-MnFe2O4 and CL 1555 peptides (D). It showed that the uptake of CL-PEG-MnFe2O4 was high, while few PEG-b-PCL-MnFe2O4 was engulfed into TVECs. Blocking CD105 with the free CL 1555 peptides also effectively reduced the amount of blue granules in the cytoplasm of TVECs. (EH) showed the T2-weighted MR images of the four groups of cells. Correspondingly, the cells co-cultured with CL-PEG-MnFe2O4 (F) showed a more noticeable signal intensity drop than that with PEG-b-PCL-MnFe2O4 (G) and blocking with the free CL 1555 peptides (H). Abbreviations: MR, magnetic resonance; PEG-b-PCL, polyethylene glycol-block-poly(ε-caprolactone); TVECs, tumor vascular endothelial cells.
Figure 9
Figure 9
MRI of subcultured labeled TVECs. Notes: MRI showed that the signal intensity from P1 to P4 in T2WI gradually increased and P4 had almost equal signal intensity with control group. In T1WI, the signal intensity from P1 to P3 gradually increased and that of P4 came down to the control. The plot showed that the T1 relaxation time from P1 to P4 decreased firstly and then increased back. Abbreviations: MRI, magnetic resonance imaging; T1WI, T1-weighted imaging; T2WI, T2-weighted imaging; TVECs, tumor vascular endothelial cells.

References

    1. Torre LA, Bray F, Siegel RL, Ferlay J, Lortet-Tieulent J, Jemal A. Global cancer statistics, 2012. CA Cancer J Clin. 2015;65(2):87–108. - PubMed
    1. Morgan-Parkes JH. Metastases: mechanisms, pathways, and cascades. AJR Am J Roentgenol. 1995;164(5):1075–1082. - PubMed
    1. Blood CH, Zetter BR. Tumor interactions with the vasculature: angiogenesis and tumor metastasis. Biochim Biophys Acta. 1990;1032(1):89–118. - PubMed
    1. Folkman J, Merler E, Abernathy C, Williams G. Isolation of a tumor factor responsible for angiogenesis. J Exp Med. 1971;133(2):275–288. - PMC - PubMed
    1. Erber R, Thurnher A, Katsen AD, et al. Combined inhibition of VEGF and PDGF signaling enforces tumor vessel regression by interfering with pericyte-mediated endothelial cell survival mechanisms. FASEB J. 2004;18(2):338–340. - PubMed