

Shear-Wave Elastography Assessments of Quadriceps Stiffness Changes prior to, during and after Prolonged Exercise: A Longitudinal Study during an Extreme Mountain Ultra-Marathon
- PMID: 27579699
- PMCID: PMC5007013
- DOI: 10.1371/journal.pone.0161855
Shear-Wave Elastography Assessments of Quadriceps Stiffness Changes prior to, during and after Prolonged Exercise: A Longitudinal Study during an Extreme Mountain Ultra-Marathon
Erratum in
-
Correction: Shear-Wave Elastography Assessments of Quadriceps Stiffness Changes prior to, during and after Prolonged Exercise: A Longitudinal Study during an Extreme Mountain Ultra-Marathon.PLoS One. 2016 Nov 30;11(11):e0167668. doi: 10.1371/journal.pone.0167668. eCollection 2016. PLoS One. 2016. PMID: 27902782 Free PMC article.
Abstract
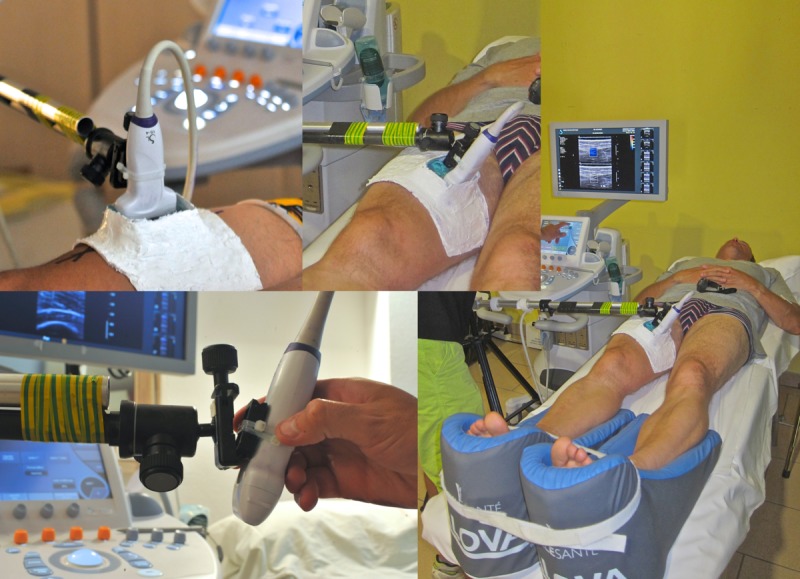
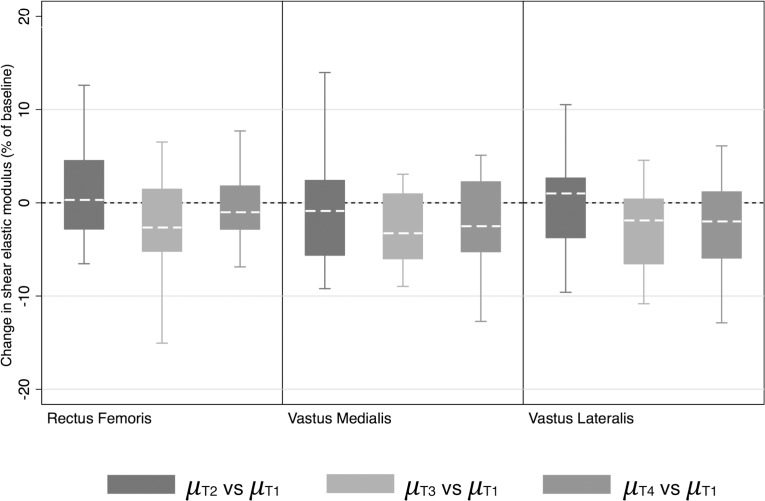
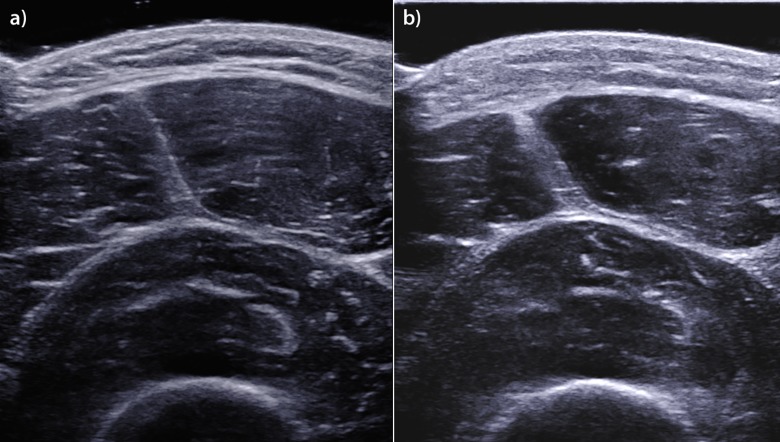
In sports medicine, there is increasing interest in quantifying the elastic properties of skeletal muscle, especially during extreme muscular stimulation, to improve our understanding of the impact of alterations in skeletal muscle stiffness on resulting pain or injuries, as well as the mechanisms underlying the relationships between these parameters. Our main objective was to determine whether real-time shear-wave elastography (SWE) can monitor changes in quadriceps muscle elasticity during an extreme mountain ultra-marathon, a powerful mechanical stress model. Our study involved 50 volunteers participating in an extreme mountain marathon (distance: 330 km, elevation: +24,000 m). Quantitative SWE velocity and shear modulus measurements were performed in most superficial quadriceps muscle heads at the following 4 time points: before the race, halfway through the race, upon finishing the race and after recovery (+48 h). Blood biomarker levels were also measured. A significant decrease in the quadriceps shear modulus was observed upon finishing the race (3.31±0.61 kPa) (p<0.001) compared to baseline (3.56±0.63 kPa), followed by a partial recovery +48 h after the race (3.45±0.6 kPa) (p = 0.002) across all muscle heads, as well as for each of the following three muscle heads: the rectus femoris (p = 0.003), the vastus medialis (p = 0.033) and the vastus lateralis (p = 0.001). Our study is the first to assess changes in muscle stiffness during prolonged extreme physical endurance exercises based on shear modulus measurements using non-invasive SWE. We concluded that decreases in stiffness, which may have resulted from quadriceps overuse in the setting of supra-physiological stress caused by the extreme distance and unique elevation of the race, may have been responsible for the development of inflammation and muscle swelling. SWE may hence represent a promising tool for monitoring physiologic or pathological variations in muscle stiffness and may be useful for diagnosing and monitoring muscle changes.
Conflict of interest statement
Supersonic Imagine contributed to this study by providing two of their ultrasound diagnostic systems equipped with the most advanced SWE module during the Tor des Geants. The authors also thank Sysmex for their support in providing a pocH-100i™ automated hematology analyzer (Sysmex, Villepinte, France). There are no patents, products in development or marketed products to declare. This does not alter our adherence to all the PLOS ONE policies on sharing data and materials. These industrial partners had no role in study design, data collection and analysis, decision to publish, or preparation of the manuscript.
Figures

References
-
- Féasson L, Camdessanché JP, Mandhi El L, Calmels P, Millet GY. Fatigue and neuromuscular diseases. Annales De Réadaptation Et De Médecine Physique: Revue Scientifique De La Société Française De Rééducation Fonctionnelle De Réadaptation Et De Médecine Physique. 2006;49: 289–300, 375–384 10.1016/j.annrmp.2006.04.015 - DOI - PubMed
-
- Dietz V, Quintern J, Berger W. Electrophysiological studies of gait in spasticity and rigidity. Evidence that altered mechanical properties of muscle contribute to hypertonia. Brain: A Journal of Neurology. 1981;104: 431–449. - PubMed
-
- Lehmann JF, Price R, deLateur BJ, Hinderer S, Traynor C. Spasticity: quantitative measurements as a basis for assessing effectiveness of therapeutic intervention. Archives of Physical Medicine and Rehabilitation. 1989;70: 6–15. - PubMed
MeSH terms
Substances
LinkOut - more resources
Full Text Sources
Other Literature Sources
