

Regional Variation of Cost of Care in the Last 12 Months of Life in Switzerland: Small-area Analysis Using Insurance Claims Data
- PMID: 27579912
- PMCID: PMC5266421
- DOI: 10.1097/MLR.0000000000000634
Regional Variation of Cost of Care in the Last 12 Months of Life in Switzerland: Small-area Analysis Using Insurance Claims Data
Abstract
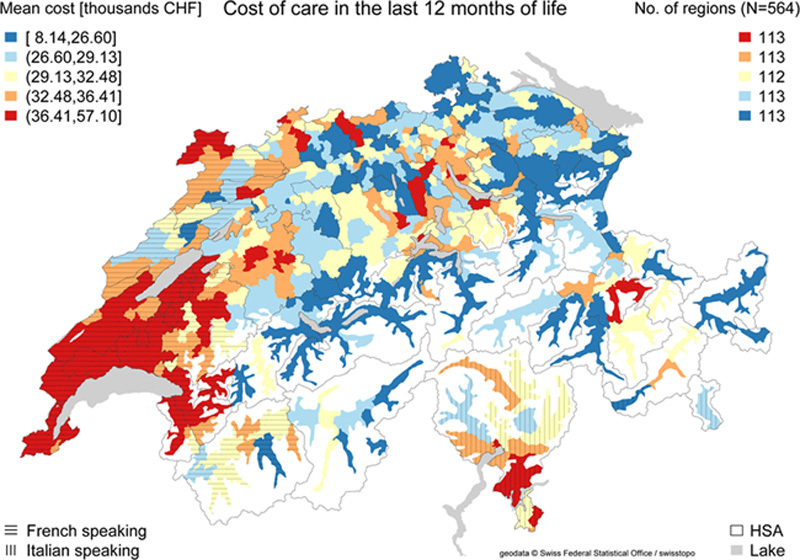
Background: Health care spending increases sharply at the end of life. Little is known about variation of cost of end of life care between regions and the drivers of such variation. We studied small-area patterns of cost of care in the last year of life in Switzerland.
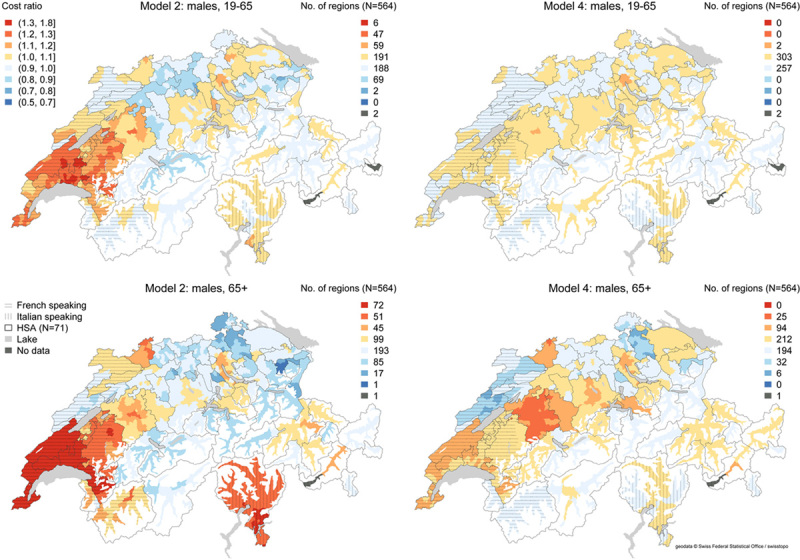
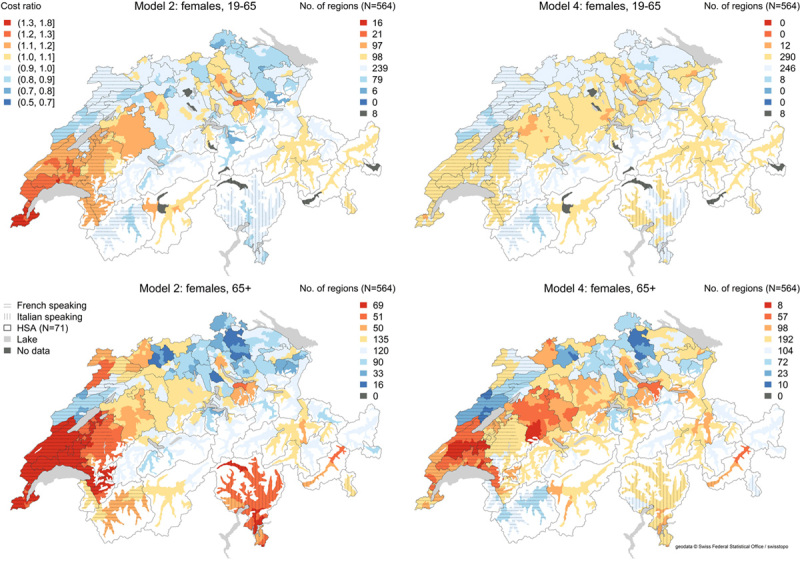
Methods: We used mandatory health insurance claims data of individuals who died between 2008 and 2010 to derive cost of care. We used multilevel regression models to estimate differences in costs across 564 regions of place of residence, nested within 71 hospital service areas. We examined to what extent variation was explained by characteristics of individuals and regions, including measures of health care supply.
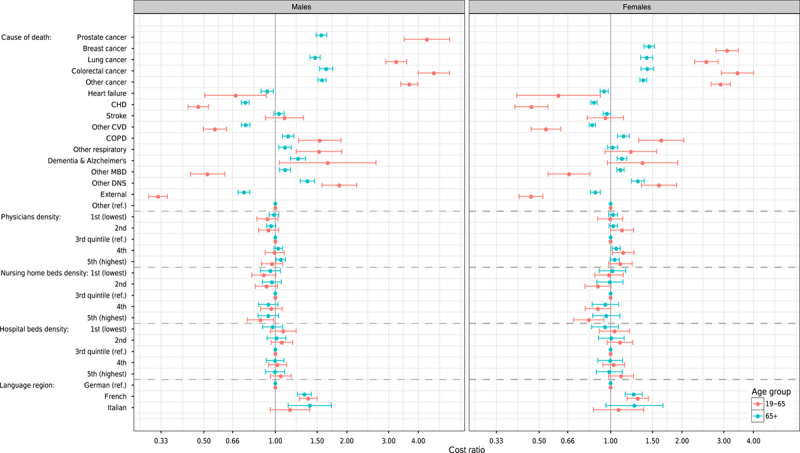
Results: The study population consisted of 113,277 individuals. The mean cost of care during last year of life was 32.5k (thousand) Swiss Francs per person (SD=33.2k). Cost differed substantially between regions after adjustment for patient age, sex, and cause of death. Variance was reduced by 52%-95% when we added individual and regional characteristics, with a strong effect of language region. Measures of supply of care did not show associations with costs. Remaining between and within hospital service area variations were most pronounced for older females and least for younger individuals.
Conclusions: In Switzerland, small-area analysis revealed variation of cost of care during the last year of life according to linguistic regions and unexplained regional differences for older women. Cultural factors contribute to the delivery and utilization of health care during the last months of life and should be considered by policy makers.
Conflict of interest statement
The authors declare no conflict of interest.
Figures
Similar articles
-
Death at no cost? Persons with no health insurance claims in the last year of life in Switzerland.BMC Health Serv Res. 2018 Mar 14;18(1):178. doi: 10.1186/s12913-018-2984-2. BMC Health Serv Res. 2018. PMID: 29540161 Free PMC article.
-
Regional differences in healthcare costs at the end of life: an observational study using Swiss insurance claims data.Int J Public Health. 2020 Jul;65(6):969-979. doi: 10.1007/s00038-020-01428-w. Epub 2020 Jul 15. Int J Public Health. 2020. PMID: 32671494
-
End-of-Life Medical Costs of Medicaid Cancer Patients.Health Serv Res. 2015 Jun;50(3):690-709. doi: 10.1111/1475-6773.12259. Epub 2014 Nov 25. Health Serv Res. 2015. PMID: 25424134 Free PMC article.
-
Association of healthcare expenditures with aggressive versus palliative care for cancer patients at the end of life: a cross-sectional study using claims data in Japan.Int J Qual Health Care. 2014 Feb;26(1):79-86. doi: 10.1093/intqhc/mzt081. Epub 2013 Nov 13. Int J Qual Health Care. 2014. PMID: 24225269
-
End-of-life cohorts from the Dartmouth Institute: risk adjustment across health care markets, the relative efficiency of chronic illness utilization, and patient experiences near the end of life.Res Health Serv Reg. 2024 Mar 29;3(1):4. doi: 10.1007/s43999-024-00039-9. Res Health Serv Reg. 2024. PMID: 39177848 Free PMC article. Review.
Cited by
-
Regional Variation in End-of-life Care Just Before Death Among the Oldest Old in Japan: A Descriptive Study.J Epidemiol. 2024 Dec 5;34(12):600-604. doi: 10.2188/jea.JE20230364. Epub 2024 Oct 31. J Epidemiol. 2024. PMID: 38797673 Free PMC article.
-
Regional variation in hip and knee arthroplasty rates in Switzerland: A population-based small area analysis.PLoS One. 2020 Sep 21;15(9):e0238287. doi: 10.1371/journal.pone.0238287. eCollection 2020. PLoS One. 2020. PMID: 32956363 Free PMC article.
-
Death at no cost? Persons with no health insurance claims in the last year of life in Switzerland.BMC Health Serv Res. 2018 Mar 14;18(1):178. doi: 10.1186/s12913-018-2984-2. BMC Health Serv Res. 2018. PMID: 29540161 Free PMC article.
-
Impact of socioeconomic status on end-of-life costs: a systematic review and meta-analysis.BMC Palliat Care. 2020 Mar 23;19(1):35. doi: 10.1186/s12904-020-0538-y. BMC Palliat Care. 2020. PMID: 32293403 Free PMC article.
-
Initial prescriptions and medication switches of biological products: an analysis of prescription pathways and determinants in the Swiss healthcare setting.BMJ Open. 2023 Nov 21;13(11):e077454. doi: 10.1136/bmjopen-2023-077454. BMJ Open. 2023. PMID: 37989386 Free PMC article.
References
-
- Biller-Andorno N, Zeltner T. Individual responsibility and community solidarity—The Swiss Health Care System. N Engl J Med. 2015;373:2193–2197. - PubMed
-
- Organisation for Economic Cooperation and Development. OECD Reviews of Health Systems: Switzerland, 2011.
-
- Felder S, Meier M, Schmitt H. Health care expenditure in the last months of life. J Health Econ. 2000;19:679–695. - PubMed
-
- Organisation for Economic Cooperation and Development. Geographic variations in health care: what do we know and what can be done to improve health system preformance? OECD Health Policy Studies. 2014.
MeSH terms
LinkOut - more resources
Full Text Sources
Other Literature Sources
