. 2016 Aug 31;12(8):e1005860.
doi: 10.1371/journal.ppat.1005860. eCollection 2016 Aug.

Interactions of Prototype Foamy Virus Capsids with Host Cell Polo-Like Kinases Are Important for Efficient Viral DNA Integration

Affiliations

Interactions of Prototype Foamy Virus Capsids with Host Cell Polo-Like Kinases Are Important for Efficient Viral DNA Integration

Irena Zurnic et al. PLoS Pathog. .

Erratum in

Abstract

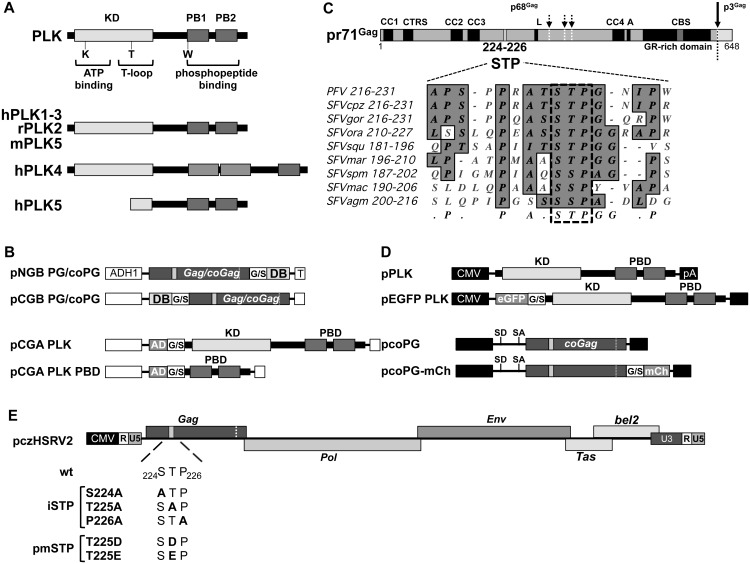
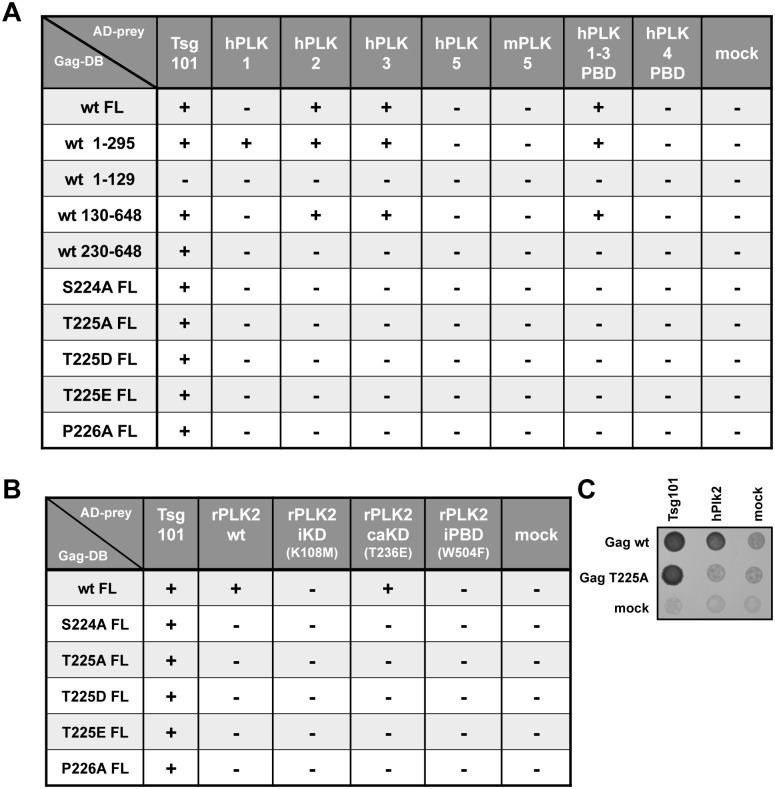
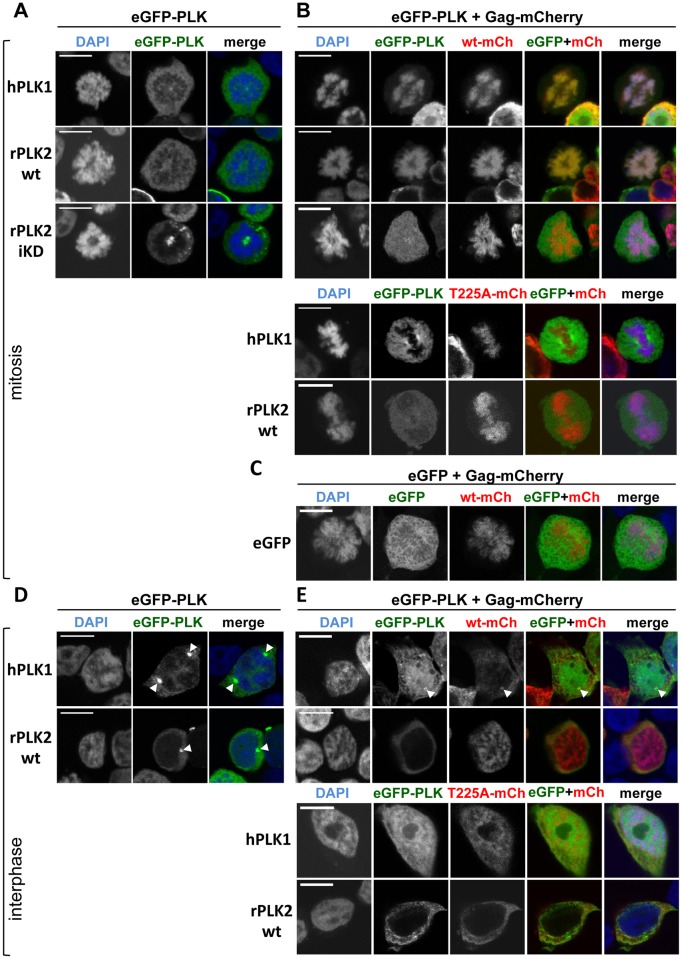
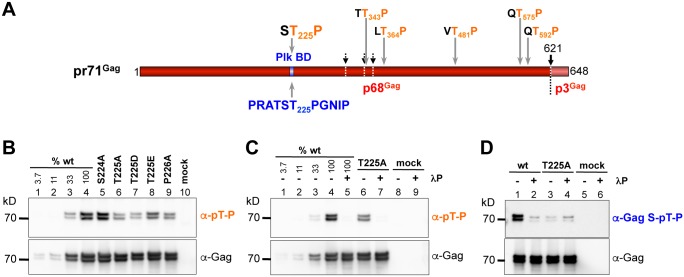
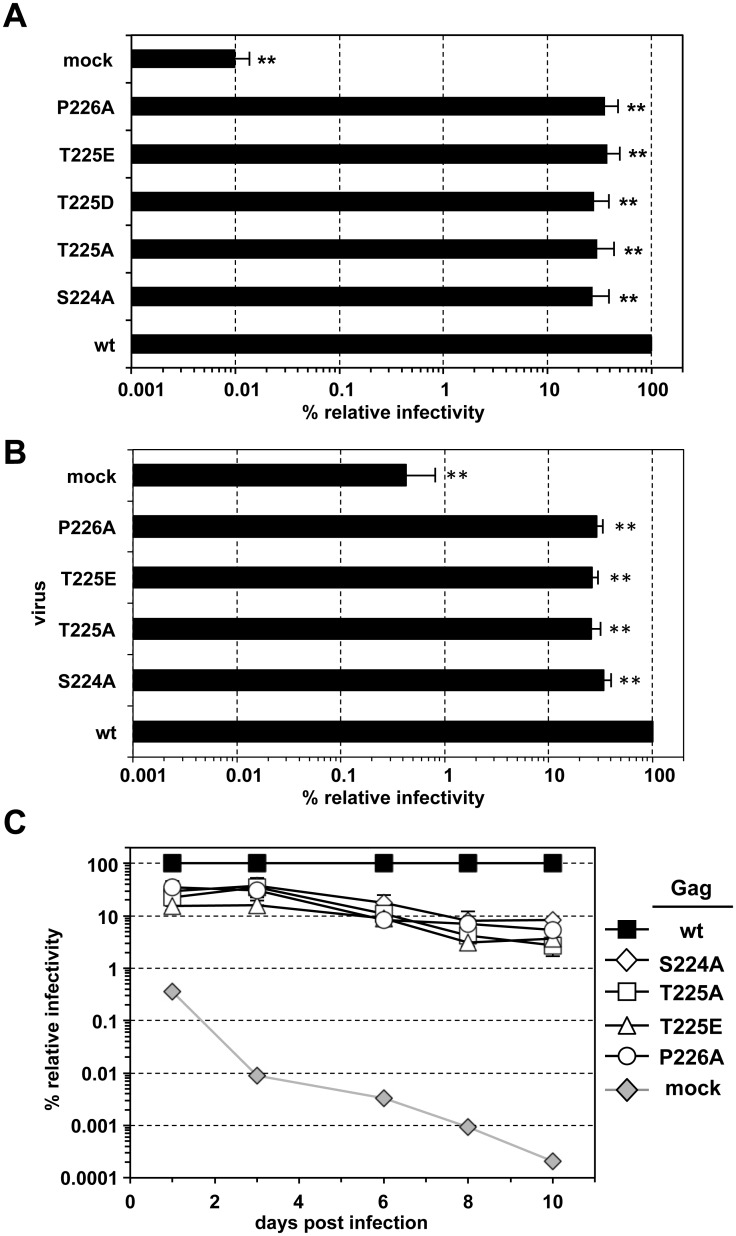
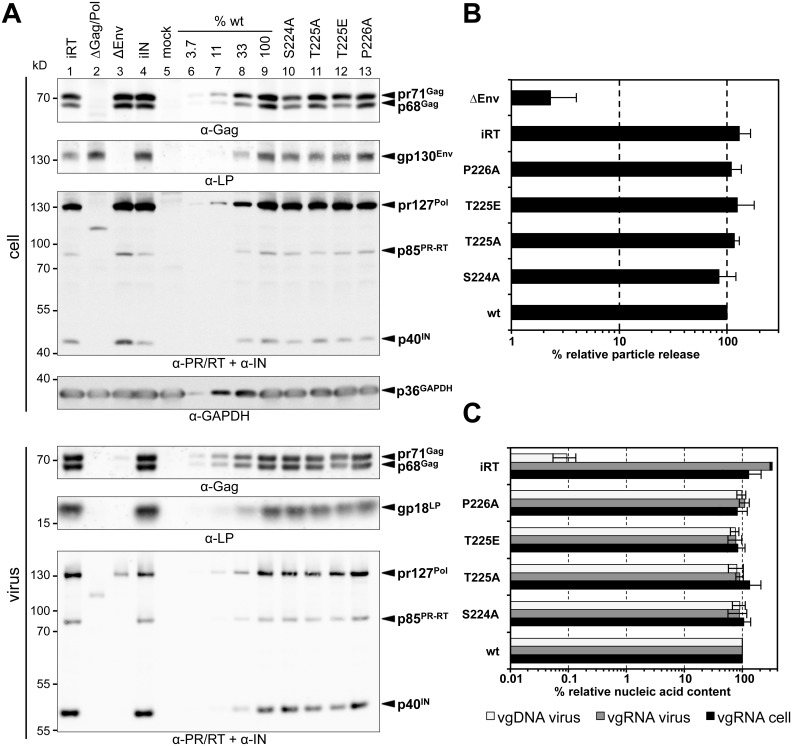
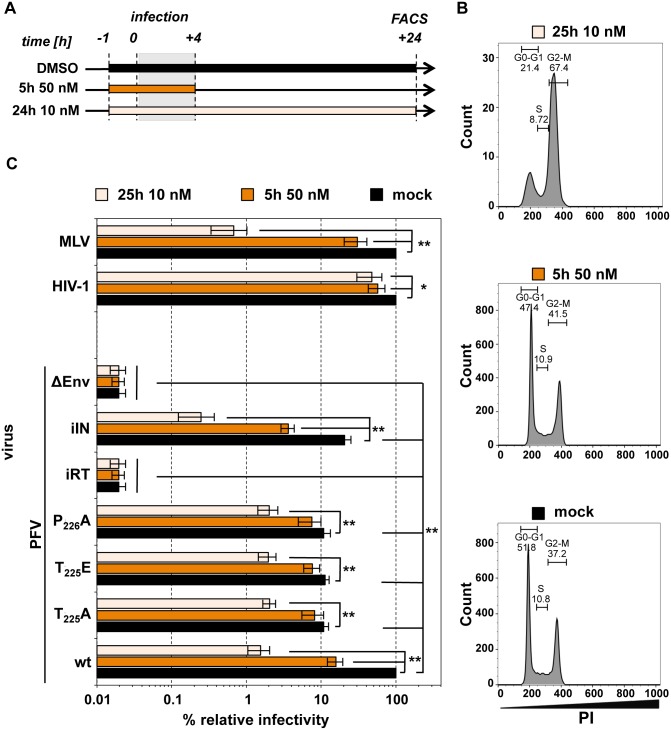
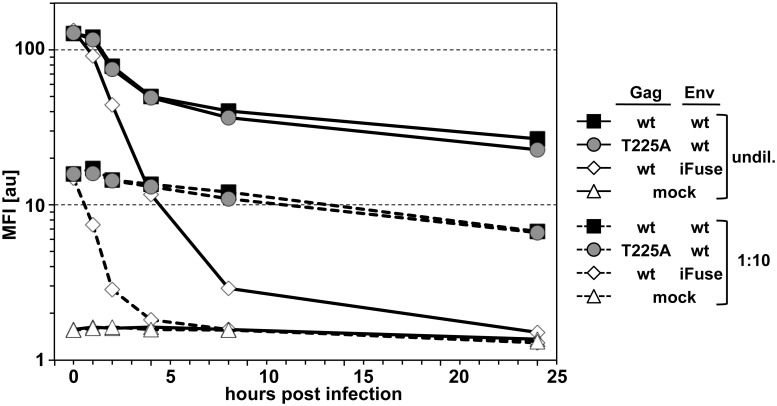
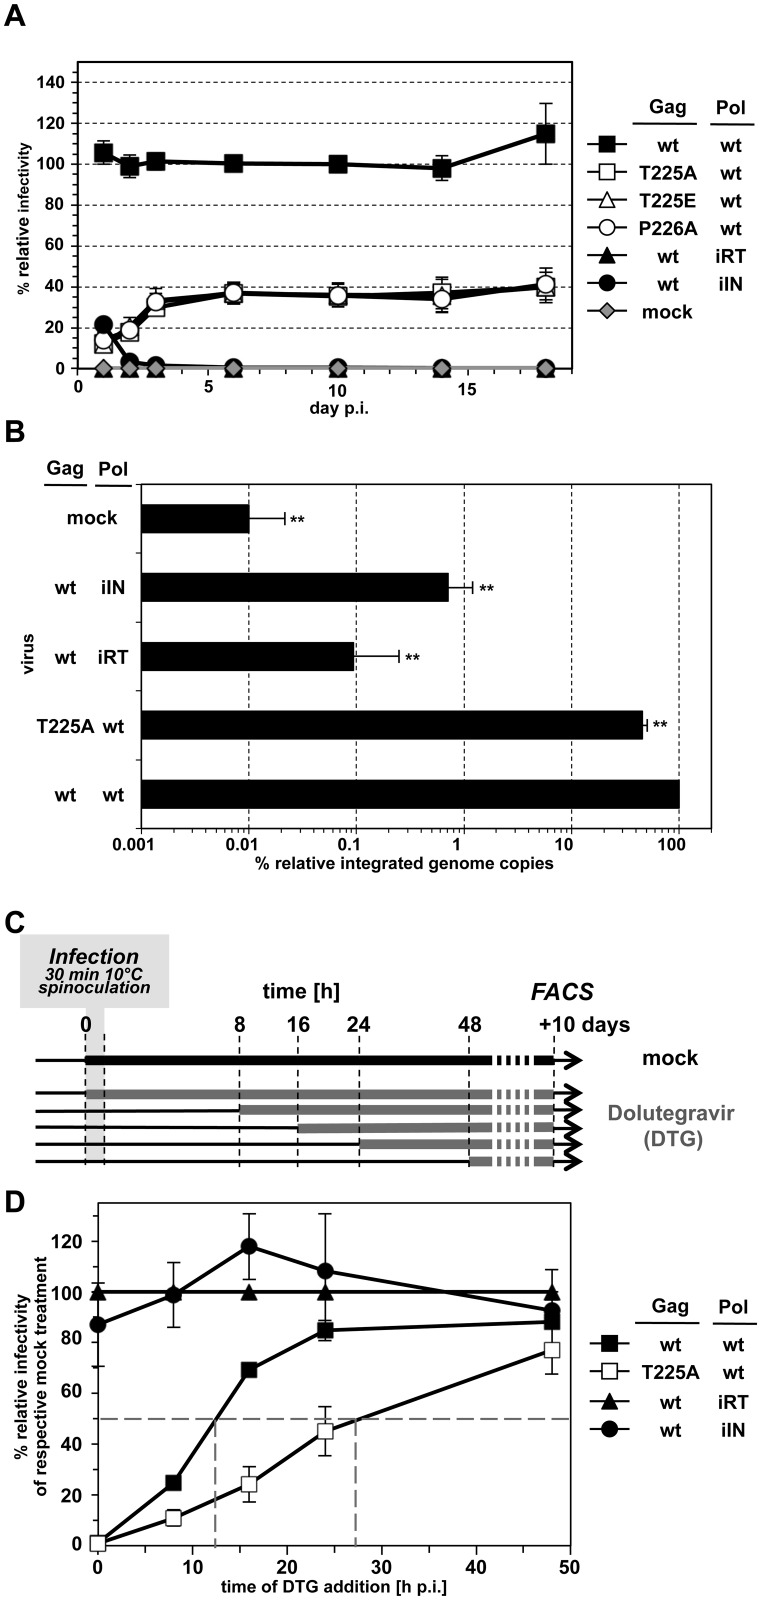
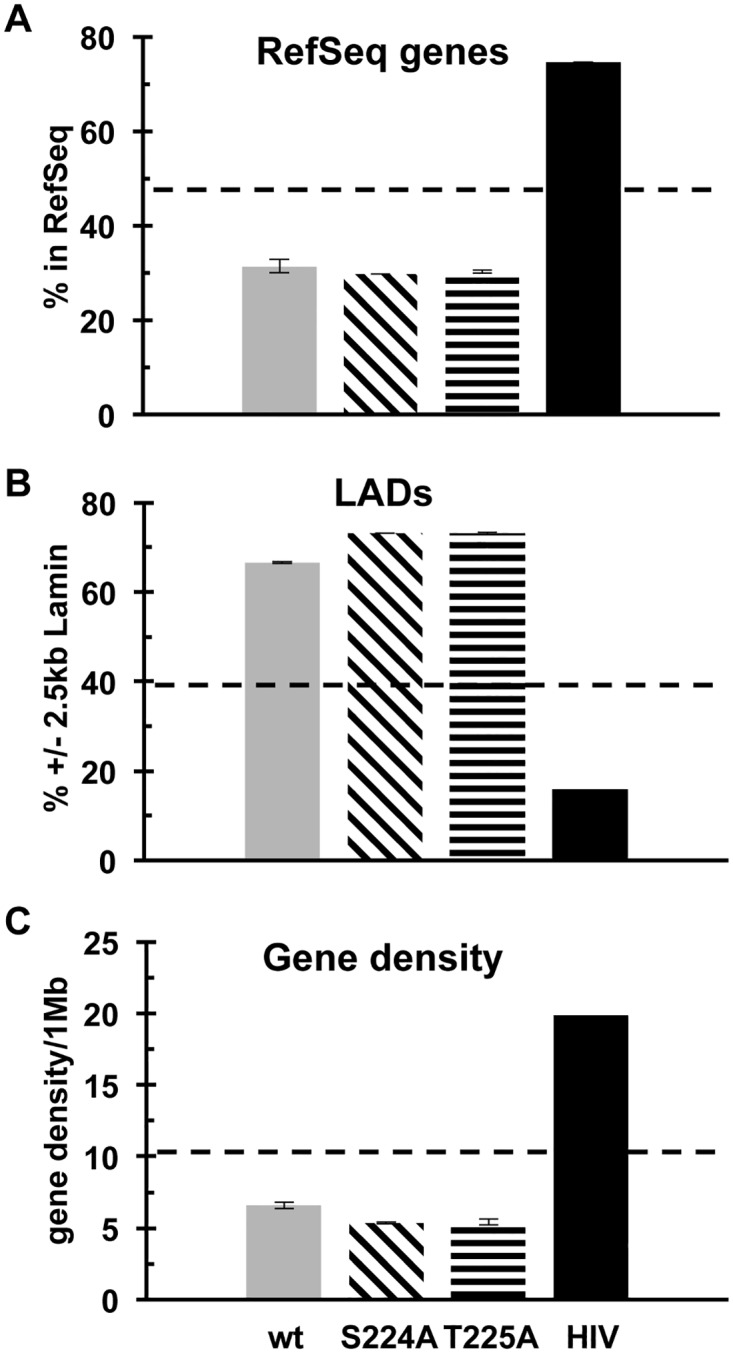
Unlike for other retroviruses, only a few host cell factors that aid the replication of foamy viruses (FVs) via interaction with viral structural components are known. Using a yeast-two-hybrid (Y2H) screen with prototype FV (PFV) Gag protein as bait we identified human polo-like kinase 2 (hPLK2), a member of cell cycle regulatory kinases, as a new interactor of PFV capsids. Further Y2H studies confirmed interaction of PFV Gag with several PLKs of both human and rat origin. A consensus Ser-Thr/Ser-Pro (S-T/S-P) motif in Gag, which is conserved among primate FVs and phosphorylated in PFV virions, was essential for recognition by PLKs. In the case of rat PLK2, functional kinase and polo-box domains were required for interaction with PFV Gag. Fluorescently-tagged PFV Gag, through its chromatin tethering function, selectively relocalized ectopically expressed eGFP-tagged PLK proteins to mitotic chromosomes in a Gag STP motif-dependent manner, confirming a specific and dominant nature of the Gag-PLK interaction in mammalian cells. The functional relevance of the Gag-PLK interaction was examined in the context of replication-competent FVs and single-round PFV vectors. Although STP motif mutated viruses displayed wild type (wt) particle release, RNA packaging and intra-particle reverse transcription, their replication capacity was decreased 3-fold in single-cycle infections, and up to 20-fold in spreading infections over an extended time period. Strikingly similar defects were observed when cells infected with single-round wt Gag PFV vectors were treated with a pan PLK inhibitor. Analysis of entry kinetics of the mutant viruses indicated a post-fusion defect resulting in delayed and reduced integration, which was accompanied with an enhanced preference to integrate into heterochromatin. We conclude that interaction between PFV Gag and cellular PLK proteins is important for early replication steps of PFV within host cells.


Conflict of interest statement

The authors have declared that no competing interests exist.

Figures

Fig 1
Fig 1. PFV Gag and PLK constructs utilized in this study.
(A) The structures of human, rat and mouse PLK proteins addressed are schematically illustrated, highlighting the amino acids required for different functions (ATP-binding and hydrolysis; T-loop for kinase autoactivation; substrate S-pS/pT-P motif recognition and binding). KD: kinase domain; PB1-2: polo boxes 1 and 2 (comprising the PB domain (PBD)). (B) Schematic outline of the yeast PFV Gag- and PLK-encoding expression constructs. (C) Schematic representation of full-length PFV Gag, with functional domains and the central S224-T225-P226 motif highlighted. The alignment with the central STP or SSP motives of other primate foamy virus (simian FV; SFV) Gag proteins is shown below. The origin of SFV isolates is noted as follows, cpz: chimpanzee; gor: gorilla; ora: orangutan; squ: squirrel monkey; mar: marmoset; spm: spider monkey; mac: macaque; agm: African green monkey. Primary and secondary proteolytic cleavage sites in the PFV Gag protein are highlighted by full- and dashed arrows, respectively. (D) Schematic outline of the mammalian PFV Gag- and PLK-encoding expression constructs. (E) Schematic outline of proviral PFV expression constructs, highlighting the introduced STP motif amino acid exchanges. CC1-CC4: coiled-coil domains 1–4; CTRS: cytoplasmic targeting and retention signal; L: late domain; A: assembly domain; GR-rich domain: glycine-arginine-rich domain; solid vertical arrow: primary Gag processing site; dashed vertical arrows: secondary Gag processing sites; wt; wild type; Gag: authentic gag ORF; coGag; expression-optimized gag ORF; ADH1: yeast alcohol dehydrogenase 1 promoter; AD: GAL4 activation domain; DB: GAL4 DNA-binding domain; T: yeast terminator sequence; G/S: glycine serine linker; CMV: cytomegalovirus promoter; R: PFV long terminal repeat (LTR) repeat region; U5: PFV LTR unique 5’ region; U3: PFV LTR unique 3’ region; eGFP: enhanced green fluorescent protein; mCh: mCherry; pA: polyadenylation sequence; hPLK1-5: human PLKs1-5; rPLK2: rat PLK2; mPLK5: mouse PLK5.
Fig 2
Fig 2. Y2H analysis of PFV Gag-PLK interactions.
Different variants of the PFV Gag protein (full length (FL), indicated truncations and inactivating (iSTP) or phosphomimetic (pmSTP) point mutants) were tested for interaction with human (hPLK), mouse (mPLK) and rat PLK proteins (rPLK) or, where indicated, respective PBDs. PFV Gag was provided fused to the GAL4 DB (Gag-DB) in combination with Tsg101- or PLK proteins fused to GAL4 AD (AD-Prey). Presence and absence of interaction between each partner is marked by either “+” or “-“, respectively. Data of n = 4 independent experiments are summarized. (A) Results of PFV Gag interaction with human and mouse PLK proteins. (B) Results of PFV Gag interaction with rPLK2 variants. (C) Readout system of experimental results, assessing transformed yeast growth on selective media, exemplified by DB-Gag wt, DB-Gag T225A or empty bait in combination with AD-Tsg101, AD-hPLK2 or empty prey. iKD: inactive kinase domain; caKD: constitutively active kinase domain; iPBD: inactive polo-box domain.
Fig 3
Fig 3. Localization of ectopically-expressed, fluorescently-tagged PFV Gag and PLK proteins in mammalian cells.
eGFP-PLK-expressing constructs alone (left panels) or a combination of eGFP or eGFP-PLK and Gag-mCherry encoding expression constructs (right panels) were transfected into 293T cells, as indicated above each panel of images. Forty-eight hours post-transfection, protein localization patterns were examined in fixed cells by confocal laser scanning microscopy (CLSM). Channels of the individual fluorescence micrographs are indicated on top, and the PLK variant used is indicated on the left. White arrowheads indicate fluorescent PLK foci presumed to be centrosomes. Data are representative of n = 5 independent experiments. (A) Localization patterns of eGFP-tagged PLK proteins (detected in eGFP-PLK channel) in mitotic cells transfected with the corresponding constructs. (B) Localization patterns of eGFP-tagged PLK and mCherry-tagged Gag proteins detected in corresponding channels (Gag variant used labeled either as wt-mCh or T225A-mCh) in mitotic cells. (C) Localization of eGFP and wt Gag-mCherry in mitotic cells. (D) Localization patterns of eGFP-tagged PLK proteins (detected in eGFP-PLK channel) in interphase cells transfected with the corresponding constructs. (E) Localization patterns of eGFP-tagged PLK and mCherry-tagged Gag proteins detected in corresponding channels (Gag variant used labeled either as wt-mCh or T225A-mCh) in interphase cells. Scale bar: 10 μm.
Fig 4
Fig 4. Analysis of PFV Gag phosphorylation status in purified virus particles.
PFV virions were produced by transient transfection of the four-component PFV vector system, containing the pcoPG4 variants denoted above each of the blots, into 293T cells. Viral particles were pelleted from cell-free tissue culture supernatants by ultracentrifugation through 20% sucrose and equal amounts of particle lysates separated by SDS-PAGE were blotted to nitrocellulose membranes. The phosphorylation status of the particle-associated Gag variants was determined by the corresponding antibodies specific for different phosphorylated amino acid motives as indicated. Data are representative of n = 4 independent experiments. (A) Schematic illustration of PFV Gag protein organization with highlighted putative T-P motifs and surrounding amino acids recognized when phosphorylated at the threonine residue by either the α-pT-P (orange letters) or α-Gag S-pT-P (blue letters) phosphopeptide-specific antibody. Solid vertical arrow: primary Gag processing site; dashed vertical arrows: secondary Gag processing sites; (B) Detection of the phosphorylated Thr-Pro (pT-P) motives in PFV Gag wt, iSTP and pmSTP virus particles (α-pT-P antiserum) and comparison with the total Gag content in the particle lysates (α-Gag). (C) Comparison of the pT-P phosphorylation status in the wt and T225A PFV particles in the absence (-) or presence (+) of the Lambda Phosphatase (λP) pretreatment of viral proteins. (D) Comparison of the PFV Gag-associated S-T-P motif phosphorylation status (α-Gag S-pT-P; detected with the corresponding PFV Gag-specific antibody) in virus preparations containing either the wt or the T225A Gag variant in the absence (-) or presence (+) of the λP pretreatment.
Fig 5
Fig 5. Analysis of PFV wt, iSTP- and pmSTP virions in single-round- and multiple-round infection experiments.
(A) PFV virions were produced by transient transfection of 293T cells with the four-component PFV vector system, containing either the wt Gag or one of the denoted iSTP- and pmSTP Gag variants. Titers of harvested viruses were determined by flow cytometry analysis of infected HT1080 target cells three days post-infection. The mean values and standard deviation for each supernatant were calculated from samples of cells infected with serial virus dilutions as described in Material and Methods. The values obtained using wt PFV Gag expression plasmids were arbitrarily set to 100%. Relative means and standard deviations normalized for Gag content (except mock) from independent experiments (n = 4–9) are shown. Differences between means of wt virus and the individual mutants were analyzed by Welch’s t test (**, p<0.01). Absolute titers of wt supernatants ranged between 1.2 x 10⁶ and 1.2 x 10⁷ eGFP ffu/ml. (B) Replication-competent PFV virions were produced by transient transfection of proviral expression vectors, containing either the wt Gag or one of the denoted iSTP- and pmSTP Gag variants into 293T cells. Viruses were harvested two days post-transfection and used to infect HT1080 PLNE target cells. Titers were determined by flow cytometry analysis one day post-infection. The values obtained using wt PFV Gag expression plasmids were arbitrarily set to 100%. Relative means and standard deviations normalized for Gag content (except mock) from independent experiments (n = 3–8) are shown. Differences between means of wt virus and the individual mutants were analyzed by Welch’s t test (**, p<0.01). Absolute titers of wt supernatants ranged between 1.7 x 10⁴ and 7 x 10⁴ eGFP ffu/ml. (C) Titers of iSTP- and pmSTP mutant PFV particles relative to wt over multiple rounds of target cell infection. Viruses were produced and harvested as described in panel B and Gag content normalized amounts of viral supernatants were used to infect HT1080 PLNE in serial dilutions. At different time points post-infection (as indicated on the x-axis) cells were harvested for flow cytometry analysis to determine viral titers. The values obtained using wt PFV supernatants at each time point were arbitrarily set to 100%. Relative means and standard deviations from two independent experiments are shown.
Fig 6
Fig 6. Biochemical characterization of the PFV production levels, particle release and nucleic acid contents in producer cells and released virions.
Replication-competent PFV virions were produced by transient transfection of proviral expression constructs, containing either the wt Gag (wt) or one of the denoted iSTP- (S224A, T225A, P226A) or pmSTP (T225E) Gag variants into 293T cells. As controls, constructs containing wt Gag in combination with Pol with enzymatically inactive reverse transcriptase (iRT) or inactive integrase (iIN) domain, as well as constructs harboring translationally inactivated ORFs for Gag and Pol (ΔGag/Pol) or Env (ΔEnv) were used. The mock control (mock) included cells transfected with pUC19 alone. (A) Representative Western blot analysis of viral particles (virus) purified from 293T cell culture supernatant by ultracentrifugation through 20% sucrose and 293T cell lysates (cell). PFV proteins were detected using polyclonal antibodies specific for PFV Gag (α-Gag) or PFV Env LP (α-LP), a mixture of hybridoma supernatants specific for PFV Pol PR/RT and IN (α-PR/RT + α-IN), or a commercial monoclonal antibody specific for GAPDH (α-GAPDH). Serial dilutions of the wt samples (wt; lanes 6–9) were quantified to determine their relative protein contents compared to other samples. The identity of the individual proteins detected is indicated on the right. (B) Viral particle release was determined by quantitative Western blot analysis of viral particle lysates. Mean values and standard deviations (n = 3) are shown as relative values compared to the wt control and normalized for cellular expression levels. (C) Quantification of PFV vgRNA in virus producing cells (vgRNA cell) and released particles (vgRNA virus) and particle-associated vgDNA (vgDNA virus). Mean values and standard deviation (n = 3–8) are shown as relative values compared to the wt control. Cellular values were normalized to GAPDH levels, viral particle values were normalized for Gag content.
Fig 7
Fig 7. Effect of enzymatic PLK inhibition on the titers of PFV, HIV-1 and MLV virions.
(A) Experimental outline. HT1080 target cells were infected with serial dilutions of the individual virus supernatants as indicated in the presence of the vehicle control (DMSO) or one of two BI-2536 concentrations. (B) Cell cycle profiles of mock infected cell populations of the three experimental groups determined by propidium iodide staining 25 h from the start of treatment (with either DMSO or BI-2536). (C) Virus infectivity was determined 24 h post-infection by flow cytometry analysis of infected target cell populations. The values obtained using wt variants of PFV, HIV-1, or MLV supernatants in combination with vehicle control treatment were arbitrarily set to 100%. Absolute titers of wt supernatants ranged between 5.0 x 10⁵ and 8.0 x 10⁵ (PFV), 1.9 x 10⁶ and 3.9 x 10⁶ (HIV), and 1.5 x 10⁷ and 2.5 x 10⁷ eGFP ffu/ml (MLV). Relative means and standard deviations from three independent experiments are shown. Differences between means of the respective wt viruses in combination with vehicle control and the individual mutants or treatment regimen with BI-2536 were analyzed by Welch’s t test (*, p<0.05; **, p<0.01).
Fig 8
Fig 8. Analysis of wt and mutant PFV attachment, uptake and Gag protein stability.
Replication-deficient PFV supernatants were harvested after transient transfection of the PFV four-component vector system, containing the eGFP-tagged Gag p68 wt (wt) or T225A (T225A) variants in combination with wt (wt) or fusion-incompetent Env (iFuse) into 293T cells. HT1080 cells were synchronously infected with undiluted (undil.) and ten-fold diluted (1:10) PFV supernatants and eGFP MFI values were measured by flow cytometry at indicated time points until 24 h post-transduction. Representative data shown are from one out of three independent experiments.
Fig 9
Fig 9. Integration efficiency and dynamics of PFV wt and STP mutant virions.
(A) Virus infectivity was determined at different time points post-infection by flow cytometry analysis of infected target cell populations as indicated. The values obtained using wt PFV Gag expression plasmids were arbitrarily set to 100%. Relative means and standard deviations normalized for Gag content (except mock) from two independent experiments in duplicates are shown. Absolute titers of wt supernatants ranged between 5.7 x 10⁴ and 9.3 x 10⁴ (1 day p.i.), 8.6 x 10⁵ and 1.5 x 10⁶ eGFP ffu/ml (18 day p.i.). (B) Comparison of wt and STP mutant integration efficiencies. HT1080 target cells were infected with wt, T225A, iRT, iIN and ΔEnv (mock) supernatants. Ten days post-infection, genomic DNA was isolated from target cells and provirus numbers integrated into the host cell genome were quantified by Alu-qPCR and normalized to ß-actin copy numbers. The values obtained using wt PFV Gag expression plasmids were arbitrarily set to 100%. Relative means and standard deviations from three independent experiments in duplicates are shown. (C) Integration dynamics of wt and STP mutant viruses analyzed by inhibition of viral infectivity by dolutegravir addition at different time points post-infection and maintenance until flow cytometric determination of viral titers 10 days post-infection. (D) The values obtained for each respective virus type without DTG were arbitrarily set to 100%. Relative means and standard deviations from three independent experiments are shown.
Fig 10
Fig 10. Integration site profiles of WT and Gag iSTP mutant viruses.
(A) Percent of WT (gray bar), S224A (backslash), and T225A (horizontal slash) integrations within RefSeq genes. An independent HIV-1 dataset (black) [85] was included for comparison. (B) Percent of integrations within lamina-associated domains (LADs). (C) Average gene density in 1 Mb regions surrounding the integration sites. The data from three wt and two S224A and T225A integration site libraries (Table 1) were combined, with error bars indicating the resulting standard deviation. Dotted, horizontal lines represent the percent of integrations from the in vitro integration dataset. Please refer to S7 Fig for statistical analyses.

Similar articles

Cited by

References

    1. Goff SP. Host factors exploited by retroviruses. Nat Rev Microbiol. 2007;5(4):253–63. Epub 2007/02/28. 10.1038/nrmicro1541 . - DOI - PubMed
    1. Bieniasz PD. An overview of intracellular interactions between immunodeficiency viruses and their hosts. AIDS. 2012;26(10):1243–54. Epub 2012/04/05. 10.1097/QAD.0b013e328353bd04 . - DOI - PubMed
    1. Campbell EM, Hope TJ. HIV-1 capsid: the multifaceted key player in HIV-1 infection. Nat Rev Microbiol. 2015;13(8):471–83. Epub 2015/07/17. 10.1038/nrmicro3503 . - DOI - PMC - PubMed
    1. Martin-Serrano J, Neil SJ. Host factors involved in retroviral budding and release. Nat Rev Microbiol. 2011;9(7):519–31. Epub 2011/06/17. 10.1038/nrmicro2596 . - DOI - PubMed
    1. Fassati A. Multiple roles of the capsid protein in the early steps of HIV-1 infection. Virus Res. 2012;170(1–2):15–24. Epub 2012/10/09. 10.1016/j.virusres.2012.09.012 . - DOI - PubMed