. 2016 Sep 15;537(7620):422-426.
doi: 10.1038/nature19347. Epub 2016 Aug 31.

A PGC1α-mediated transcriptional axis suppresses melanoma metastasis

Affiliations

A PGC1α-mediated transcriptional axis suppresses melanoma metastasis

Chi Luo et al. Nature. .

Abstract

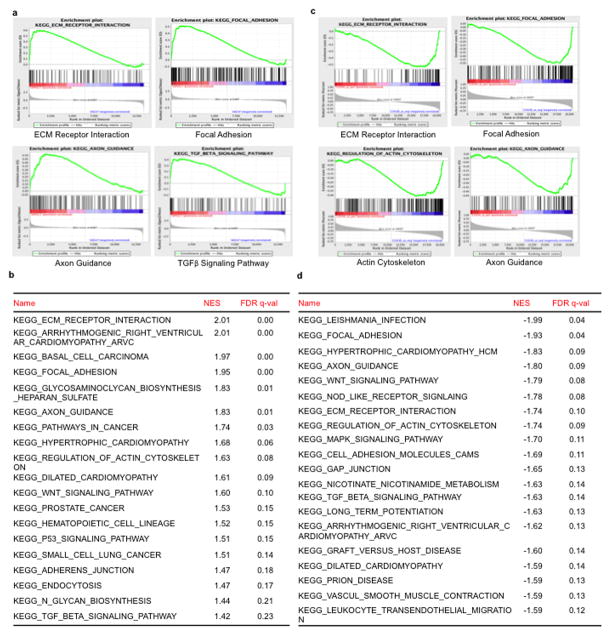
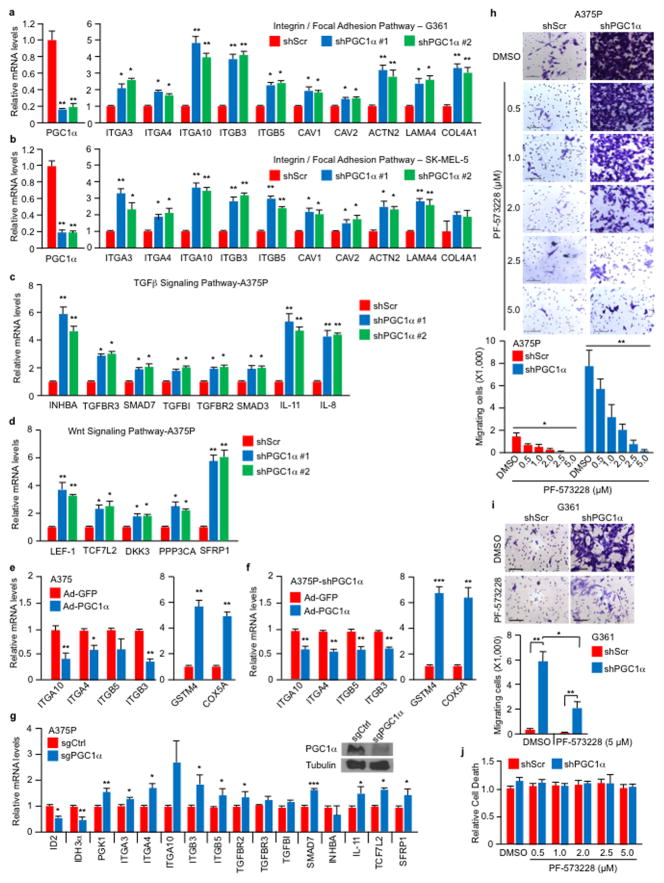
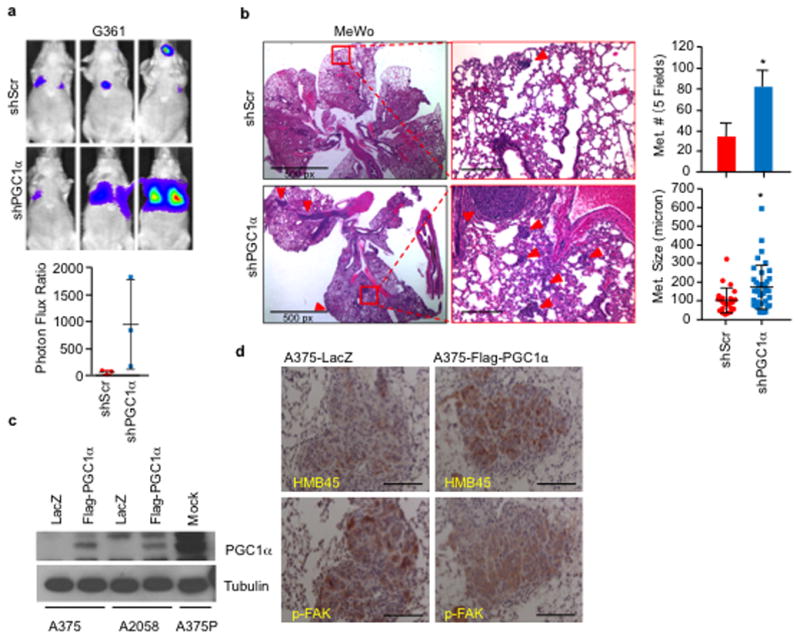
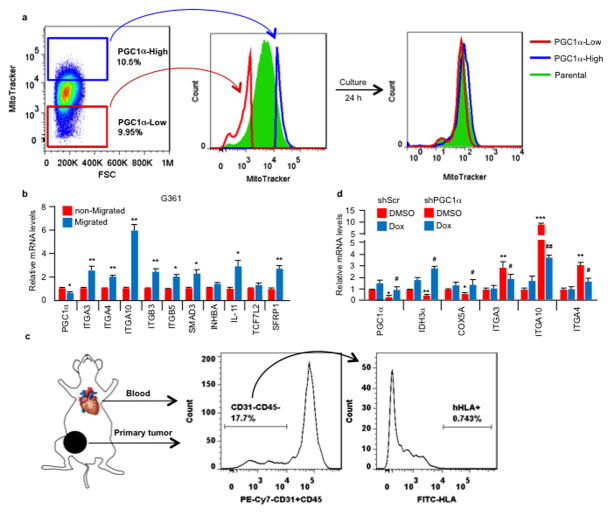
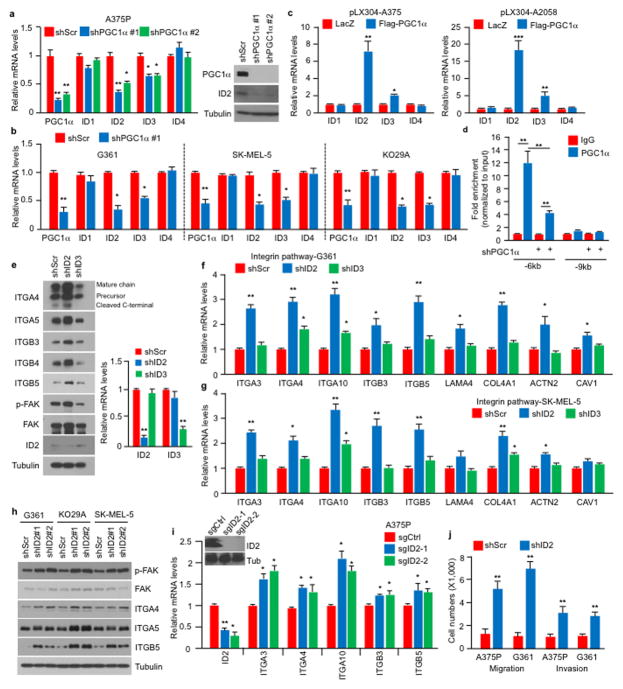
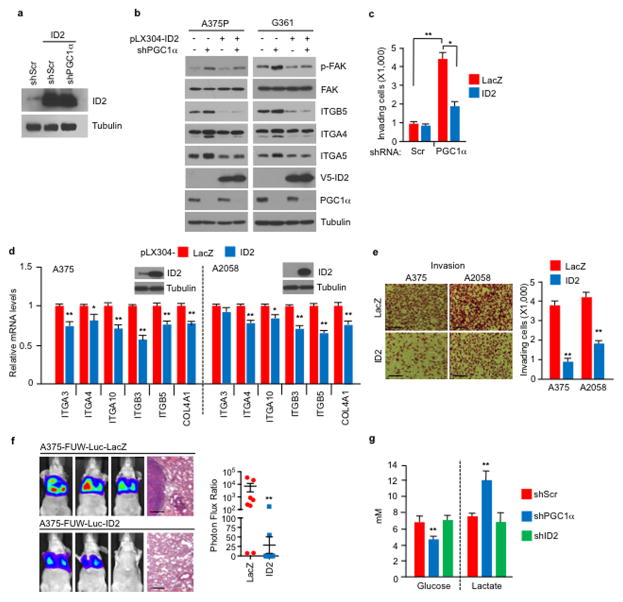
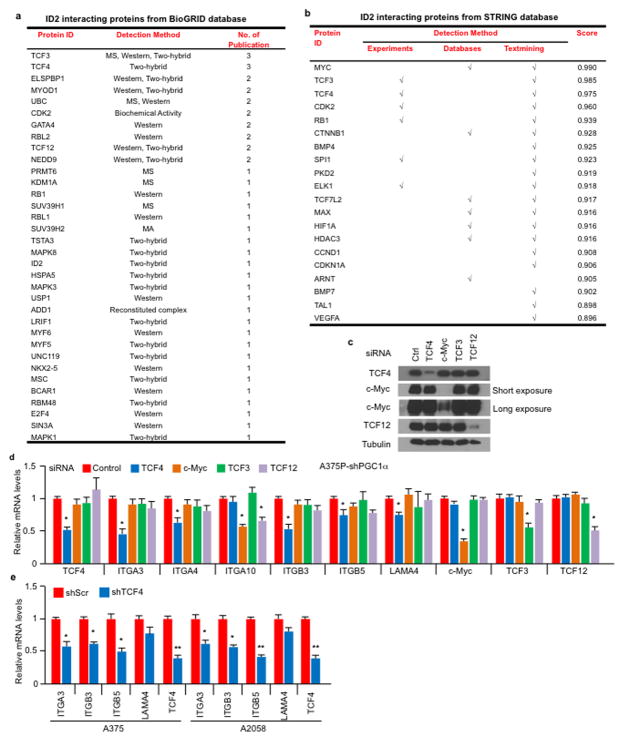
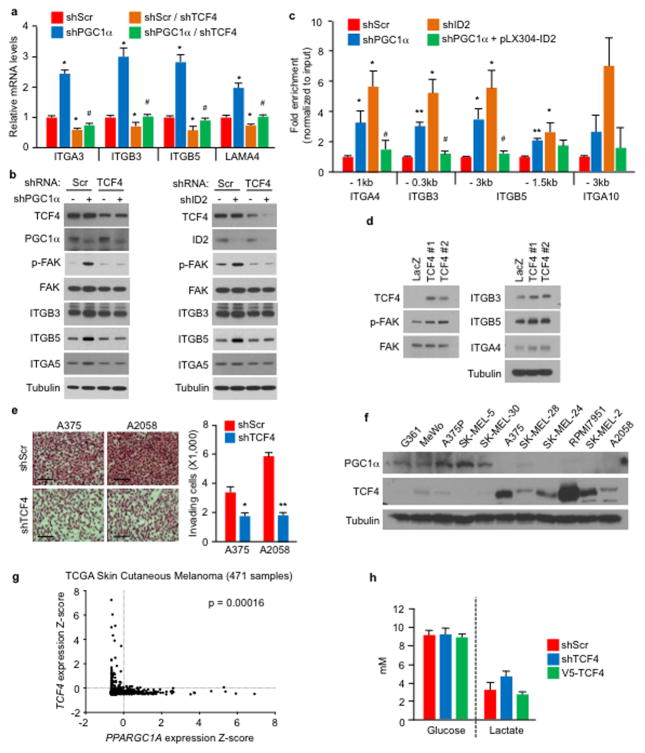
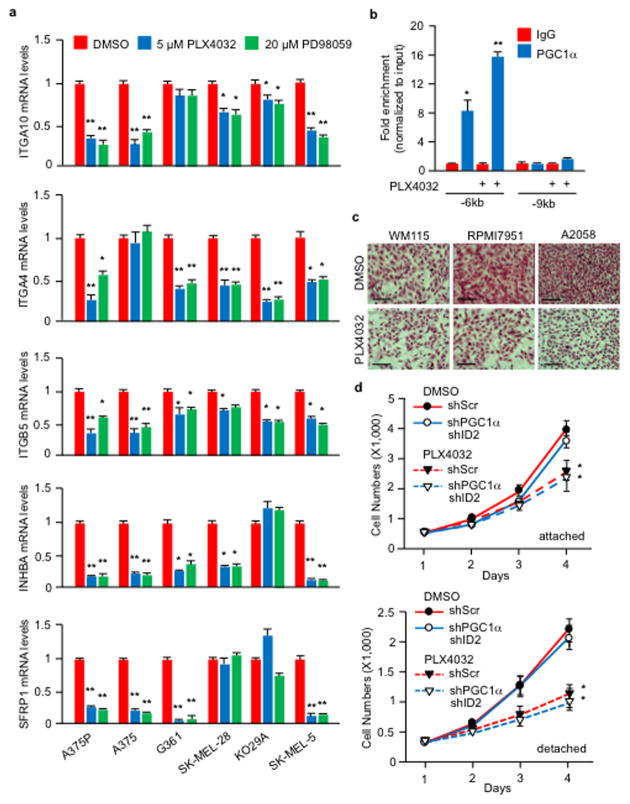
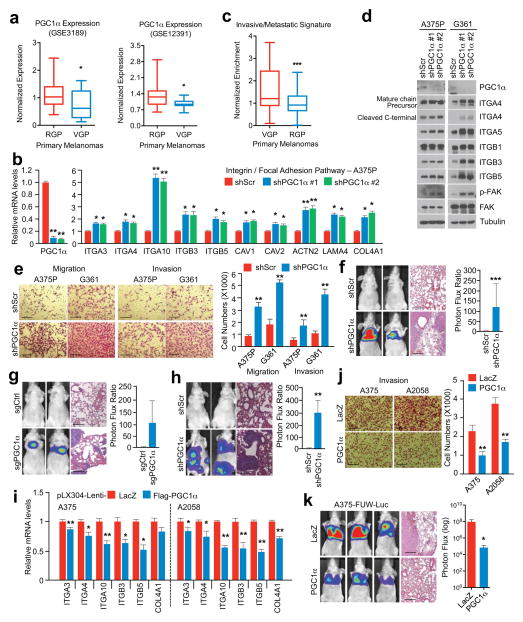
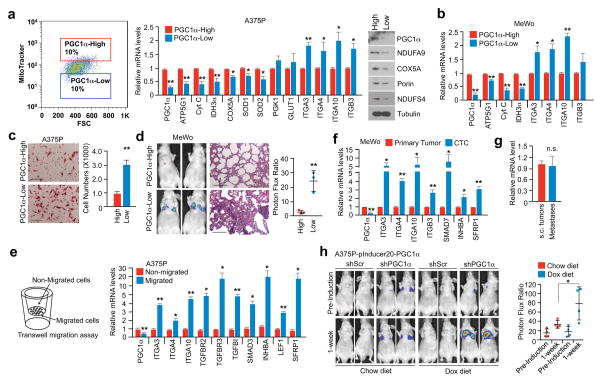
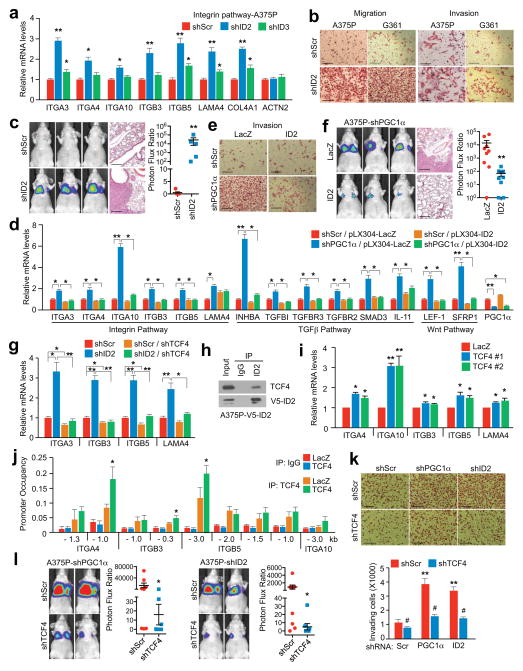
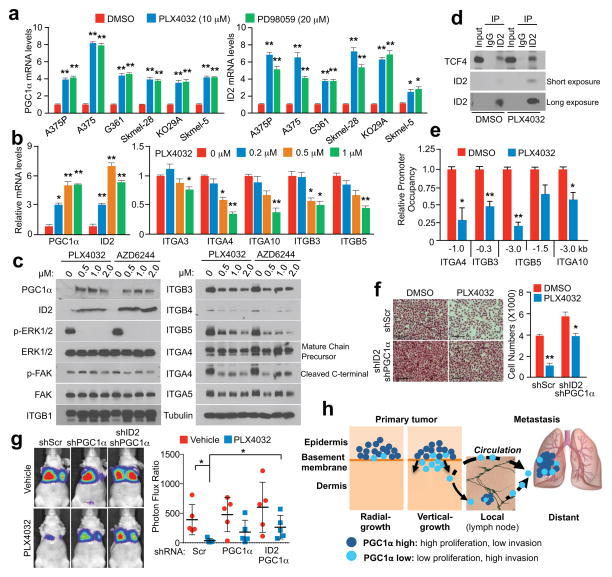
Melanoma is the deadliest form of commonly encountered skin cancer because of its rapid progression towards metastasis. Although metabolic reprogramming is tightly associated with tumour progression, the effect of metabolic regulatory circuits on metastatic processes is poorly understood. PGC1α is a transcriptional coactivator that promotes mitochondrial biogenesis, protects against oxidative stress and reprograms melanoma metabolism to influence drug sensitivity and survival. Here, we provide data indicating that PGC1α suppresses melanoma metastasis, acting through a pathway distinct from that of its bioenergetic functions. Elevated PGC1α expression inversely correlates with vertical growth in human melanoma specimens. PGC1α silencing makes poorly metastatic melanoma cells highly invasive and, conversely, PGC1α reconstitution suppresses metastasis. Within populations of melanoma cells, there is a marked heterogeneity in PGC1α levels, which predicts their inherent high or low metastatic capacity. Mechanistically, PGC1α directly increases transcription of ID2, which in turn binds to and inactivates the transcription factor TCF4. Inactive TCF4 causes downregulation of metastasis-related genes, including integrins that are known to influence invasion and metastasis. Inhibition of BRAFV600E using vemurafenib, independently of its cytostatic effects, suppresses metastasis by acting on the PGC1α-ID2-TCF4-integrin axis. Together, our findings reveal that PGC1α maintains mitochondrial energetic metabolism and suppresses metastasis through direct regulation of parallel acting transcriptional programs. Consequently, components of these circuits define new therapeutic opportunities that may help to curb melanoma metastasis.


Conflict of interest statement

The authors disclose no potential conflicts of interest. Author Information The authors declare no competing financial interests. Readers are welcome to comment on the online version of the paper.

Figures

Extended Data Figure 1
Extended Data Figure 1. GSEA analysis of PGC1α expression in melanoma cell lines
a–b, Representative GSEA plots (a) and list of gene sets (b) enriched in A375P cells upon PGC1α knockdown from dataset GSE36879, with the significance defined by q<0.25. c–d, Plots (c) and list of (d) the top gene sets whose expression is negatively correlated with PGC1α in 61 melanoma cell lines from CCLE, with the significance defined by q<0.15.
Extended Data Figure 2
Extended Data Figure 2. PGC1α depletion activates integrin, TGFβ and Wnt pathways
a–d, PGC1α knockdown increases expression of integrin genes (a–b), as well as genes in the TGFβ (c) and Wnt (d) pathways. e–f, Ectopic expression of PGC1α by adenoviruses inhibits integrin gene expression. g, CRISPR-mediated PGC1α depletion increases gene expression linked to integrin, TGFβ and Wnt pathways in A375P cells. Depletion of PGC1α was confirmed by immunoblotting. h–i. FAK inhibition blunted the increased migration induced by PGC1α depletion. A375P (h) and G361 (i) cells were subjected to 24 h transwell migration assay in the presence of DMSO or various doses of FAK inhibitor PF-573228. Images represent three pictures captured with scale bar representing 100 microns. j. The cytotoxic effects of FAK inhibitor on A375P melanoma cells were comparable between the various doses used in the migration assay within the 24 h time frame. The relative level of dead cells in culture supernatant was quantified by ToxiLight Bioassay. Values in all panels represent mean ± SD of independent biological triplicates; *p < 0.05, **p < 0.01 and ***p<0.001 by Student’s t-test in all panels.
Extended Data Figure 3
Extended Data Figure 3. PGC1α suppresses metastasis in melanoma cells
a–b, Knockdown of PGC1α increases the metastatic capacity of PGC1α-positive G361 (a, n=3 mice/group) and MeWo (b, n=3 mice/group) cells. Quantification of the number and size of lung metastatic nodules is shown. Metastatic size was quantified by measuring the longest diameter of each nodule. Values represent mean ± SD, *p < 0.05 by Student’s t-test. Images in b represent one picture captured per H&E slide; scale bar represents 200 microns if not otherwise indicated. c, Ectopic expression level of PGC1α in the PGC1α-negative A375 and A2058 lines. d, Restoration of PGC1α suppresses integrin signaling, as indicated by p-FAK (Y397), in A375-derived lung metastatic nodules. Melanoma diagnostic marker HMB45 was used to distinguish the tumor nodules from the lung tissues. Images represent three pictures captured per slide with scale bar representing 100 microns.
Extended Data Figure 4
Extended Data Figure 4. Melanoma cells contain heterogeneous levels of mitochondria and PGC1α
a. The mitochondrial content in melanoma cells is dynamically regulated. After 24 h in culture, the sorted mito-high and -low A375P subpopulations re-establish normal mitochondrial content distribution. b, Within the PGC1α-positive G361 line, the cells with higher migratory ability express lower PGC1α but elevated the pro-metastatic genes. Values represent mean ± SD of triplicates; *p < 0.05 and **p < 0.01 by Student’s t-test. c. Isolation of circulating tumor cells (CTCs) from tumor-bearing mouse. 2-month post-injection, the subcutaneous MeWo tumors become detectable, whole blood was collected by cardiac perfusion, followed by FACS based on surface protein staining, with mouse CD31 and CD45 to exclude endothelial cells and lymphocytes and human HLAabc to purify human tumor cells. The primary subcutaneous tumors were enzymatically digested into single cell suspension and subjected to the same sorting strategy. d. Gene expression in A375P melanoma cells after PGC1α induction. Values represent mean ± SD of independent biological triplicates; *p<0.05, **p<0.01 and ***p<0.001 versus shScr/DMSO; #p<0.05 and ##p<0.01 versus shPGC1α/DMSO by Student’s t-test.
Extended Data Figure 5
Extended Data Figure 5. ID2, but not ID3, is downstream of PGC1α in the suppression of the pro-metastatic program
a–b, PGC1α knockdown inhibits ID2 expression in PGC1α-positive cells. c, Ectopic expression of PGC1α increases ID2 levels in PGC1α-negative cells. d, PGC1α occupies the ID2 promoter region in A375P cells. e–g, Inhibition of ID2, but not ID3, increases expression and activation of integrin signaling in melanoma cell lines. h–i, Inhibition of ID2 by either shRNA or CRISPR/Cas9 increases expression of integrins. j, Quantification of in vitro migration and invasion induced by ID2 knockdown as shown in Figure 3b. Values in all panels except h represent mean ± SD of independent biological triplicates; *p < 0.05, **p < 0.01 and ***p<0.001 by Student’s t-test in all panels except h.
Extended Data Figure 6
Extended Data Figure 6. Enforced expression of ID2 suppresses metastasis
a, Ectopic expression of ID2 in A375P cells is higher than its endogenous level. b, Ectopic expression of ID2 attenuates integrin proteins and FAK (Y397) phosphorylation induced by PGC1α depletion. c, Quantification of invading cells as shown in Figure 3e. d–f, Ectopic expression of ID2 suppresses integrin gene expression (d), invasion in vitro (e) and metastasis in vivo (f, n=8 mice/group). Images in e and f represent one picture captured; scale bar represents 200 microns. g, ID2 does not affect cellular metabolism. Values in c, d, e and g represent mean ± SD of independent biological triplicates; values in f represent mean ± SEM of the 8 mice; *p < 0.05 and **p < 0.01 by Student’s t-test in c, d, e, f and g.
Extended Data Figure 7
Extended Data Figure 7. TCF4 is a putative ID2 partner in the regulation of integrin genes
a–b, List of the top ID2-interacting proteins from BioGRID (a) and STRING (b) databases. c, Knockdown efficiency of individual bHLH transcriptional factors by siRNAs in A375P cells was tested by immunoblotting. d, Inhibition of TCF4 attenuates PGC1α knockdown-mediated integrin induction in A375P cells. e, TCF4 knockdown suppresses gene expression linked to integrin signaling. Values in d and e represent mean ± SD of independent biological triplicates; *p < 0.05 and **p < 0.01 by Student’s t-test in d and e.
Extended Data Figure 8
a, TCF4 is required for PGC1α depletion-mediated induction of integrin genes in A375P cells. b, Ectopic expression of ID2 blocks the binding of TCF4 to integrin promoters in A375P cells. V5-TCF4 stably overexpressing A375P cells with indicated genetic manipulations were subjected to ChIP and qPCR. Values in a and b represent mean ± SD of independent biological triplicates; *p < 0.05 and **p < 0.01 versus shScr; #p<0.05 versus shPGC1α by Student’s t-test. c, Depletion of TCF4 blunts the activation of integrin signaling by PGC1α or ID2 knockdown in A375P cells. d, Ectopic expression of TCF4 increases integrin proteins and signaling in A375P cells. e, TCF4 knockdown suppresses cell invasion in A375 and A2058 cells. Images represent one picture captured per membrane with scale bar representing 200 microns. f, Expression of PGC1α and TCF4 in a panel of human melanoma cell lines. g, TCF4 and PGC1α expression in TCGA skin cutaneous melanoma dataset (471 samples with RNAseq expression data). Tendency towards mutual exclusivity for samples with Z-scores >0 (represented by dotted lines), p = 0.00016 by Fisher’s test. h, TCF4 level does not affect cellular metabolism. Values in e and h represent mean ± SD of independent biological triplicates; *p < 0.05 by Student’s t-test.
Extended Data Figure 9
a, BRAF inhibitor, PLX4032, and MEK1/2 inhibitor, PD98059, decrease integrin gene expression in melanoma cell lines. Gene expression was quantified 6 h post treatment of inhibitors. b, PLX4032-induced PGC1α occupancy at the ID2 promoter. A375P cells were incubated with 2 μM of PLX4032 for 6 h before ChIP analysis. c, PLX4032 inhibits invasion of BRAFV600E-containing melanoma cells. Cells were incubated with 1 μM PLX4032 for 10 h in matrigel-coated transwell chambers, followed by quantification. Images represent one picture captured per membrane with scale bar representing 200 microns. d, PGC1α and ID2 double knockdown does not affect sensitivity to PLX4032. Values in a, b and d represent mean ± SD of independent biological triplicates; *p < 0.05 and **p < 0.01 by Student’s t-test in a, b and d.
Figure 1
Figure 1. PGC1α suppresses melanoma cell migration, invasion and metastasis
a, PGC1α expression is decreased in vertical growing (VGP) compared to radial growing (RGP) human primary melanomas. b, PGC1α knockdown increases integrin transcripts in PGC1α-positive melanoma cells. c, Expression of the PGC1α-regulated invasive/metastatic signature genes in human primary melanomas. d, PGC1α knockdown increases integrin signaling in PGC1α-positive melanoma cells. e–g, PGC1α knockdown by shRNA (f, n=7 mice/group) or CRISPR/Cas9 (g, n=3 mice/group) increases A375P cells migration/invasion (e) and metastasis (f–g). h. PGC1α knockdown elevates metastasis of subcutaneous MeWo melanoma (n=3 mice/group). i–k, Restoration of PGC1α suppresses integrin expression (i), invasion (j) and metastasis (k, n=4 mice/group) of PGC1α-negative melanoma cells. Images in e–h, j and k represent one picture captured, with scale bar representing 200 microns. Values in a and c represent median ± relative deviation within indicated dataset; values in b, e, i and j show mean ± SD of independent biological triplicates; values in f, g, h and k represent mean ± SD of indicated amount of mice; *p < 0.05, **p < 0.01 and ***p < 0.005 by Student’s t-test in all the panels except d.
Figure 2
Figure 2. The heterogeneity of PGC1α expression in melanoma defines the metastatic capacity of individual cells
a, Mitochondrial mass in PGC1α-positive A375P cells correlates with PGC1α expression. b, The mito/PGC1α-low population of the PGC1α-positive MeWo cells displays higher integrin expression. c–d. The mito/PGC1α-low population is more migratory (c) and metastatic (d, n=3 mice/group). Images represent three pictures captured with scale bar representing 100 microns (c) or 200 microns (d). e. Within the same cell line, migratory cells express lower PGC1α but higher prometastatic genes than non-migrated cells. f. Circulating tumor cells (CTCs) express less PGC1α but higher pro-metastatic genes than primary tumor cells. g. Relative expression of PGC1α in subcutaneous MeWo melanomas and lung metastases. h. Doxycycline-based PGC1α restoration in established lung metastases promotes tumor growth (n=3–4 mice/group). Quantification of tumors with shPGC1α before and after doxycycline induction is shown. Values in a, b, c, e, f and g represent mean ± SD of independent biological triplicates; values in d and h represent mean ± SD of indicated amount of mice; *p < 0.05 and **p < 0.01 by Student’s t-test in all panels.
Figure 3
Figure 3. PGC1α transcriptionally activates ID2 to suppress TCF4 activity and the pro-metastatic program
a–c, ID2 knockdown in A375P cells increases integrin expression (a), migration/invasion (b) and metastasis (c, n=5 mice/group). d–f, Ectopic expression of ID2 attenuates PGC1α depletion-mediated activation of integrin, TGFβ and Wnt pathways (d) and induction of invasion (e) and metastasis (f, n=9 mice/group). g, TCF4 is required for the induction of integrins by ID2 inhibition. h, ID2 interacts with TCF4 in A375P cells. i–j, Ectopic expression of TCF4 increases integrin mRNAs (i) through directly binding to promoters of integrin genes (j) in A375P cells. k–l, TCF4 depletion represses invasion (k) and metastasis (l, n=8 mice/group) induced by PGC1α or ID2 knockdown in A375P cells. Images in b, c, e, f and k represent one picture captured with scale bar representing 200 microns; specifically, scale bars in b, A375P invasion, represent 100 microns. Values in a, d, g, i, j and k represent mean ± SD of independent biological triplicates representative of three experiments; values in c, f and l represent mean ± SEM of indicated amount of mice; in a, c, d, f, g, i, j, k and l, *p < 0.05, **p < 0.01 and ***p < 0.005 by Student’s t-test.
Figure 4
Figure 4. BRAFV600E inhibitor, PLX4032, inhibits melanoma metastasis by suppressing integrin signaling through PGC1α and ID2
a–c, Inhibitors of BRAFV600E (PLX4032) and MEK1/2 (PD98059 or AZD6244) increase PGC1α and ID2 expression (a, b) and repress integrin expression and signaling (b, c). Cells were treated with indicated concentration of inhibitors for 6 h (a, b) or 24 h (c). d–e, PLX4032 increases the interaction between ID2 and TCF4 (d) and decreases the occupancy of TCF4 at the promoters of integrin genes (e). f–g, PGC1α and ID2 are required for PLX4032-mediated inhibition of invasion and metastasis. For in vitro assays (f), A375 cells were incubated with 1 μM PLX4032 for 10 h, and images represent one picture captured per membrane with scale bar representing 200 microns. For in vivo assays (g, n=5 mice/group), PLX4032 (1 mg/kg, i.p. daily) was given for one week following cell implantation, and metastasis was analyzed three weeks post-treatment. One representative mouse image for each group is shown. h. Melanoma cells are heterogeneous, containing PGC1α-high and -low subpopulations. Values in a, b, e and f represent mean ± SD of independent biological triplicates; values in g represent mean ± SD of indicated amount of mice; *p < 0.05 and **p < 0.01 by Student’s t-test in a, b, e, f and g.

Comment in

Similar articles

Cited by

References

    1. Chin L, Garraway LA, Fisher DE. Malignant melanoma: genetics and therapeutics in the genomic era. Genes Dev. 2006;20:2149–2182. doi: 10.1101/gad.1437206. 20/16/2149[pii] - DOI - PubMed
    1. Gupta PB, et al. The melanocyte differentiation program predisposes to metastasis after neoplastic transformation. Nat Genet. 2005;37:1047–1054. doi: 10.1038/ng1634. ng1634[pii] - DOI - PMC - PubMed
    1. Puigserver P, Spiegelman BM. Peroxisome proliferator-activated receptor-gamma coactivator 1 alpha (PGC-1 alpha): transcriptional coactivator and metabolic regulator. Endocr Rev. 2003;24:78–90. - PubMed
    1. Vazquez F, et al. PGC1alpha expression defines a subset of human melanoma tumors with increased mitochondrial capacity and resistance to oxidative stress. Cancer cell. 2013;23:287–301. doi: 10.1016/j.ccr.2012.11.020. - DOI - PMC - PubMed
    1. Haq R, et al. Oncogenic BRAF regulates oxidative metabolism via PGC1alpha and MITF. Cancer cell. 2013;23:302–315. doi: 10.1016/j.ccr.2013.02.003. - DOI - PMC - PubMed

MeSH terms