. 2016 Sep 29;537(7622):698-702.
doi: 10.1038/nature19348. Epub 2016 Aug 31.

Single-cell analysis of mixed-lineage states leading to a binary cell fate choice

Affiliations

Single-cell analysis of mixed-lineage states leading to a binary cell fate choice

Andre Olsson et al. Nature. .

Erratum in

Abstract

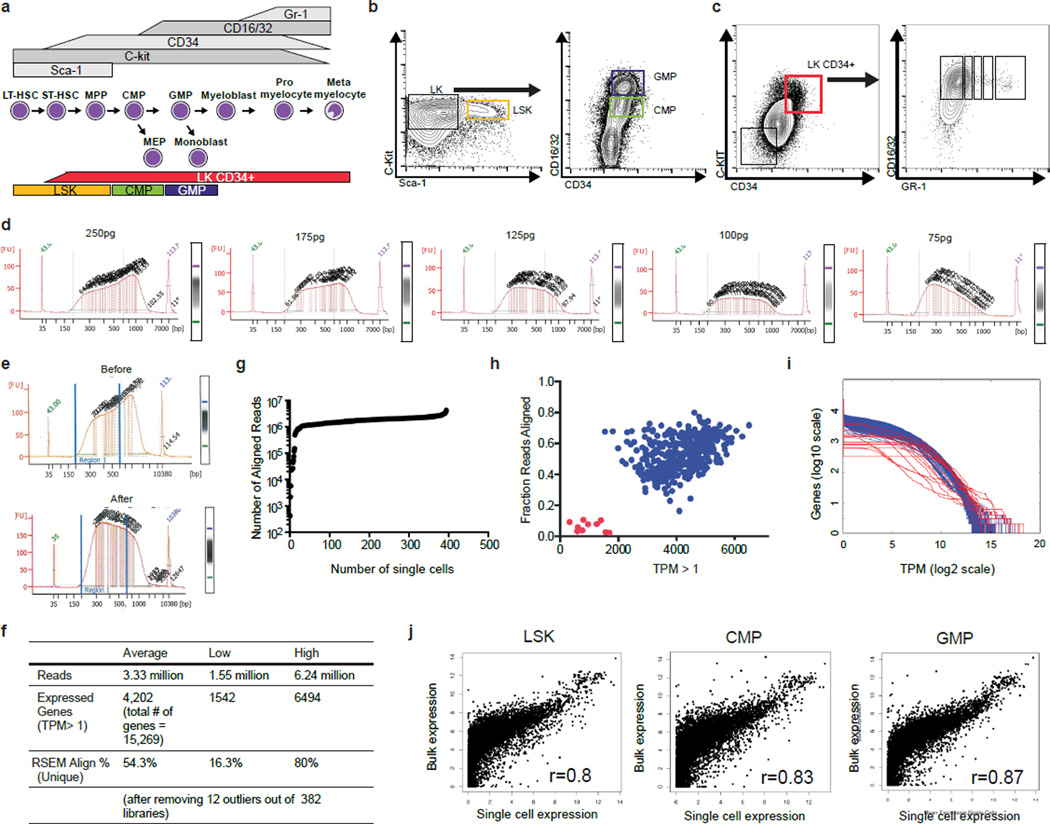
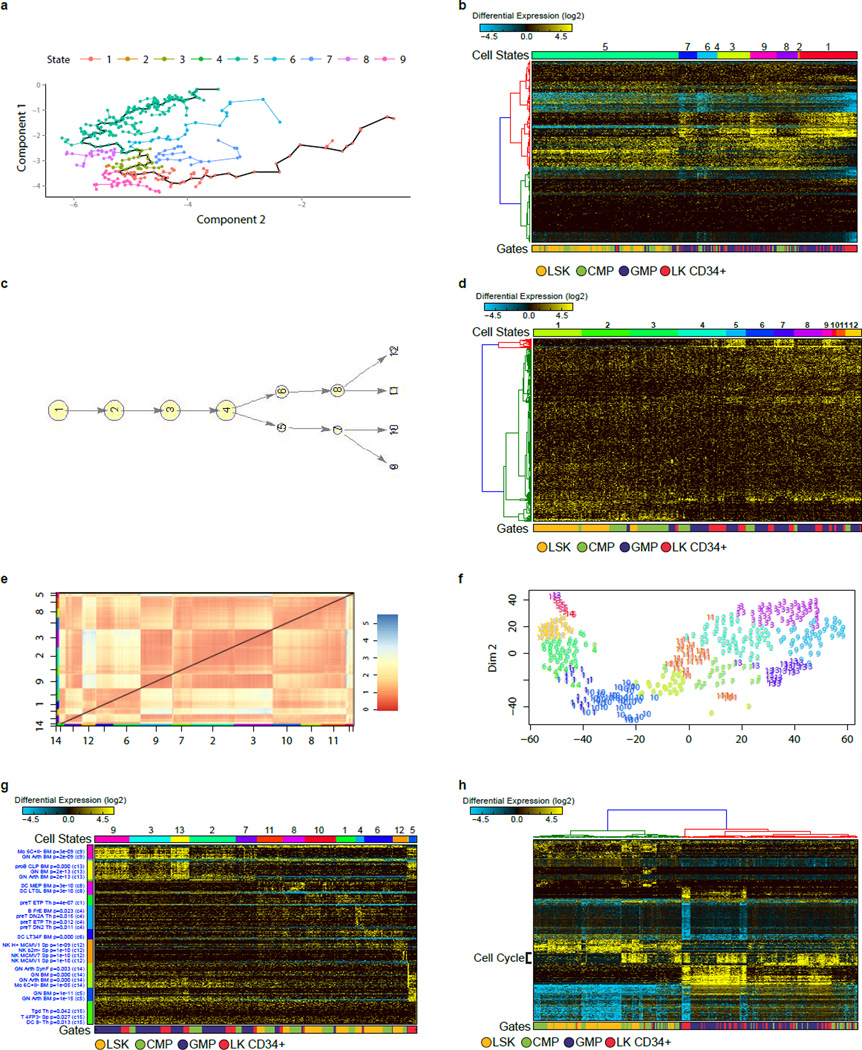
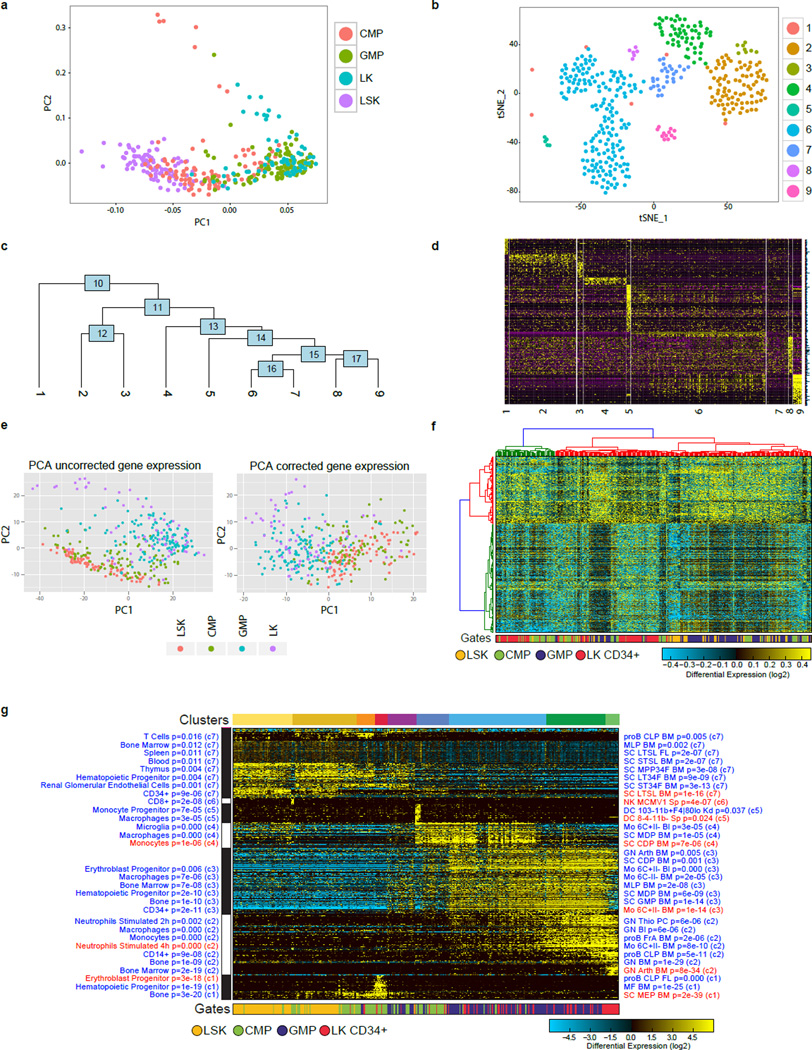
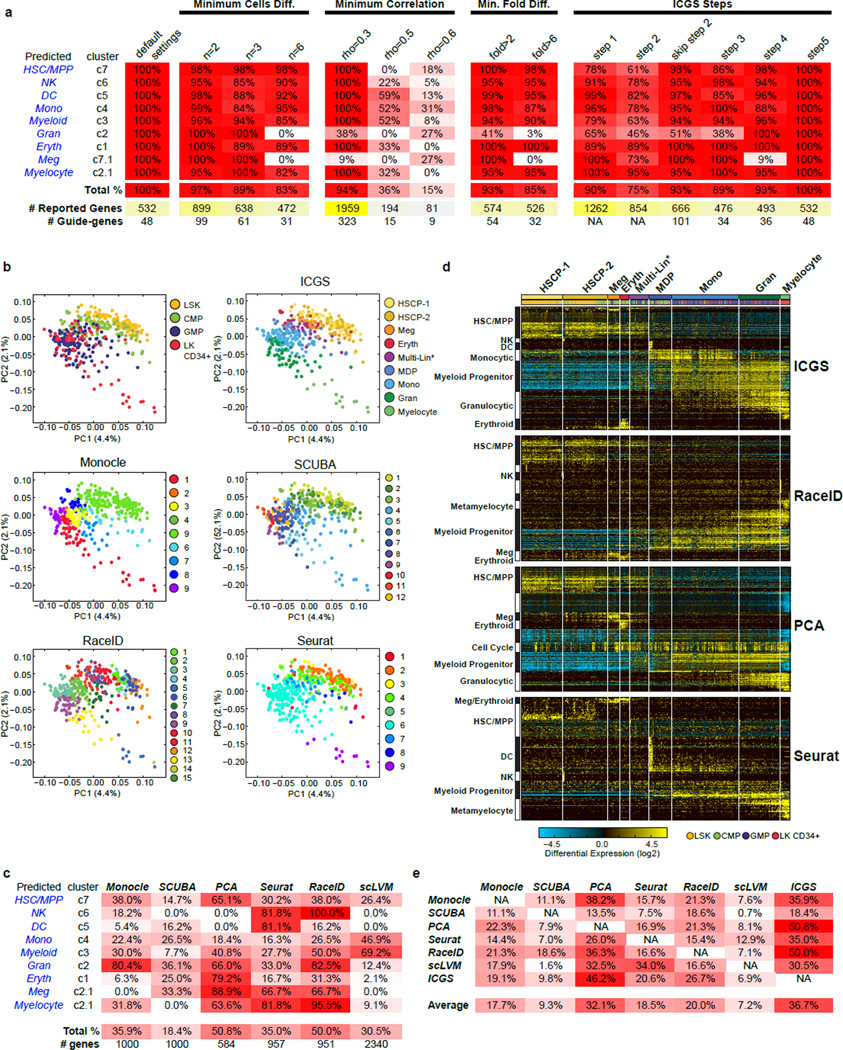
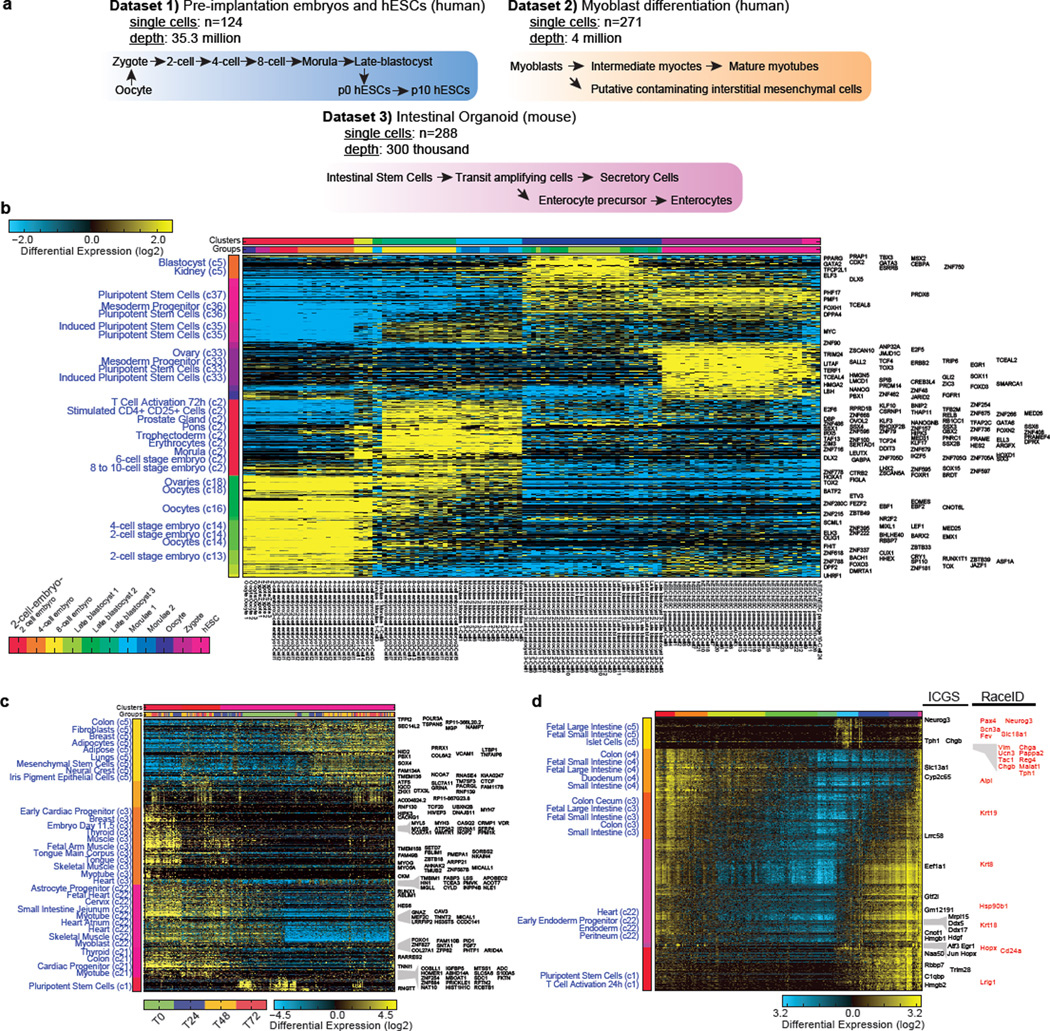
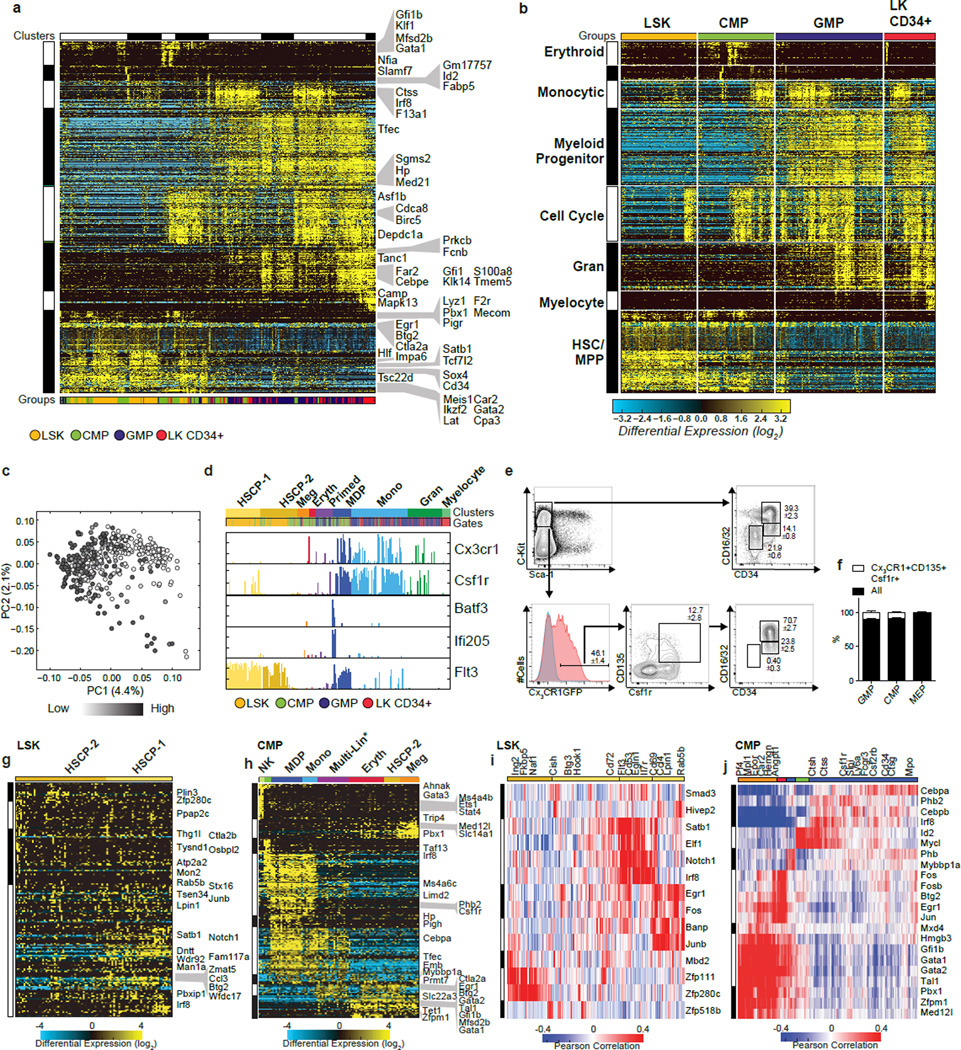
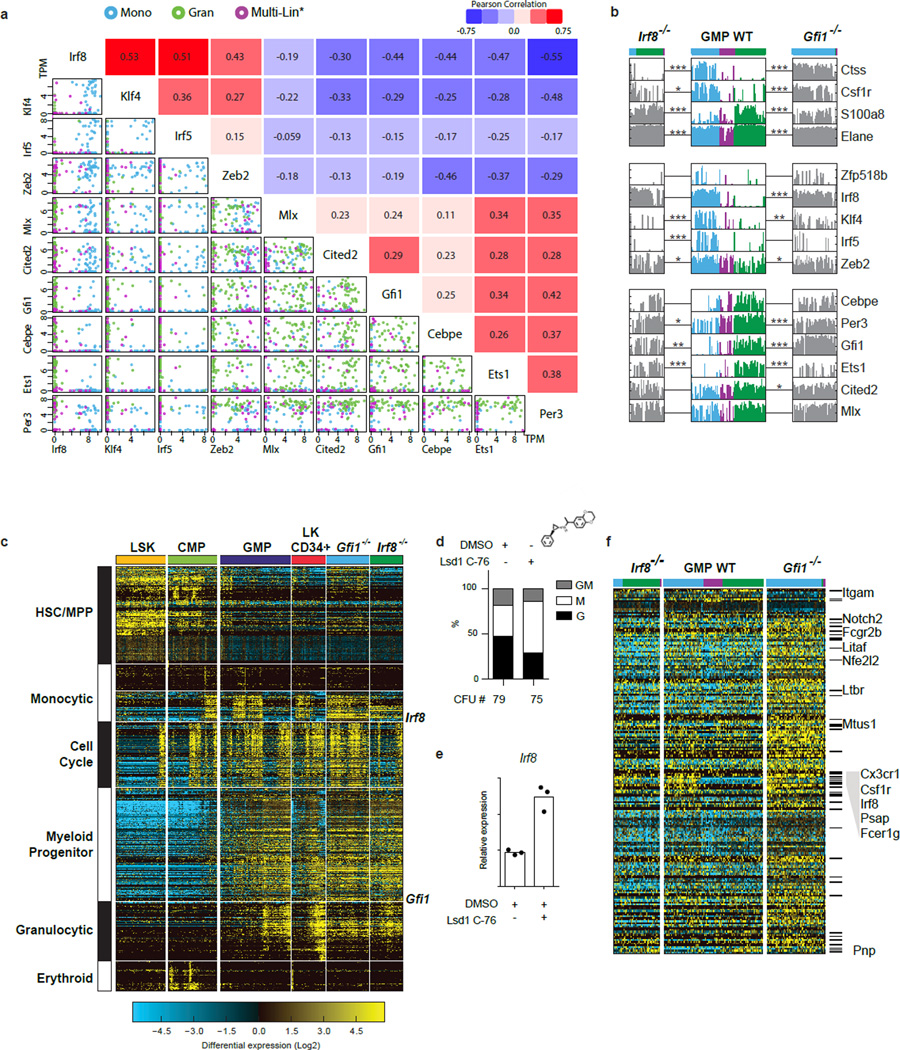
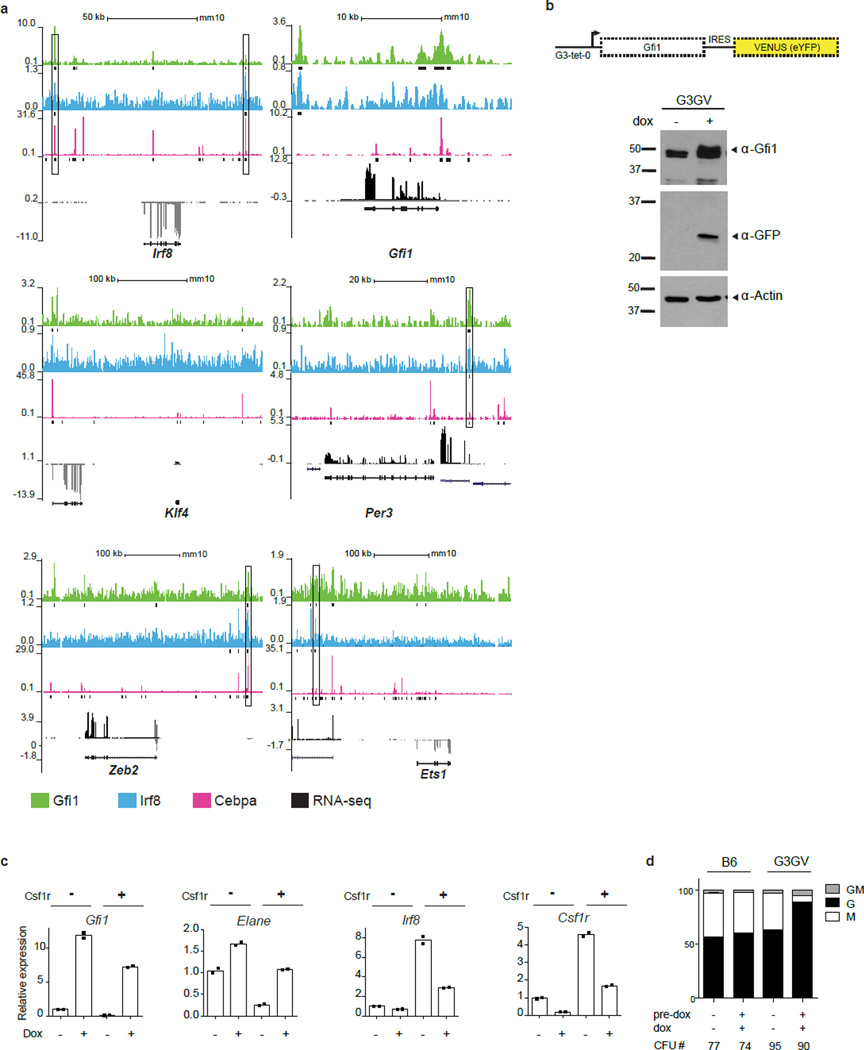
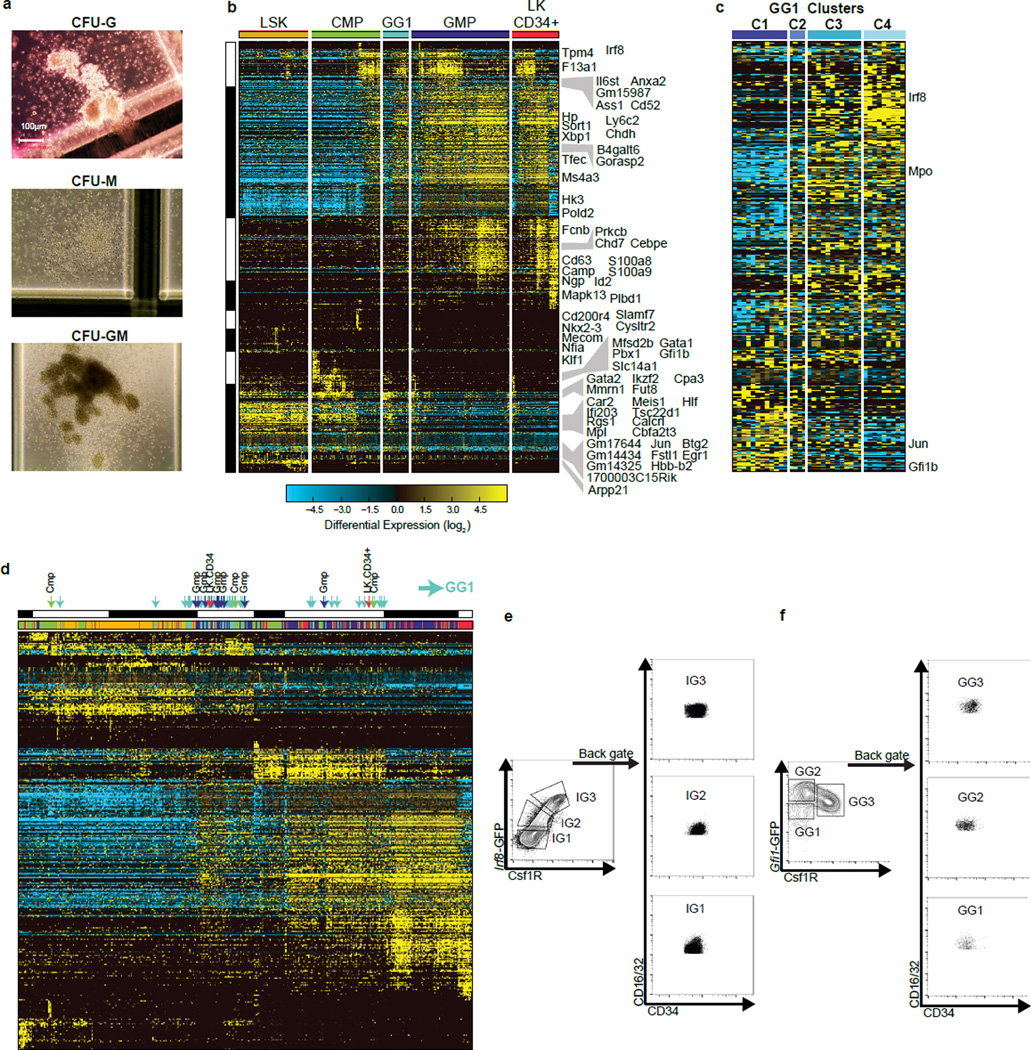
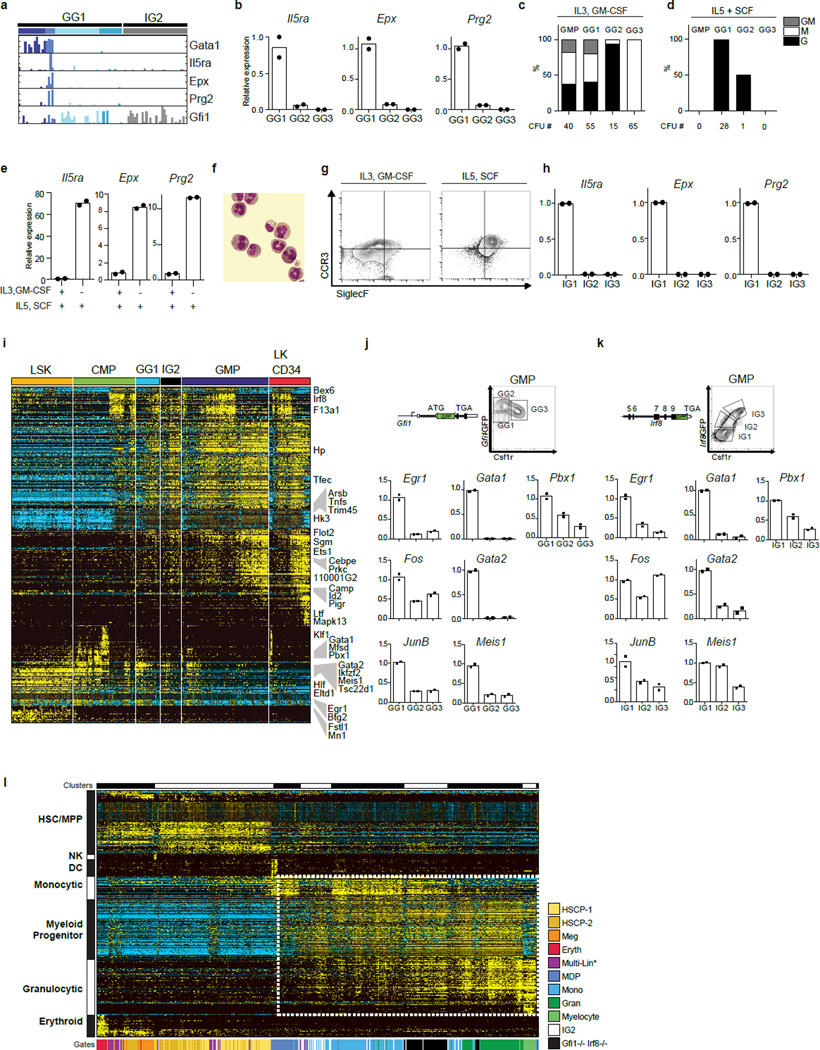
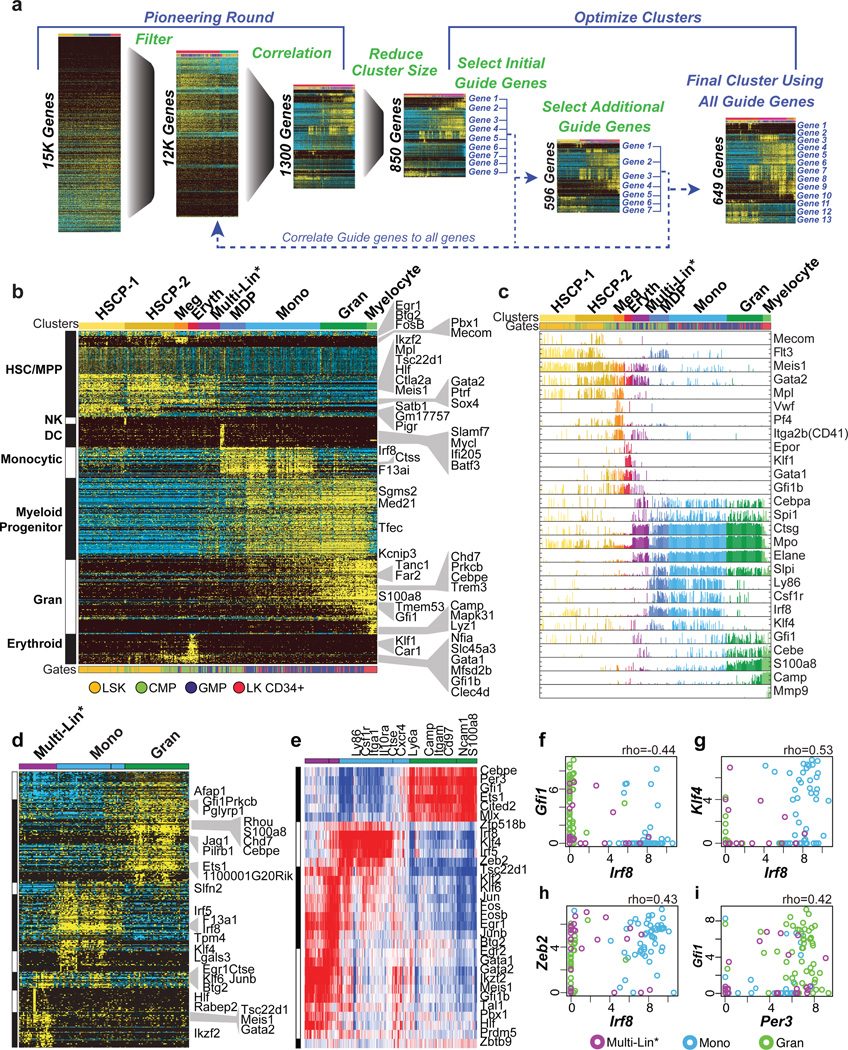
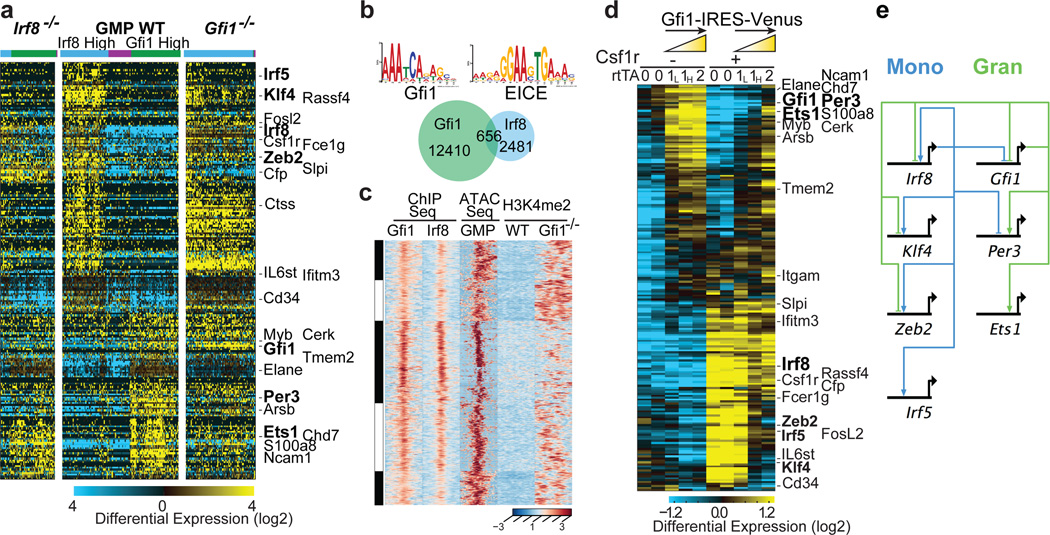
Delineating hierarchical cellular states, including rare intermediates and the networks of regulatory genes that orchestrate cell-type specification, are continuing challenges for developmental biology. Single-cell RNA sequencing is greatly accelerating such research, given its power to provide comprehensive descriptions of genomic states and their presumptive regulators. Haematopoietic multipotential progenitor cells, as well as bipotential intermediates, manifest mixed-lineage patterns of gene expression at a single-cell level. Such mixed-lineage states may reflect the molecular priming of different developmental potentials by co-expressed alternative-lineage determinants, namely transcription factors. Although a bistable gene regulatory network has been proposed to regulate the specification of either neutrophils or macrophages, the nature of the transition states manifested in vivo, and the underlying dynamics of the cell-fate determinants, have remained elusive. Here we use single-cell RNA sequencing coupled with a new analytic tool, iterative clustering and guide-gene selection, and clonogenic assays to delineate hierarchical genomic and regulatory states that culminate in neutrophil or macrophage specification in mice. We show that this analysis captured prevalent mixed-lineage intermediates that manifested concurrent expression of haematopoietic stem cell/progenitor and myeloid progenitor cell genes. It also revealed rare metastable intermediates that had collapsed the haematopoietic stem cell/progenitor gene expression programme, instead expressing low levels of the myeloid determinants, Irf8 and Gfi1 (refs 9, 10, 11, 12, 13). Genetic perturbations and chromatin immunoprecipitation followed by sequencing revealed Irf8 and Gfi1 as key components of counteracting myeloid-gene-regulatory networks. Combined loss of these two determinants 'trapped' the metastable intermediate. We propose that mixed-lineage states are obligatory during cell-fate specification, manifest differing frequencies because of their dynamic instability and are dictated by counteracting gene-regulatory networks.


Figures

Extended Data Figure 1
Extended Data Figure 1. Experimental design, optimization, quality control, and validation of scRNA-Seq data
a, Schematic illustrating hematopoietic intermediates that constitute the myeloid developmental pathway in the bone marrow. Select cell surface markers expressed by the various intermediates are indicated (top). The murine bone-marrow populations used for scRNA-Seq are color coded and indicated at bottom of schematic. b, Flow cytometry strategy for isolation of LSK, CMP, and GMP hematopoietic subsets. c, Sorting strategy for lineage negative CD117+CD34+ (LK CD34+) myeloid progenitor-precursor populations. d, Optimization of size of single-cell RNA-Seq library fragments by varying the amount of input cDNA (amount shown on top of each electropherogram). e, Single-cell RNA-Seq library fragment distribution before and after optimization reveals an increase in reads that can be mapped to the genome (reads mapping to a single genomic/transcriptomic location using BowTie2/TopHat2; 61.8% before and 83.5% after optimization). f, Single-cell RNA-Seq summary statistics. g, Distribution of number of aligned reads for single-cell RNA-Seq libraries. h, Scatter plot of the fraction of aligned reads (y-axis: RSEM-transcriptome-aligned reads relative to the total number of sequenced reads) versus the total number of genes with a TPM >1 (x-axis) for each cell. RNA-Seq libraries in red were considered outliers and eliminated from downstream analyses. Of the 96 LSK, 96 CMP, 136 GMP and 66 LKCD34+ libraries that were sequenced, 3 LSK, 2 CMP, 4 GMP and 3 LKCD34+ samples failed the QC analysis. i, Histogram showing the inverse cumulative count of genes for each sequenced cell greater than the TPM cutoff in each bin (200 bins, red samples represent outliers from ED Fig. 1h). j, Correlation between bulk RNA-Seq (TRUseq Stranded mRNA HT kit) for each sorted population compared to average single-cell gene expression values from the same sort (e.g. LSK, CMP, or GMP).
Extended Data Figure 2
Extended Data Figure 2. Analysis of scRNA-Seq data with Monocle, SCUBA, RaceID and PCA
a, Pseudotemporal ordering of all 382 hematopoietic progenitors along the 9 identified Monocle cell states. These states were identified from the original four annotated flow cytometric gates, based on 5,110 Monocle identified genes (p<0.01). b, Hierarchical clustering of the 1000 most significant genes for the 9 Monocle states (correlation and ward hierarchical clustering for genes). c, SCUBA pseudotemporal ordered cell states. d, Hierarchically clustering of the 1000 most variable SCUBA genes. e, RaceID identified k-means cell clusters. f, RaceID t-SNE visualization of these cells and k-means cell states. g, Heatmap of the t-SNE based cell-state ordering and the top 150 most significant RaceID genes associated with each of the 14 k-means clusters. Gene-set predictions are assigned on the left of the heatmap following ImmGen gene-set enrichment analysis in AltAnalyze. h, Hierarchical clustering of 584 PCA identified genes using the workflow outlined by Treutlein B, et al.47.
Extended Data Figure 3
Extended Data Figure 3. Analysis of scRNA-Seq data with Seurat, scLVM and ICGS
a, Seurat significant gene weighted PCA, colored by the sorted cell population annotations. b, Seurat t-SNE displayed output for the 9 predicted cell states. c, Seurat hierarchical relationships between the predicted cell states, based on 161 differentially expressed genes. d, Expanded 766 significant genes displayed along the Seurat ordered cell states. e, Uncorrected PCA using the top 2361 scLVM variance genes (left). PCA upon the scLVM corrected normalized expression matrix (right). f, Hierarchically clustered heatmap using the top 2361 genes from the corrected scLVM normalized expression matrix. g, ICGS analysis and integration of cell-type prediction analyses in AltAnalyze. ICGS produced expression heatmap for the hematopoietic progenitor scRNA-Seq data. On the right hand side of the ICGS heatmap are the default predicted GO-Elite BioMarker enrichment predictions (60 top-genes for each of the 300 cells/tissue microarray datasets evaluated) for each HOPACH cluster. On the left is a similar set of gene-set enrichments derived in AltAnalyze for all mouse ImmGen profiles (enrichment analysis and visualization available through the AltAnalyze heatmap viewer). Fisher-Exact enrichment p-values are displayed with each term along with the associated HOPACH cluster number. Terms used to derive the final predicted cell-types are manually highlighted in red.
Extended Data Figure 4
Extended Data Figure 4. Comparing ICGS with Monocle, SCUBA, RaceID, PCA, Seurat, and scLVM for the analysis of scRNA-Seq data
a, Table comparing ICGS derived cell population gene-set results using different ICGS parameters. These parameters include minimum cells differing between the highest and lowest values for a gene for an indicated minimum fold difference and minimum Pearson correlation threshold. The results indicated under ICGS Steps refers to the gene outputs from each step of ICGS or from the entire workflow with exclusion of step 2. b, PCA visualization of the first two principal components of all expressed genes (ICGS step 1), following z-score normalization of all TPM values. Cells are colored according to the flow cytometric gate (top left), according to their ICGS clusters (top right) or for cell populations indicated by the different evaluated algorithms (Monocle, SCUBA, RaceID, Seurat). c, Table comparing ICGS derived cell population gene-sets for different scRNA-Seq algorithms. d, Direct comparison of gene expression results from different selected scRNA-Seq algorithms. All cells are ordered based on the ICGS output and genes clustered by HOPACH. Gene set enrichment analysis results for ICGS delineated gene populations (GO-Elite) are displayed to the left of each HOPACH gene cluster. e, Table comparing the relative overlap of the top significant gene sets produced by each of the scRNA-Seq algorithms.
Extended Data Figure 5
Extended Data Figure 5. Application of ICGS to diverse scRNA-Seq datasets
a, Schematic overview of published embryonic, myoblast and intestinal organoid scRNA-Seq datasets. b, HOPACH generated clusters derived using ICGS for human scRNA-Seq data for pre-implantation embryos and embryonic stem cells. c, HOPACH generated clusters using ICGS for human myoblast differentiation, without inclusion of cell cycle associated genes. d, HOPACH generated clusters using ICGS for mouse intestinal organoids for the discovery of rare cell populations. Novel rare population markers reported by the original study authors are highlighted in red. To the left of the heatmaps are predicted cell-types and tissues using AltAnalyze enrichment analysis (GO-Elite algorithm), using gene-sets from the imbedded MarkerFinder database. Enriched terms are ordered based on significance from the bottom to top in each indicated HOPACH cluster. Genes to the right of the heatmap are guide genes delineated by ICGS. The color bars above the heatmaps indicate either HOPACH clusters or input cell identities.
Extended Data Figure 6
Extended Data Figure 6. Cell cycle, Monocyte-Dendritic Precursor, and TF-gene correlation analyses
a–c, Activation of a mitotic gene expression program in developmentally distinct cell populations. a, Heatmap of single-cell ICGS-gene-expression clusters generated (in AltAnalyze using the HOPACH algorithm) with the allowed inclusion of cell-cycle regulators as guide genes. Each column represents a single-cell library. Each row represents a different gene. ICGS-identified guide genes are indicated to the right of each plot. ICGS-identified HOPACH clusters are indicated at the top. b, ICGS from panel a, reordered by gates used for flow cytometric isolation (indicated at the top). Cell-types (to the left) were predicted using GO-Elite (AltAnalyze) and ToppGene enrichment analysis, in addition to prior literature knowledge. c, PCA visualization of the first two principal components of all expressed genes (ICGS step 1), following z-score normalization of all TPM values. Cells shaded to signify the mean expression of cell-cycle-associated genes (GO:0022402). d–f, Macrophage-dendritic precursors (MDP) and nascent dendritic cells within myeloid progenitor gates. d, Column plots displaying the incidence and amplitude of expression of select genes (in Fig. 1b ICGS-clustered order; “Clusters” at the top). The origin (flow-cytometric-gate) of each cell is indicated (“Gates” at the top). Expression of Flt3, Csf1r and Cx3CR1 identifies MDP, while expression of Batf3 and Ifi205 suggests dendritic cell differentiation. e, Flow cytometric analysis of lineage negative Cx3CR1-GFP+ mouse bone marrow cells confirms the presence of phenotypic CD135+(Flt3), CD115+(Csf1r) MDP in CMP and GMP gates. f, Bar graph representing the relative abundance of MDP within each gate ± SEM. Average of three biological replicates represented, percent parent represented in flow plots ± SEM (n=3). g–j, TF-to-gene correlation analysis. g, ICGS clustering of LSK cells (n=93) with cell-cycle genes excluded. h, ICGS clustering of CMP cells (n=94) with cell-cycle genes excluded. ICGS selected guide genes are displayed on the right of each heatmap. i, Heatmap displays clustering of Pearson correlation coefficients among genes and TFs using HOPACH, with corresponding ICGS clusters from LSK in panel g. j, Heatmap displays clustering of Pearson correlation coefficients among genes and TFs using HOPACH, with corresponding ICGS clusters from CMP in panel h. Columns represent genes and rows transcription factors (TF) that are captured by the ICGS analysis of CMP cells.
Extended Data Figure 7
Extended Data Figure 7. TF to TF correlations, and TF loss-of-function analyses
a, Scatterplots reveal the single-cell structure underlying correlations between TFs. Scatterplots generated in R (using the pairs function) show TPM of select transcription factor pairs in individual GMPs (colors corresponding to ICGS groups in Fig. 1d, top). Expression is given as TPM. Pearson correlation coefficients are indicated opposite to each plot. b, Plots displaying the incidence and amplitude of expression of select genes in Fig. 2a. Expression clusters of Irf8-high (blue) and Gfi1-high (green) or neither (Multi-Lin*; purple) are delineated. Significant changes in expression of key genes between Irf8−/− versus Irf8-high WT GMP, or Gfi1−/− versus Gfi1-high WT GMP are noted (* p<0.05, ** p<0.01, *** p<0.001 Benjamini-Hochberg adjusted). Note that Irf8−/− and Gfi1−/− GMP continue to express non-productive transcripts emanating from the mutant Gfi1 and Irf8 alleles. c. Gfi1−/− GMPs show a significant increase in cell cycle-related gene expression compared to wildtype or Irf8−/− GMPs. HOPACH clustering of Gfi1−/− and Irf8−/− GMPs using hematopoietic guide genes from Fig. 2a. All cells were first clustered by HOPACH and then grouped according to sorting gates. In agreement with our previous report that Gfi1 controls two genetically separable programs; granulopoiesis and Hox-based myeloid progenitor proliferation, Gfi1−/− GMP demonstrate significantly increased HSC and cell-cycle-associated gene expression. Cell cycle associated genes were enriched (z-score>1.96) in Gfi1−/− and depleted (z-score <−1.96) in the Irf8−/− GMPs. d–e Lsd1 inhibition results monocytic colony formation and increased Irf8 expression. d, CFU assays performed with CD117+ bone marrow cells −/+ treatment with an Lsd1 inhibitor (GSK C-76). Y-axis displays percent distribution of colony types. Mean CFU number of three technical replicates shown. e, TaqMan analysis of Irf8 expression in CD117+ bone marrow cells −/+ treatment with C-76 (16 h). Mean of three technical replicates with similar results from 3 biological replicates. Representative plot from one of three independent experiments performed displayed (d,e). f, Heat map showing the expression of a subset of genes (214) associated with Gfi1 and Irf8 shared ChIP-Seq peaks. All displayed genes are significantly differentially expressed (p<0.05, Benjamini Hochberg adjusted) among at least one of the four comparisons (Irf8−/− versus WT; Irf8−/− versus Irf8-high WT; Gfi1−/− versus WT; Gfi1−/− versus Gfi1-high WT). Marked genes (−) are associated with ImmGen monocyte-dendritic-precursor genes sets, and named genes are associated with abnormal mononuclear cell morphology (Mouse Phenotype Ontology). c, Gfi1 (green), Irf8 (blue) and Cebpα (red) ChIP-Seq and RNA-Seq tracks illustrating co-regulation at select loci. Gfi1 and Irf8 ChIP-Seq and bulk RNA Seq were performed using wild-type GMP (as in ED Fig. 1j). Cebpα ChIP-Seq data was obtained from GEO record GSE43007. Significant peaks called by MACS are represented as bars under each ChIP-Seq track. Regions that have called peaks overlapping for Gfi1, Irf8 and Cebpα are highlighted by a box. Strand specific RNA seq are displayed as black and grey peaks, respectively. RefSeq gene structure presented at bottom.
Extended Data Figure 8
Extended Data Figure 8. Counter-acting functions of Irf8 and Gfi1 in myeloid cell fate choice
a, Gfi1, Irf8 and Cebpα ChIP-Seq and RNA-Seq tracks illustrating coregulation at select loci. Gfi1 and Irf8 ChIP-Seq were carried using crosslinked wild type GMP whereas the RNA-Seq were performed using wild type GMP. Cebpα ChIP-Seq data was obtained from GEO record GSE43007. Significant peaks called by MACS are represented as bars under each ChIP-Seq track. Regions that have called peaks overlapping for Gfi1, Irf8 and Cebpα are highlighted by a box. Strand specific RNA seq are displayed as black and grey peaks, respectively. Refseq gene structure presented at bottom for Irf8, Gfi1, Klf4, Per3, Zeb2, and Ets1. b–d G3-tetracycline-inducible promoter-driven Gfi1 allele (G3- Gfi1-IRES-Venus eYFP = “G3GV”) results in granulocytic differentiation. b, Schematic representation of the Col1A1 locus of KH2 ES cells engineered using FLP recombinase to harbor a G3-tetracycline-inducible promoter-driven Gfi1 allele (G3-Gfi1-IRES-Venus eYFP = “G3GV”). KH2 ES cells also contain a ROSA-allele which expresses the rtTA-M2 protein. Immunoblot of Gfi1 and Venus eYFP expression in ES cells. G3GV KH2 ES cells were treated with 1µg/ml doxycycline for 48 hours, then analyzed for Gfi1 and Venus expression by immunoblotting. For gel source data, see Supplementary Figure 1. c, TaqMan analysis of gene expression in Csf1r- and Csf1r+ GMPs, +/− doxycycline induction of G3GV using one allele encoding rtTA. Mean of two technical replicates represented. d, CFU assays using lineage negative bone marrow cells from wild type B6 or G3GV knock-in mice. Cells were cultured with or without 1µg/ml doxycycline, in methylcellulose media. Percent distribution of colony types is displayed on y-axis. Mean CFU number ± SEM (bottom) (n=3 wells per condition). Representative plot from one of three independent experiments performed displayed (c,d)
Extended Data Figure 9
Extended Data Figure 9. Bi-potential GG1 cells comprise transcriptionally distinct progenitor populations
a, Colony appearance of CFU-G, -M and GM- respectively. Photos taken with a 10× objective. b, ICGS analysis of GG1 cells with those spanning the entire myeloid developmental spectrum (Fig. 1b). Cells were separated according to the flow cytometric sort gates. c, Hierarchical clustering using genes in panel b that are expressed in GG1 cells (TPM>1) identifies four distinct sub clusters. d, Finding GG1-like cells in the existing scRNA-Seq data set. HOPACH clustering of the same genes and cells from ED Fig. 9b with arrows indicating the GG1 and 16 GG1-like cells identified in the other sort gates. GG1-like cells were identified by comparing centroids from ED Fig. 9c to those from Fig. 1b HOPACH clusters, using the LineageProfiler classification option in AltAnalyze (n=16) (Supplementary Methods – Identification of Bi-Potential Single-Cell RNA-Seq Profiles). Arrows at the top of the heatmap denote GG1 and GG1-like cells. e–f, Back-gating of sorted Irf8-GFP GMP subpopulations (e; IG1, IG2, IG3) or Gfi1-GFP GMP subpopulations (f; GG1, GG2, GG3) showing that all populations are phenotypically GMP (CD16/32high CD34high).
Extended Data Figure 10
Extended Data Figure 10. Clustering intermediates and Irf8−/−Gfi1−/− double knock-out GMP
a–h, GMP subpopulations enriched for CFU-GM also contain eosinophil-granulocyte progenitors. a, Plots displaying the incidence and amplitude of expression of select genes (from Fig. 4a). b, TaqMan analysis of eosinophil gene expression (IL5ra, Epx, Prg2) in the GMP subpopulations from Gfi1-GFP heterozygous mice. c, CFU assays with GMP subsets in media containing IL-3, GM-CSF, IL-5, SCF and TPO. d, CFU assays with GMP subsets with media containing IL5 and SCF (which supports eosinophil-granulocyte colonies). e, TaqMan analysis of eosinophil gene expression in colonies from GG1 cells. Mean CFU number of two technical replicates with similar results from 2 biological replicates. f, Cytospin analysis of eosinophils in GG1 derived CFU from panel i. g, Flow-cytometric analysis for eosinophil-granulocyte markers CCR3 and SiglecF on colonies from GG1 cells. Nearly all the GG1-derived IL5 + SCF CFU are positive for eosinophil markers. Representative FACS plot shown. h, TaqMan analysis of eosinophil genes (IL5ra, Epx, Prg2) in the GMP subpopulations from Irf8-GFP heterozygous mice. i, ICGS of GG1 and IG2 cells with those spanning the entire myeloid developmental spectrum (Fig. 1b). Cells were separated according to the flow cytometric sort gates. j–k, GG1 and IG1 cells that are enriched for CFU-GM also preferentially express HSCP1-and HSCP2-cluster genes. j, TaqMan analysis of HSCP1-HSCP2 genes in the GMP GG subpopulations. k, TaqMan analysis of HSCP1-HSCP2 genes in sorted IG subpopulations. l. Clustering Irf8−/−Gfi1−/− double knock-out single cell libraries. HOPACH hierarchical clustering of all cells from Fig. 1b, as well as IG2 and Irf8−/−Gfi1−/− double knock-out single cell libraries. Only genes from Fig. 1b and in the previously clustered results were included. Genes and cells outlined in the dotted box were re-clustered with HOPACH to delineate relationships between monocytic and granulocytic programming among the different indicated cell populations (Fig. 4c). Representative plot of the mean of two technical replicates from one of three independent experiments performed displayed (b,e,h,j,k).
Figure 1
Figure 1. ICGS ordering of the myeloid developmental hierarchy and derivation of regulatory states
a, Schematic illustration of scRNA-Seq ICGS workflow. b, Heatmap of genes delineated by ICGS (excluding cell cycle) in scRNA-Seq data (n=382 cells). Columns represent cells. Rows represent genes. Gene-expression clusters were generated in AltAnalyze using the HOPACH algorithm. ICGS cell clusters are indicated (top); HSCP (hematopoietic stem cell and progenitor), Meg (megakaryocytic), Eryth (erythroid), Multi-Lin* (multi-lineage primed), MDP (monocyte-dendritic cell precursor), Mono (monocytic), Gran (granulocytic), Myelocyte, Flow cytometric identifiers are indicated (below). ICGS guide genes are displayed (right). c, Plots displaying the incidence and amplitude of select genes delineated by ICGS. d, ICGS clustering of GMPs (n=132). e, TF-to-gene correlation analysis of GMPs. Heatmap displays HOPACH clustering of Pearson correlation coefficients among genes and TFs in designated ICGS clusters from panel d. Columns represent genes. Rows represent TFs. f–i, Scatterplots generated in R (using the pairs function) show expression levels (TPM) of select TF pairs in individual GMPs. Color key for ICGS clusters (bottom). Pearson correlation coefficient is indicated (top).
Figure 2
Figure 2. Counteracting gene regulatory network underlying myeloid cell fate determination
a, HOPACH clustering of wild type (WT), Irf8−/− and Gfi1−/− GMPs using Gfi1- or Irf8-correlated genes derived from scRNA-Seq of WT GMPs (rho>0.3, TPM>1). Genotypes and cell clusters of Irf8-high (blue) and Gfi1-high (green) or neither (purple) are indicated. along with genes shared with ICGS. b, ChIP-Seq analysis of Gfi1 and Irf8 in GMPs. Statistically enriched Gfi1 (p=6.63×10⁻⁸) and Ets-Irf composite element (EICE) motifs (p=1.08×10⁻⁶) are displayed. Venn diagram illustrates Gfi1, Irf8 and overlapping ChIP-Seq peaks. c, Integrative K-means cluster heatmap of overlapping Gfi1 and Irf8 peaks (656 genomic regions). Corresponding ATAC-Seq analysis in GMPs (GSE60103) and H3K4me2 ChIP-Seq tracks in wild type or Gfi1−/− lin bone marrow cells are shown. d, RNA-Seq analysis of GMPs with inducible Gfi1 expression. GMPs harboring tetracycline-inducer (rtTA-M2) and tetracycline-responsive (Gfi1-IRES-Venus) alleles were incubated with doxycycline overnight, then sorted for Venus expression. GMPs carrying one rtTA-M2 allele were sorted on the basis of low (1L) versus high (1H) Venus expression. Hierarchical clustering was performed as in Fig. 2a. Select genes shared with ICGS are indicated. e, Myeloid gene regulatory network displayed using BioTapestry51. Regulatory connections summarize perturbation and ChIP-Seq experiments. Indicated TFs are known or predicted to regulate monocyte/dendritic (left) or neutrophil (right) specification, respectively.
Figure 3
Figure 3. Detection of rare transition state poised to undergo myeloid cell fate determination
a, Schematic representation of the Irf8-GFP (IG) reporter allele. b, Flow cytometric analysis of Csf1r and GFP expression in GMPs. Gating strategy for IG1, IG2 and IG3 cells is indicated. c, TaqMan analysis of indicated transcripts in IG cells. d, Colony forming unit (CFU) assays with indicated IG cells. Percent distribution of colonies containing granulocytes (G), macrophages (M) or both (GM) is displayed on y-axis (n=3). e, Schematic representation Gfi1-GFP (GG) reporter allele. f, Flow cytometric analysis of Csf1r and GFP expression in GMPs. Gating strategy for GG1, GG2 and GG3 cells is indicated. g, TaqMan of indicated transcripts in GG cells as in panel 3c. h, CFU assays with indicated GG cells as in panel 3d. Representative plots from one of three independent experiments with each reporter are shown. c, g display two technical replicates.
Figure 4
Figure 4. Trapping rare myeloid transition state by removal of counteracting determinants
a, ICGS-based scRNA-Seq analysis of GG1 and IG2 cells (see Extended Data Figure 9 and Supplementary Methods). Known hematopoietic regulators and markers are indicated (right). b, HOPACH clustering of WT, IG2 and Irf8−/−Gfi1−/− GMPs based on ICGS-delineated genes (Fig. 1b), with indicated myeloid cellular states (right) (see global analysis in ED Fig. 10l). c, Monocyte or granulocyte gene enrichment analysis. The median expression value of a gene within cells of designated group was compared to its median value in all cells (Extended Data Fig. 10l) and average fold change (log2 ± SEM) was determined for monocytic or granulocytic genes.
Figure 5
Figure 5. Model of mixed-lineage transition states underlying myeloid cell-fate determination
Model depicts a hierarchical set of hematopoietic intermediates culminating in the specification of monocytic and granulocytic lineages. Cells are ordered on a Waddington landscape with their characteristic gene expression modules (color bars) and states. The prevalent (Multi-Lin*) and rare (bistable) mixed-lineage myeloid transition states, characterized herein, are proposed to manifest dynamic instability because of counteracting regulatory determinants. Although erythroid and megakaryocytic progenitors were found within CMPs, it remains to be determined if a distinct set of Multi-Lin* intermediates give rise to these progenitors via a rare bistable state.

References

    1. Grun D, et al. Single-cell messenger RNA sequencing reveals rare intestinal cell types. Nature. 2015;525:251–255. - PubMed
    1. Paul F, et al. Transcriptional Heterogeneity and Lineage Commitment in Myeloid Progenitors. Cell. 2015;163:1663–1677. - PubMed
    1. Satija R, Farrell JA, Gennert D, Schier AF, Regev A. Spatial reconstruction of single-cell gene expression data. Nat Biotechnol. 2015;33:495–502. - PMC - PubMed
    1. Trapnell C, et al. The dynamics and regulators of cell fate decisions are revealed by pseudotemporal ordering of single cells. Nat Biotechnol. 2014;32:381–386. - PMC - PubMed
    1. Yan L, et al. Single-cell RNA-Seq profiling of human preimplantation embryos and embryonic stem cells. Nat Struct Mol Biol. 2013;20:1131–1139. - PubMed

Publication types

MeSH terms