Anisotropic shrinkage of insect air sacs revealed in vivo by X-ray microtomography
- PMID: 27580585
- PMCID: PMC5007674
- DOI: 10.1038/srep32380
Anisotropic shrinkage of insect air sacs revealed in vivo by X-ray microtomography
Abstract
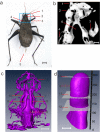
Air sacs are thought to be the bellows for insect respiration. However, their exact mechanism of action as a bellows remains unclear. A direct way to investigate this problem is in vivo observation of the changes in their three-dimensional structures. Therefore, four-dimensional X-ray phase contrast microtomography is employed to solve this puzzle. Quantitative analysis of three-dimensional image series reveals that the compression of the air sac during respiration in bell crickets exhibits obvious anisotropic characteristics both longitudinally and transversely. Volumetric changes of the tracheal trunks in the prothorax further strengthen the evidence of this finding. As a result, we conclude that the shrinkage and expansion of the insect air sac is anisotropic, contrary to the hypothesis of isotropy, thereby providing new knowledge for further research on the insect respiratory system.
Figures


Similar articles
-
Air sacs are a key adaptive trait of the insect respiratory system.J Exp Biol. 2023 May 15;226(10):jeb245712. doi: 10.1242/jeb.245712. Epub 2023 May 19. J Exp Biol. 2023. PMID: 37204298
-
Scanning and transmission electron microscopic study of the tracheal air sac system in a grasshopper Chrotogonus senegalensis (Kraus)--Orthoptera: Acrididae: Pyrgomorphinae.Anat Rec. 1989 Apr;223(4):393-405. doi: 10.1002/ar.1092230408. Anat Rec. 1989. PMID: 2712353
-
Evidence for avian intrathoracic air sacs in a new predatory dinosaur from Argentina.PLoS One. 2008 Sep 30;3(9):e3303. doi: 10.1371/journal.pone.0003303. PLoS One. 2008. PMID: 18825273 Free PMC article.
-
Effects of insect body size on tracheal structure and function.Adv Exp Med Biol. 2007;618:221-8. doi: 10.1007/978-0-387-75434-5_17. Adv Exp Med Biol. 2007. PMID: 18269200 Review.
-
A review of methods for analysing insect structures - the role of morphology in the age of phylogenomics.Curr Opin Insect Sci. 2016 Dec;18:60-68. doi: 10.1016/j.cois.2016.09.004. Epub 2016 Oct 14. Curr Opin Insect Sci. 2016. PMID: 27939712 Review.
Cited by
-
Dynamic X-ray speckle-tracking imaging with high-accuracy phase retrieval based on deep learning.IUCrJ. 2024 Jan 1;11(Pt 1):73-81. doi: 10.1107/S2052252523010114. IUCrJ. 2024. PMID: 38096037 Free PMC article.
-
Visualization of the hatching of brine shrimp eggs using ultrafast and high-resolution phase-contrast CTs.APL Bioeng. 2025 Mar 7;9(1):016113. doi: 10.1063/5.0238482. eCollection 2025 Mar. APL Bioeng. 2025. PMID: 40060158 Free PMC article.
-
Measurement of mass force field driving water refilling of cuttage.Sci Rep. 2024 Apr 18;14(1):8947. doi: 10.1038/s41598-024-59716-x. Sci Rep. 2024. PMID: 38637680 Free PMC article.
-
Accelerating imaging research at large-scale scientific facilities through scientific computing.J Synchrotron Radiat. 2024 Sep 1;31(Pt 5):1317-1326. doi: 10.1107/S1600577524007239. Epub 2024 Aug 27. J Synchrotron Radiat. 2024. PMID: 39190504 Free PMC article.
References
-
- Chapman R. F. The Insects: Structure and Function. (Cambridge Univ. Press, Cambridge, 1998).
-
- Buck J. Some physical aspects of insect respiration. Annu. Rev. Entomol. 7, 27 (1962).
-
- Lighton J. R. Discontinuous gas exchange in insects. Annu Rev Entomol 41, 309–324 (1996). - PubMed
Publication types
MeSH terms
LinkOut - more resources
Full Text Sources
Other Literature Sources
Research Materials

