

Gene Expression in Mouse Thyrotrope Adenoma: Transcription Elongation Factor Stimulates Proliferation
- PMID: 27580811
- PMCID: PMC5007889
- DOI: 10.1210/en.2016-1183
Gene Expression in Mouse Thyrotrope Adenoma: Transcription Elongation Factor Stimulates Proliferation
Abstract
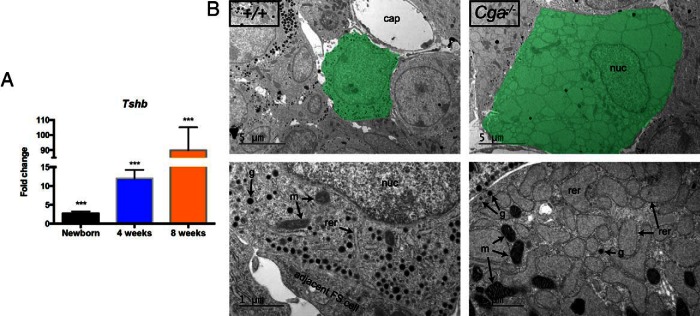
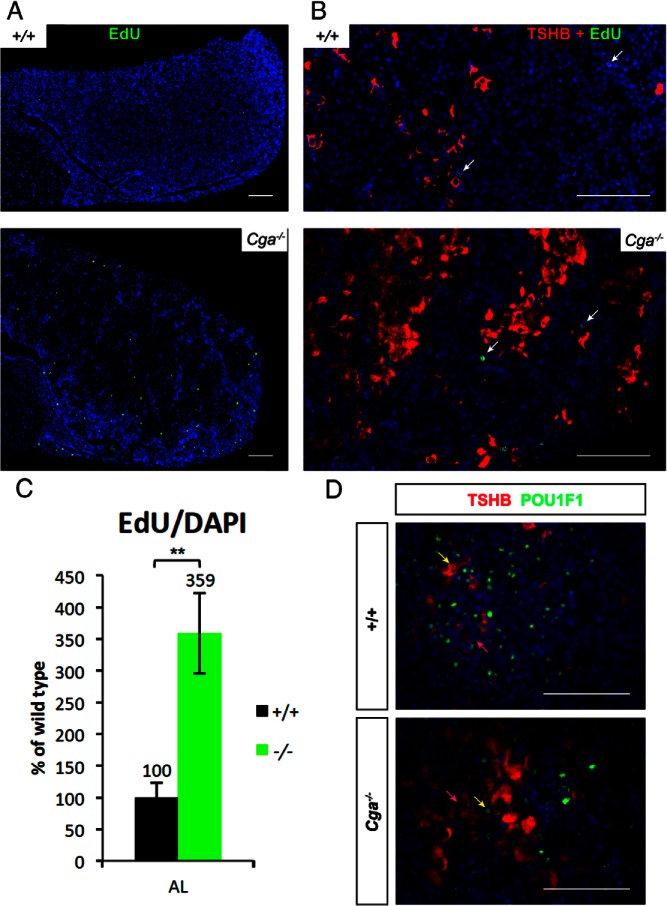
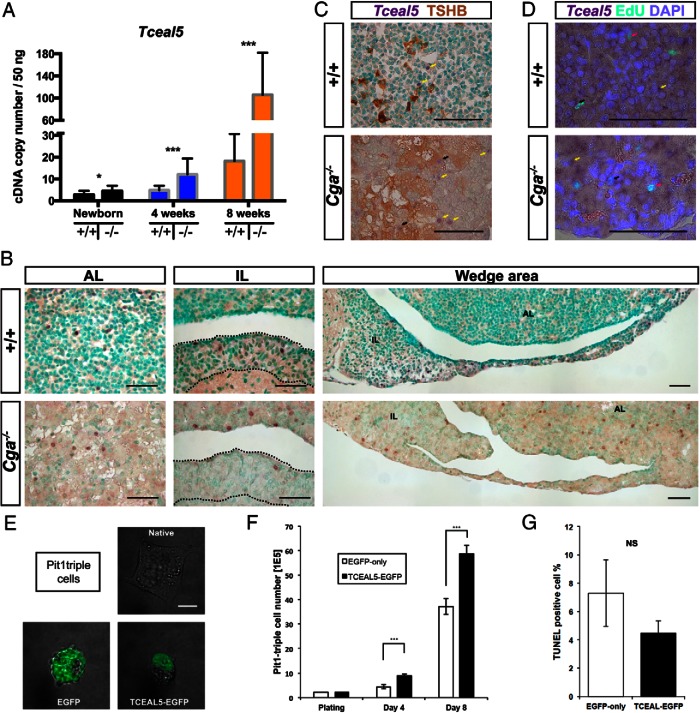
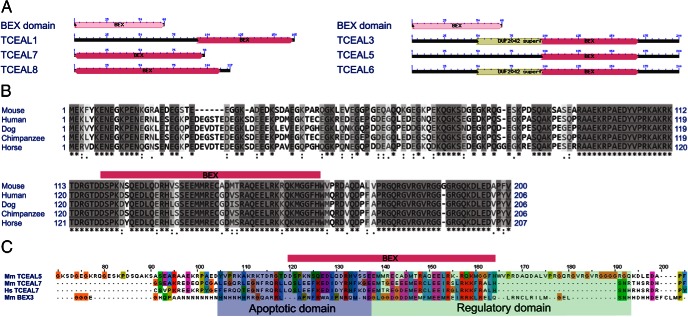
Thyrotrope hyperplasia and hypertrophy are common responses to primary hypothyroidism. To understand the genetic regulation of these processes, we studied gene expression changes in the pituitaries of Cga(-/-) mice, which are deficient in the common α-subunit of TSH, LH, and FSH. These mice have thyrotrope hypertrophy and hyperplasia and develop thyrotrope adenoma. We report that cell proliferation is increased, but the expression of most stem cell markers is unchanged. The α-subunit is required for secretion of the glycoprotein hormone β-subunits, and mutants exhibit elevated expression of many genes involved in the unfolded protein response, consistent with dilation and stress of the endoplasmic reticulum. Mutants have elevated expression of transcription factors that are important in thyrotrope function, such as Gata2 and Islet 1, and those that stimulate proliferation, including Nupr1, E2f1, and Etv5. We characterized the expression and function of a novel, overexpressed gene, transcription elongation factor A (SII)-like 5 (Tceal5). Stable expression of Tceal5 in a pituitary progenitor cell line is sufficient to increase cell proliferation. Thus, Tceal5 may act as a proto-oncogene. This study provides a rich resource for comparing pituitary transcriptomes and an analysis of gene expression networks.
Figures
Similar articles
-
ISL1 Is Necessary for Maximal Thyrotrope Response to Hypothyroidism.Mol Endocrinol. 2015 Oct;29(10):1510-21. doi: 10.1210/me.2015-1192. Epub 2015 Aug 21. Mol Endocrinol. 2015. PMID: 26296153 Free PMC article.
-
Induction of GH, PRL, and TSH beta mRNA by transfection of Pit-1 in a human pituitary adenoma-derived cell line.Cell Tissue Res. 2005 Nov;322(2):269-77. doi: 10.1007/s00441-005-0033-z. Epub 2005 Nov 3. Cell Tissue Res. 2005. PMID: 16133148
-
The HMG-box transcription factor Sox4b is required for pituitary expression of gata2a and specification of thyrotrope and gonadotrope cells in zebrafish.Mol Endocrinol. 2012 Jun;26(6):1014-27. doi: 10.1210/me.2011-1319. Epub 2012 Apr 27. Mol Endocrinol. 2012. PMID: 22543271 Free PMC article.
-
T(3) rapidly regulates several steps of alpha subunit glycoprotein (CGA) synthesis and secretion in the pituitary of male rats: Potential repercussions on TSH, FSH and LH secretion.Mol Cell Endocrinol. 2015 Jul 5;409:73-81. doi: 10.1016/j.mce.2015.04.002. Epub 2015 Apr 11. Mol Cell Endocrinol. 2015. PMID: 25869399
-
Pit-1 gene expression in human pituitary adenomas.Horm Res. 1997;47(4-6):251-8. doi: 10.1159/000185472. Horm Res. 1997. PMID: 9167960 Review.
Cited by
-
Characterization of an eutherian gene cluster generated after transposon domestication identifies Bex3 as relevant for advanced neurological functions.Genome Biol. 2020 Oct 26;21(1):267. doi: 10.1186/s13059-020-02172-3. Genome Biol. 2020. PMID: 33100228 Free PMC article.
-
A novel risk model based on the correlation between the expression of basement membrane genes and immune infiltration to predict the invasiveness of pituitary adenomas.Front Endocrinol (Lausanne). 2023 Jan 4;13:1079777. doi: 10.3389/fendo.2022.1079777. eCollection 2022. Front Endocrinol (Lausanne). 2023. PMID: 36686480 Free PMC article.
-
Acquired thyroid-stimulating hormone, luteinizing hormone, and follicle-stimulating hormone deficiencies with circulating anti-glycoprotein hormones alpha chain-positive cell antibodies.Endocrine. 2024 Nov;86(2):769-773. doi: 10.1007/s12020-024-03922-0. Epub 2024 Jun 21. Endocrine. 2024. PMID: 38907115
-
Multi-omic profiling of pituitary thyrotropic cells and progenitors.BMC Biol. 2021 Apr 15;19(1):76. doi: 10.1186/s12915-021-01009-0. BMC Biol. 2021. PMID: 33858413 Free PMC article.
-
Rathke's cleft-like cysts arise from Isl1 deletion in murine pituitary progenitors.J Clin Invest. 2020 Aug 3;130(8):4501-4515. doi: 10.1172/JCI136745. J Clin Invest. 2020. PMID: 32453714 Free PMC article.
References
-
- Camper SA, Saunders TL, Katz RW, Reeves RH. The Pit-1 transcription factor gene is a candidate for the murine Snell dwarf mutation. Genomics. 1990;8:586–590. - PubMed
-
- Li S, Crenshaw EB, 3rd, Rawson EJ, Simmons DM, Swanson LW, Rosenfeld MG. Dwarf locus mutants lacking three pituitary cell types result from mutations in the POU-domain gene pit-1. Nature. 1990;347:528–533. - PubMed
-
- Sornson MW, Wu W, Dasen JS, et al. Pituitary lineage determination by the Prophet of Pit-1 homeodomain factor defective in Ames dwarfism. Nature. 1996;384:327–333. - PubMed
-
- Simmons DM, Voss JW, Ingraham HA, et al. Pituitary cell phenotypes involve cell-specific Pit-1 mRNA translation and synergistic interactions with other classes of transcription factors. Genes Dev. 1990;4:695–711. - PubMed
-
- Japón MA, Rubinstein M, Low MJ. In situ hybridization analysis of anterior pituitary hormone gene expression during fetal mouse development. J Histochem Cytochem. 1994;42:1117–1125. - PubMed
MeSH terms
Substances
Grants and funding
LinkOut - more resources
Full Text Sources
Other Literature Sources
Medical
Molecular Biology Databases
Research Materials
