

Tomographic brain imaging with nucleolar detail and automatic cell counting
- PMID: 27581254
- PMCID: PMC5007499
- DOI: 10.1038/srep32156
Tomographic brain imaging with nucleolar detail and automatic cell counting
Abstract
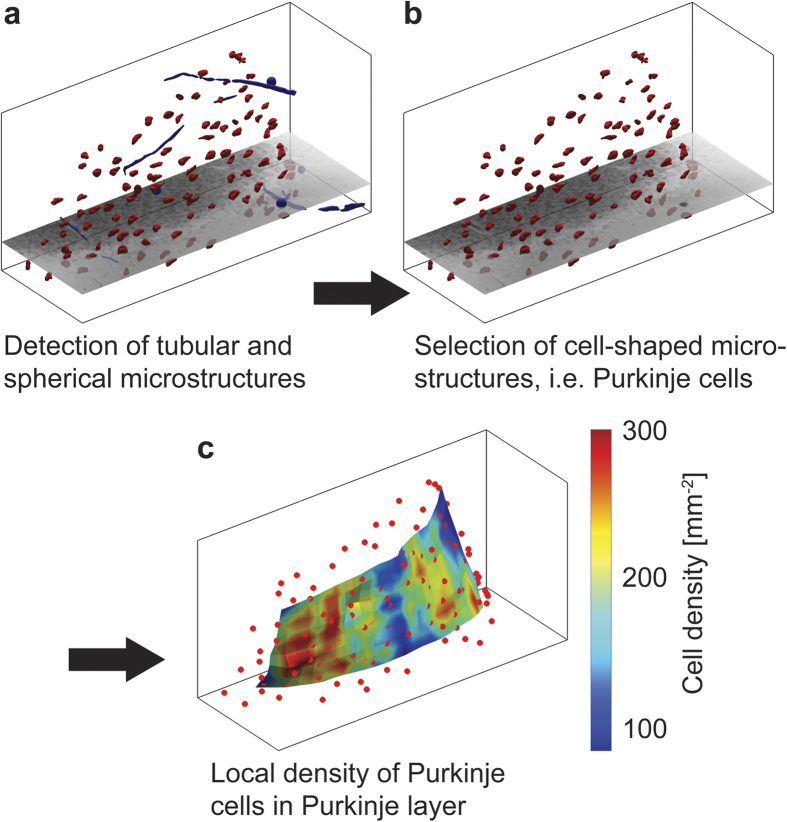
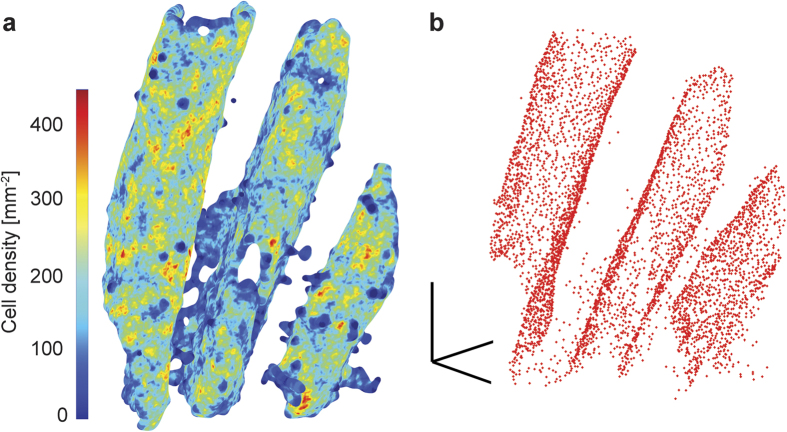
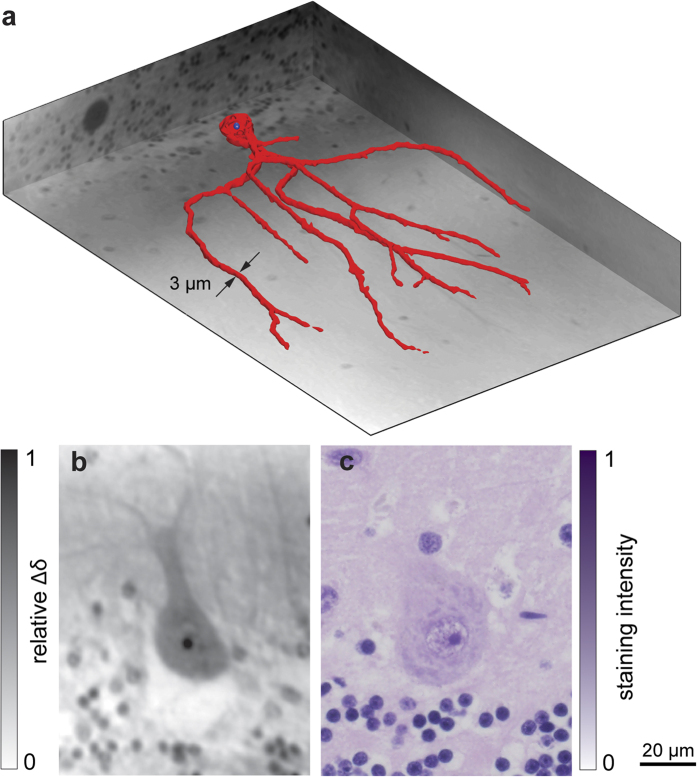
Brain tissue evaluation is essential for gaining in-depth insight into its diseases and disorders. Imaging the human brain in three dimensions has always been a challenge on the cell level. In vivo methods lack spatial resolution, and optical microscopy has a limited penetration depth. Herein, we show that hard X-ray phase tomography can visualise a volume of up to 43 mm(3) of human post mortem or biopsy brain samples, by demonstrating the method on the cerebellum. We automatically identified 5,000 Purkinje cells with an error of less than 5% at their layer and determined the local surface density to 165 cells per mm(2) on average. Moreover, we highlight that three-dimensional data allows for the segmentation of sub-cellular structures, including dendritic tree and Purkinje cell nucleoli, without dedicated staining. The method suggests that automatic cell feature quantification of human tissues is feasible in phase tomograms obtained with isotropic resolution in a label-free manner.
Figures
Similar articles
-
Three-dimensional virtual histology of human cerebellum by X-ray phase-contrast tomography.Proc Natl Acad Sci U S A. 2018 Jul 3;115(27):6940-6945. doi: 10.1073/pnas.1801678115. Epub 2018 Jun 18. Proc Natl Acad Sci U S A. 2018. PMID: 29915047 Free PMC article.
-
High-resolution tomographic imaging of a human cerebellum: comparison of absorption and grating-based phase contrast.J R Soc Interface. 2010 Dec 6;7(53):1665-76. doi: 10.1098/rsif.2010.0281. Epub 2010 Jul 21. J R Soc Interface. 2010. PMID: 20659930 Free PMC article.
-
Fractionator studies on Purkinje cells in the human cerebellum: numbers in right and left halves of male and female brains.J Anat. 1990 Apr;169:63-70. J Anat. 1990. PMID: 2200769 Free PMC article.
-
Extending two-dimensional histology into the third dimension through conventional micro computed tomography.Neuroimage. 2016 Oct 1;139:26-36. doi: 10.1016/j.neuroimage.2016.06.005. Epub 2016 Jun 14. Neuroimage. 2016. PMID: 27321044
-
Purkinje cell complements in mammalian cerebella and the biases incurred by counting nucleoli.J Anat. 1993 Aug;183 ( Pt 1)(Pt 1):155-60. J Anat. 1993. PMID: 8270470 Free PMC article.
Cited by
-
Assessment of plaque morphology in Alzheimer's mouse cerebellum using three-dimensional X-ray phase-based virtual histology.Sci Rep. 2020 Jul 8;10(1):11233. doi: 10.1038/s41598-020-68045-8. Sci Rep. 2020. PMID: 32641715 Free PMC article.
-
Multi-resolution X-ray phase-contrast and dark-field tomography of human cerebellum with near-field speckles.Biomed Opt Express. 2023 Dec 7;15(1):142-161. doi: 10.1364/BOE.502664. eCollection 2024 Jan 1. Biomed Opt Express. 2023. PMID: 38223169 Free PMC article.
-
Phase-contrast x-ray tomography of neuronal tissue at laboratory sources with submicron resolution.J Med Imaging (Bellingham). 2020 Jan;7(1):013502. doi: 10.1117/1.JMI.7.1.013502. Epub 2020 Feb 20. J Med Imaging (Bellingham). 2020. PMID: 32118088 Free PMC article.
-
Simultaneous 3D Visualization of the Microvascular and Neural Network in Mouse Spinal Cord Using Synchrotron Radiation Micro-Computed Tomography.Neurosci Bull. 2021 Oct;37(10):1469-1480. doi: 10.1007/s12264-021-00715-7. Epub 2021 Jun 19. Neurosci Bull. 2021. PMID: 34146232 Free PMC article.
-
Optimising complementary soft tissue synchrotron X-ray microtomography for reversibly-stained central nervous system samples.Sci Rep. 2018 Aug 13;8(1):12017. doi: 10.1038/s41598-018-30520-8. Sci Rep. 2018. PMID: 30104610 Free PMC article.
References
-
- Ramon y Cajal S. Sobre las fibras nerviosas de la capa molecular del cerebelo. Rev. Trim. Histol. Normal Patol. 1, 33–49 (1888).
-
- Desmond J. E. & Fiez J. A. Neuroimaging studies of the cerebellum: Language, learning and memory. Trends Cogn. Sci. 2, 355–62 (1998). - PubMed
-
- Kim J. et al.. Longitudinal FDG microPET imaging of neuropathic pain: Does cerebellar activity correlate with neuropathic pain development in a rat model? Acta Neurochir. 157, 1051–7 (2015). - PubMed
-
- Cianciaruso C. et al.. Cellular magnetic resonance with iron oxide nanoparticles: long-term persistence of SPIO signal in the CNS after transplanted cell death. Nanomedicine (Lond) 9, 1457–74 (2014). - PubMed
Publication types
MeSH terms
LinkOut - more resources
Full Text Sources
Other Literature Sources
Medical
