. 2016 Sep 1:7:12596.
doi: 10.1038/ncomms12596.

Bach2-Batf interactions control Th2-type immune response by regulating the IL-4 amplification loop

Affiliations

Bach2-Batf interactions control Th2-type immune response by regulating the IL-4 amplification loop

Makoto Kuwahara et al. Nat Commun. .

Abstract

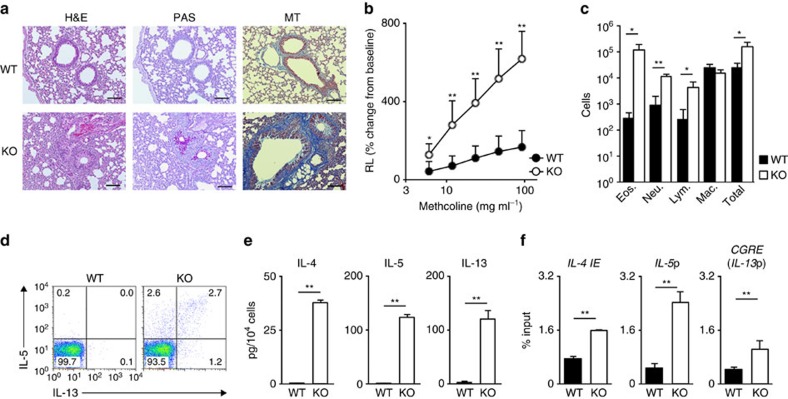
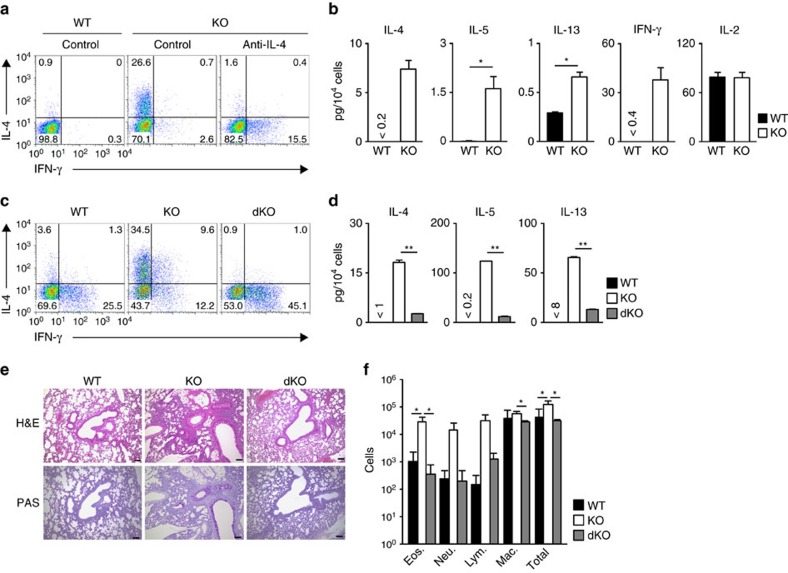
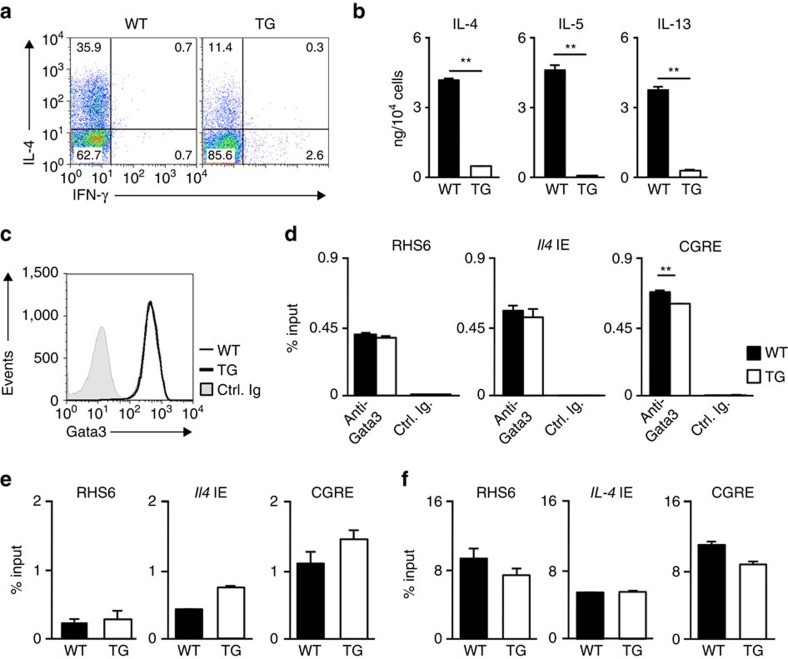
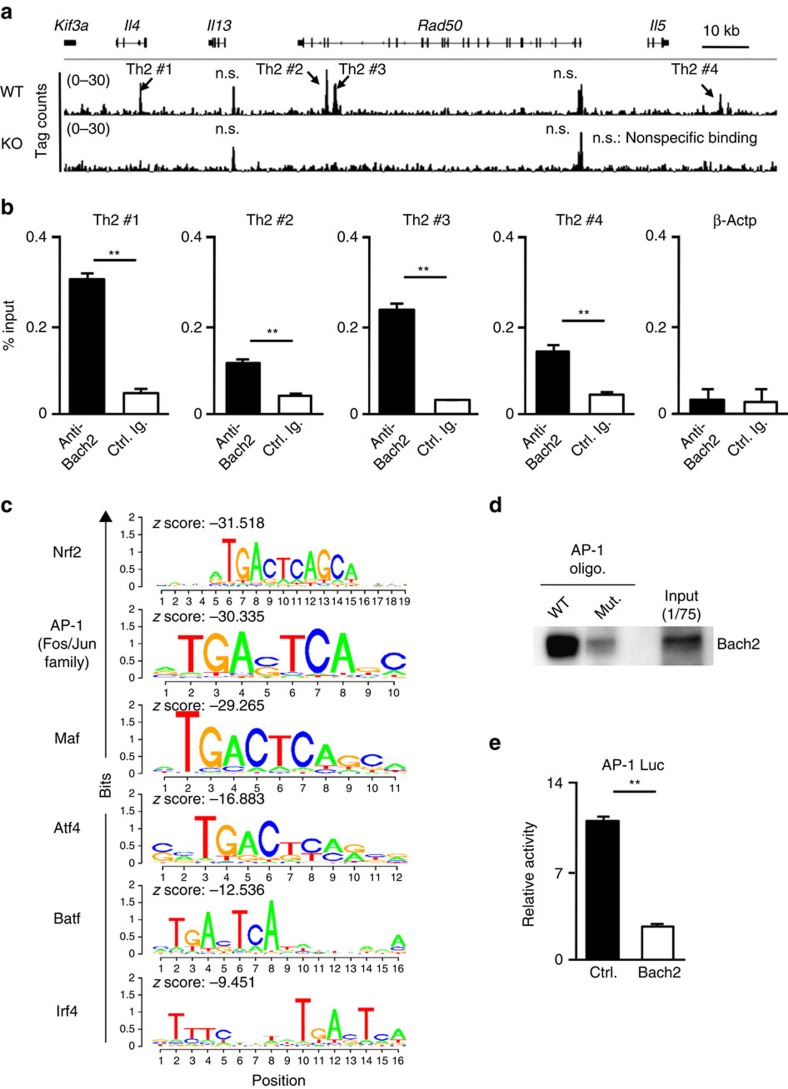
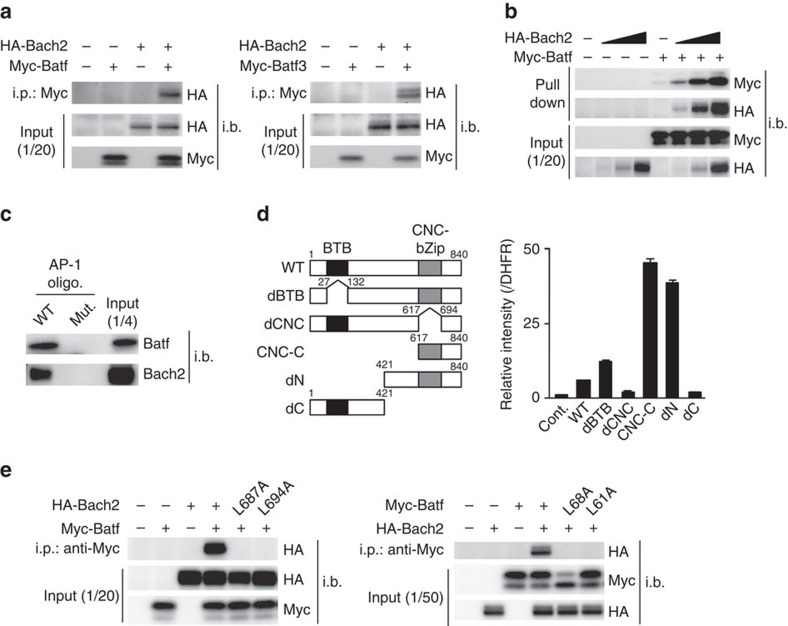
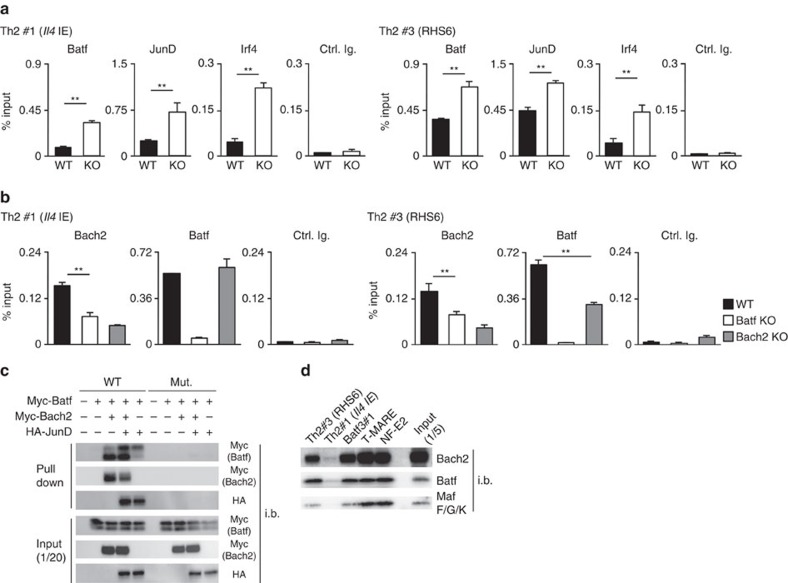
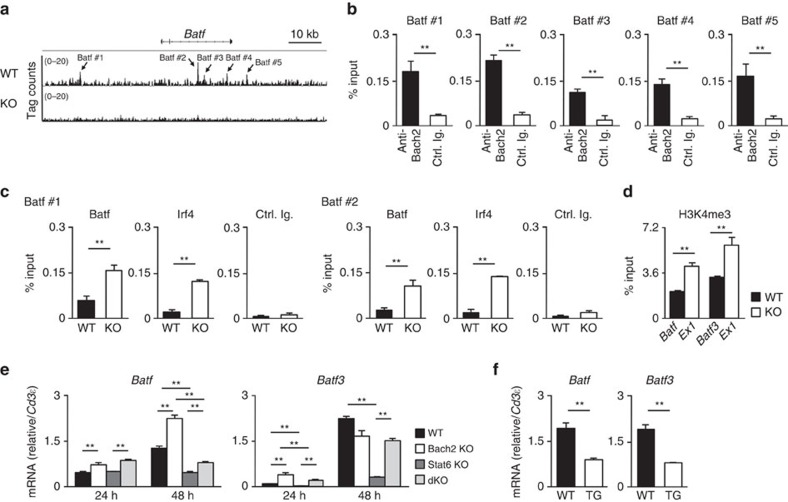
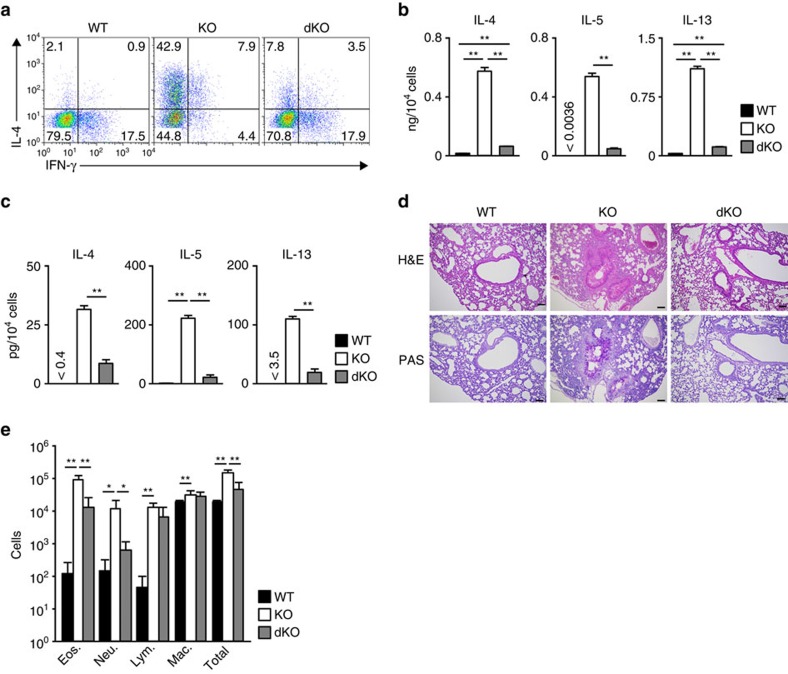
Although Bach2 has an important role in regulating the Th2-type immune response, the underlying molecular mechanisms remain unclear. We herein demonstrate that Bach2 associates with Batf and binds to the regulatory regions of the Th2 cytokine gene loci. The Bach2-Batf complex antagonizes the recruitment of the Batf-Irf4 complex to AP-1 motifs and suppresses Th2 cytokine production. Furthermore, we find that Bach2 regulates the Batf and Batf3 expressions via two distinct pathways. First, Bach2 suppresses the maintenance of the Batf and Batf3 expression through the inhibition of IL-4 production. Second, the Bach2-Batf complex directly binds to the Batf and Batf3 gene loci and reduces transcription by interfering with the Batf-Irf4 complex. These findings suggest that IL-4 and Batf form a positive feedback amplification loop to induce Th2 cell differentiation and the subsequent Th2-type immune response, and Bach2-Batf interactions are required to prevent an excessive Th2 response.


Figures

Figure 1
Figure 1. Spontaneous development of allergic airway inflammation in mice with T cell-specific Bach2 deficiency.
(a) Microscopic appearance of the lungs of wild-type and Bach2fl/fl x CD4-Cre TG (Bach2 KO) mice (n=5 per group), fixed and stained with haematoxylin and eosin (H&E; left panel), periodic acid-Schiff (PAS) reagent (middle panel) and Masson's trichrome (MT; right panel). Original magnification × 200 (Scale bars, 100 μm). (b) Airway resistance of the lungs of the wild-type or Bach2 KO mice (mean±s.d., n=5 per group). *P<0.05 and **P<0.01 (ANOVA and Bonferroni's test). (c) Quantification of eosinophils, neutrophils, lymphocytes, macrophages and total cells in the BAL fluid of the wild-type and Bach2 KO mice (mean±s.d., n=8 per group). *P<0.05 and **P<0.01 (Student's t-test). (d) The results of the intracellular flow cytometry analysis of IL-5 and IL-13 in lung CD4 T cells stimulated with 4-beta-phorbol 12-myristate acetate (PMA) plus ionomycin for 4 h. The numbers of cells are indicated in each quadrant. The data are representative of three-independent experiments with similar results. (e) The results of the ELISA for cytokines in the supernatants derived from the lung CD4 T cells stimulated with an immobilized anti-TCR-β mAb and an anti-CD28 mAb for 16 h (mean±s.d., n=3 per group). **P<0.01 (Student's t-test). (f) The levels of histone H3K27 acetylation at the Th2 cytokine gene loci in the lung CD4 T cells were determined using a ChIP-qPCR assay; the results are presented relative to those of input DNA with the s.d. **P<0.01 (Student's t-test) (mean±s.d., n=5).
Figure 2
Figure 2. The IL-4/Stat6-dependent augmentation of the Th2-type immune response in Bach2-deficient mice.
(a) The results of the intracellular flow cytometry analysis of IL-4/IFN-γ in the wild-type (WT) and Bach2-deficient naive CD4 T cells cultured under IL-2 conditions in the absence (left) or presence (right) of a neutralizing mAb against IL-4. The numbers of cells are indicated in each quadrant. The data are representative of three-independent experiments with similar results. (b) The results of the ELISA for cytokines in the supernatants of the WT and Bach2 KO naive CD4 T cells stimulated with an immobilized anti-TCR-β mAb and an anti-CD28 mAb for 16 h. *P<0.05 and **P<0.01 (Student's t-test) (mean±s.d., n=3 per group). The data are representative of at least three-independent experiments with similar results. (c) The results of the intracellular flow cytometry analysis of IL-4/IFN-γ in the WT, Bach2-deficient (KO) and Bach2/Stat6 double-deficient (dKO) naive CD4 T cells cultured under IL-2 conditions. The numbers of cells are indicated in each quadrant. The data are representative of three-independent experiments with similar results. (d) The results of the ELISA for cytokines in the supernatants derived from wild-type (WT), Bach2-deficient (KO) and Bach2/Stat6 double-deficient (dKO) lung CD4 T cells (mean±s.d., n=3 per group) stimulated with an immobilized anti-TCR-β mAb and an anti-CD28 mAb for 16 h. **P<0.01 (Student's t-test). (e) Microscopic appearance of the lungs of wild-type (WT), Bach2-deficient (KO) and Bach2/Stat6 double-deficient (dKO) mice (mean±s.d., n=5 per group), fixed and stained with haematoxylin and eosin (H&E; upper panel) or periodic acid-Schiff (PAS) reagent (lower panel). Original magnification × 200 (Scale bars, 100 μm). (f) Quantification of eosinophils, neutrophils, lymphocytes, macrophages and total cells in the BAL fluid of the wild-type (WT), Bach2-deficient (KO) and Bach2/Stat6 double-deficient (dKO) mice (mean±s.d., n=5 per group). *P<0.05 (Student's t-test).
Figure 3
Figure 3. Decreased Th2 cell differentiation and Th2 cytokine production in Bach2-TG naive CD4 T cells.
(a) The results of the intracellular flow cytometry analysis of IL-4/IFN-γ in the wild-type (WT) and Bach2-TG naive CD4 T cells cultured under Th2 conditions. The numbers of cells are indicated in each quadrant. The data are representative of at least three-independent experiments with similar results. (b) The results of the ELISA for cytokines in the supernatants of the cells in (a) stimulated with an immobilized anti-TCR-β mAb for 16 h. **P<0.01 (Student's t-test; mean±s.d., n=3). (c) The results of the flow cytometry analysis of Gata3 in WT or Bach2-deficient naive CD4 T cells cultured under Th2 conditions for 2 days. The data are representative of at least three-independent experiments with similar results. (d) The results of the ChIP assay of the binding of Gata3 to the RHS6 within the LCR of the Th2 cytokine gene locus, the Il4 IE and the CGRE in naive CD4 T cells cultured under Th2 conditions for 2 days; the results are presented relative to those of input DNA with the s.d. **P<0.01 (Student's t-test; n=3). (e,f) The levels of histone H3K4 tri-methylation (e) and H3K27 acetylation (f) at the Th2 cytokine gene loci in naive CD4 T cells cultured under Th2 condition for 2 days were determined using a ChIP-qPCR assay; the results are presented relative to those of input DNA with the s.d. **P<0.01 (Student's t-test; n=5).
Figure 4
Figure 4. Bach2 binds to the AP-1 motif containing regulatory regions of Th2 cytokine gene loci.
(a) Global patterns of Bach2 binding at the Th2 cytokine gene loci in the WT and Bach2-deficient naive cells cultured under neutral conditions for 5 days were determined using a ChIP-seq analysis. (b) The results of the ChIP assay with a quantitative PCR analysis of Bach2 binding in the WT naive CD4 T cells cultured under IL-2 conditions for 2 days; the results are presented relative to those of input DNA with the s.d. **P<0.01 (Student's t-test; n=3). (c) Enriched Bach2-binding motifs in the naive CD4 T cells cultured under neutral conditions for 5 days. (d) The results of the pull-down assay of the binding of Bach2 to wild-type (WT) or mutant (Mut.) AP-1 consensus oligonucleotides in the effector CD4 T cell lysates. The data are representative of at least three-independent experiments with similar results. (e) The luciferase activity in 293 T cells transfected with an empty vector or Bach2, as well as a firefly luciferase reporter for AP-1, was unstimulated or stimulated with the phorbol ester 4-beta-phorbol 12-myristate acetate (PMA) (30 ng ml−1) for 16 h; the results are presented relative to the Renilla luciferase activity with the s.d. **P<0.01 (Student's t-test; n=3).
Figure 5
Figure 5. The association of Bach2 with Batf family proteins.
(a) Immunoprecipitation (i.p.) and immunoblot (i.b.) analyses of the association of Bach2 and Batf in 293 T cell lysates left untransfected (−) or transfected (+) to express Myc-tagged Batf (Myc-Batf) and/or HA-tagged Bach2 (HA-Bach2; left) or to express Myc-tagged Batf (Myc-Batf3) and/or HA-tagged Bach2 (HA-Bach2; right); below (Input), a parallel analysis of the total cell lysates (without i.p.). The data are representative of three-independent experiments with similar results. (b) A pull-down assay of the binding of the Batf/Bach2 complex to an AP-1 consensus oligonucleotide in 293 T cell lysates transfected to express Myc-Batf and/or HA-Bach2 (Input (below), i.b. analysis of whole-cell lysates without precipitation). Wedges indicate 3-fold ‘titration' of the input lysates. The data are representative of independent experiments with similar results. (c) The results of the pull-down assay of the binding of Bach2–Batf complex to wild-type (WT) or mutant (Mut.) AP-1 consensus oligonucleotides in the effector CD4 T cell lysates. The data are representative of three-independent experiments with similar results. (d) A schematic representation of the Bach2 mutants (left). The results of the AlphaScreen to detect the interaction of Batf with the Bach2 mutants (right). The relative intensities to dihydrofolate reductase (DHFR) binding are presented as the averages of three-independent experiments. (e) i.p. and i.b. analyses of the association of the wild-type Batf with Bach2 point mutants (L687A and L694A) (left) or wild-type Bach2 with Batf point mutants (L68A and L61A) (right l) in 293 T cell lysates. The cell lysates were prepared as described in (a). The data are representative of three-independent experiments with similar results.
Figure 6
Figure 6. The Bach2/Batf complex interferes with the recruitment of the Batf/JunD/Irf4 active complex.
(a) The results of the ChIP assay of Batf, JunD or Irf4 binding at Th2#1 (Il4 IE) and Th2#3 (RHS6 region) using a quantitative PCR (qPCR) analysis with wild-type (WT) and Bach2-deficient CD4 T cells cultured under IL-2 conditions for 48 h; the results are presented relative to those of input DNA with the s.d. *P<0.05 and **P<0.01 (Student's t-test; n=3). The data are representative of at least three-independent experiments with similar results. (b) The results of the ChIP assay of Bach2 or Batf binding at Th2#1 (Il4 IE) and Th2#3 (RHS6) using a qPCR analysis with WT, Batf-deficient and Bach2-deficient CD4 T cells cultured under IL-2 conditions for 48 h; the results are presented relative to those of input DNA with the s.d. *P<0.05 and **P<0.01 (Student's t-test; n=3). The data are representative of at least three-independent experiments with similar results. (c) A pull-down assay of binding of the Batf/Bach2 complex and Batf/JunD complex to a Th2#3 oligonucleotide (WT) or AP-1 motif-mutated Th2#3 oligonucleotide (Mut.) in 293 T cell lysates left untransfected (−) or transfected (+) to express Myc-Batf, Myc-Bach2 and/or HA-tagged JunD (HA-JunD); below (Input), a parallel analysis of total cell lysates (without immunoprecipitation). The data are representative of three-independent experiments with similar results. (d) The results of the pull-down assay of the binding of Bach2–Batf complex to the RHS6 and Batf3#1 oligonucleotide in the Th2 cell lysates. The data are representative of three-independent experiments with similar results.
Figure 7
Figure 7. Bach2 inhibits the formation of a positive feedback loop to induce Th2 cell development.
(a) Global patterns of Bach2 binding to the Batf gene locus in the wild-type (WT) and Bach2-deficient naive cells cultured under neutral conditions for 5 days were determined using a ChIP-seq analysis. (b) Results of the ChIP assay with a quantitative PCR (qPCR) analysis of Bach2 binding to the Batf gene locus in the WT naive CD4 T cells cultured under IL-2 conditions for 48 h; the results are presented relative to those of input DNA with the s.d. **P<0.01 (Student's t-test; n=3). (c) Results of the ChIP assay with a qPCR analysis of Batf or Irf4 binding at the Batf #1 and Batf #2 regions in the WT and Bach2-deficient CD4 T cells cultured under neutral conditions for 48 h; the results are presented relative to those of input DNA with the s.d. *P<0.05 and **P<0.01 (Student's t-test; n=3). The data are representative of three-independent experiments with similar results. (d) The levels of histone H3K4 tri-methylation at the transcription start sites of the Batf and Batf3 gene loci in the WT or Bach2-deficient naive CD4 T cells cultured under IL-2 conditions for 48 h were determined using a ChIP-qPCR assay; the results are presented relative to those of input DNA with the s.d. **P<0.01 (Student's t-test; n=3). (e) Results of the quantitative reverse transcription (RT)–PCR analysis of Batf and Batf3 mRNA in the WT, Bach2-, Stat6- or Bach2/Stat6 double-deficient naive CD4 T cells stimulated with an anti-TCR-β mAb plus an anti-CD28 mAb in the presence of IL-2 for the indicated hours. The results are presented relative to the mRNA expression of Cd3ɛ, with the s.d. **P<0.01 (Student's t-test; n=3). (f) Results of the quantitative RT–PCR analysis of Bach2 and Batf3 mRNA in the WT or Bach2 TG naive CD4 T cells cultured under Th2 conditions for 48 h. The results are presented relative to the mRNA expression of Cd3ɛ, with the s.d. **P<0.01 (Student's t-test; n=3).
Figure 8
Figure 8. The augmented Th2-type immune response in the Bach2-deficient mice was normalized by T cell-specific Batf deletion.
(a) The results of the intracellular flow cytometry analysis of IL-4/IFN-γ in the WT, Bach2-deficient (KO) and Bach2/Batf double-deficient (dKO) naive CD4 T cells cultured under IL-2 conditions. The numbers of cells are indicated in each quadrant. The data are representative of three-independent experiments with similar results. (b) Results of the ELISA for cytokines in the supernatants of the cells in (a) stimulated with an immobilized anti-TCR-β mAb for 16 h. **P<0.01 (Student's t-test; mean±s.d., n=3). (c) Results of the ELISA for cytokines in the supernatants derived from the lung CD4 T cells from indicated mice stimulated with an immobilized anti-TCR-β mAb and an anti-CD28 mAb for 16 h. **P<0.01 (Student's t-test; mean±s.d., n=4). (d) Microscopic appearance of the lungs of wild-type (WT), Bach2-deficient (KO) and Bach2/Batf double-deficient (dKO) mice (mean±s.d., n=5 per group), fixed and stained with haematoxylin and eosin (H&E; upper panel) or periodic acid-Schiff (PAS) reagent (lower panel). Original magnification × 200 (Scale bars, 100 μm). (e) Quantification of eosinophils, neutrophils, lymphocytes, macrophages and total cells in the BAL fluid of the wild-type (WT), Bach2-deficient (KO) and Bach2/Batf double-deficient (dKO) mice (mean±s.d., n=5 per group). *P<0.05 and **P<0.01 (Student's t-test).

References

    1. O'Shea J. J. & Paul W. E. Mechanisms underlying lineage commitment and plasticity of helper CD4+ T cells. Science 327, 1098–1102 (2010). - PMC - PubMed
    1. Reiner S. L. Development in motion: helper T cells at work. Cell 129, 33–36 (2007). - PubMed
    1. Zhu J., Yamane H. & Paul W. E. Differentiation of effector CD4 T cell populations (*). Annu. Rev. Immunol. 28, 445–489 (2010). - PMC - PubMed
    1. Sakaguchi S., Yamaguchi T., Nomura T. & Ono M. Regulatory T cells and immune tolerance. Cell 133, 775–787 (2008). - PubMed
    1. Korn T., Bettelli E., Oukka M. & Kuchroo V. K. IL-17 and Th17 Cells. Annu. Rev. Immunol. 27, 485–517 (2009). - PubMed

Publication types

MeSH terms