. 2016 Aug 31;36(35):9097-110.
doi: 10.1523/JNEUROSCI.4239-15.2016.

Galvanic Vestibular Stimulation: Cellular Substrates and Response Patterns of Neurons in the Vestibulo-Ocular Network

Affiliations

Galvanic Vestibular Stimulation: Cellular Substrates and Response Patterns of Neurons in the Vestibulo-Ocular Network

Kathrin D Gensberger et al. J Neurosci. .

Abstract

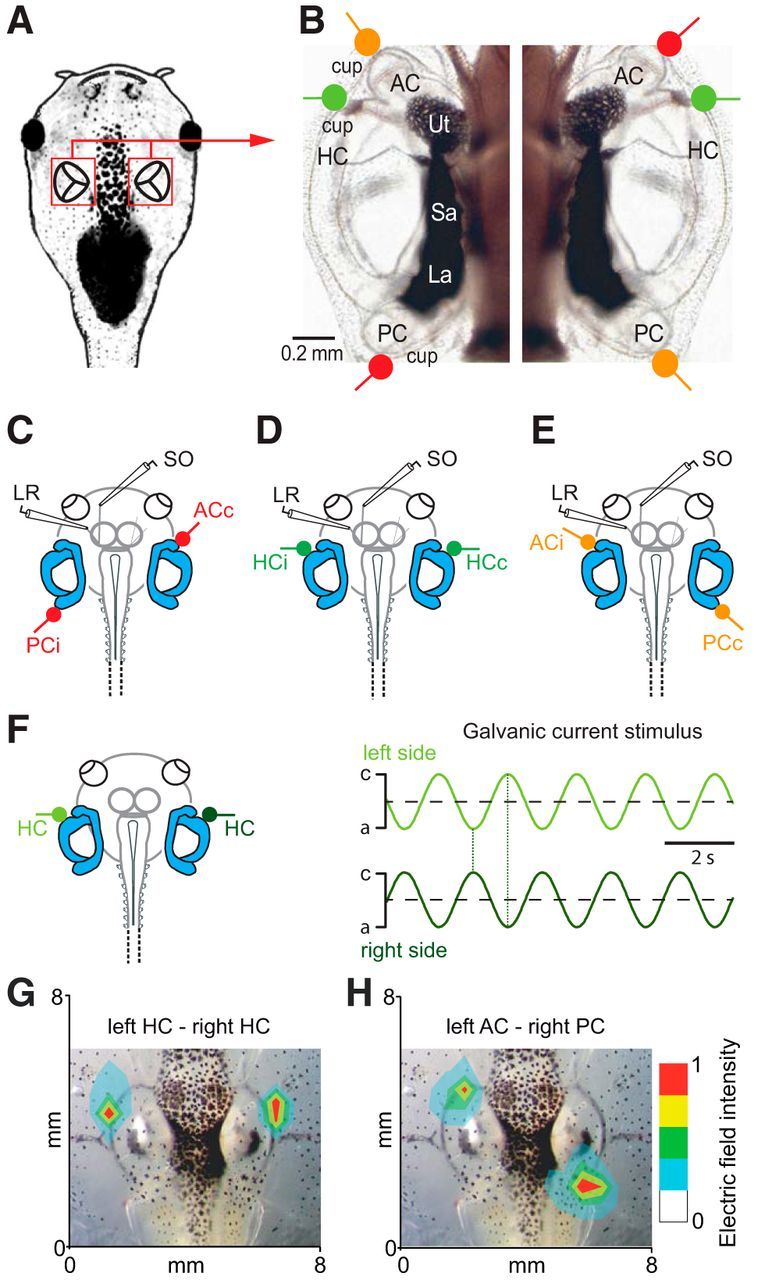
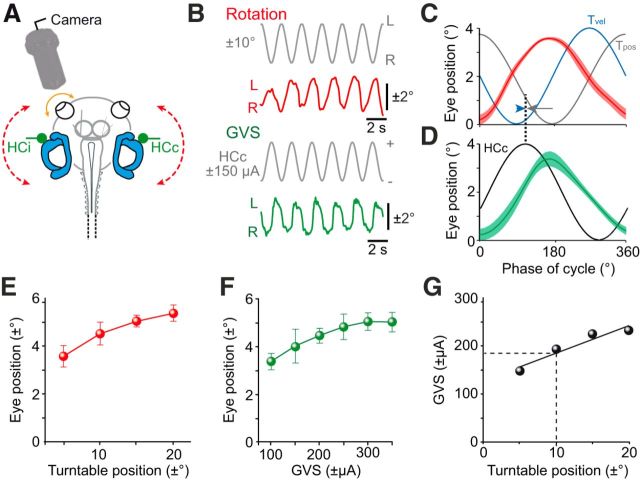
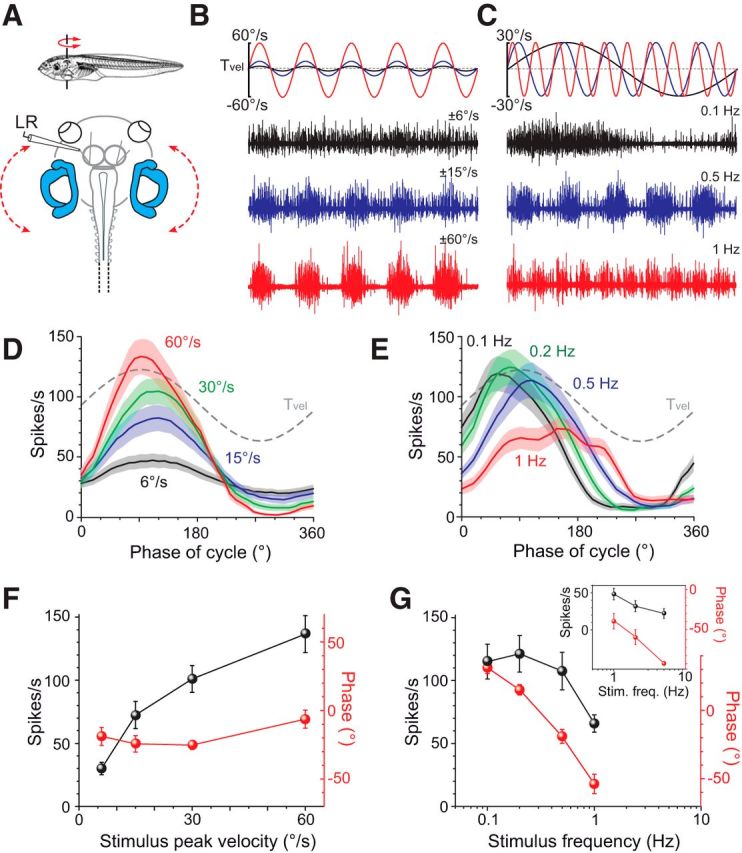
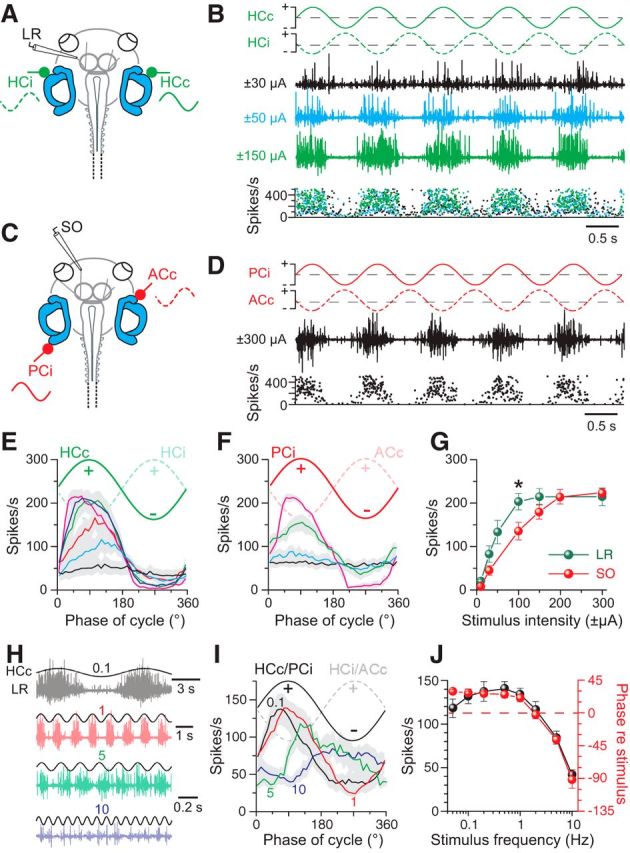
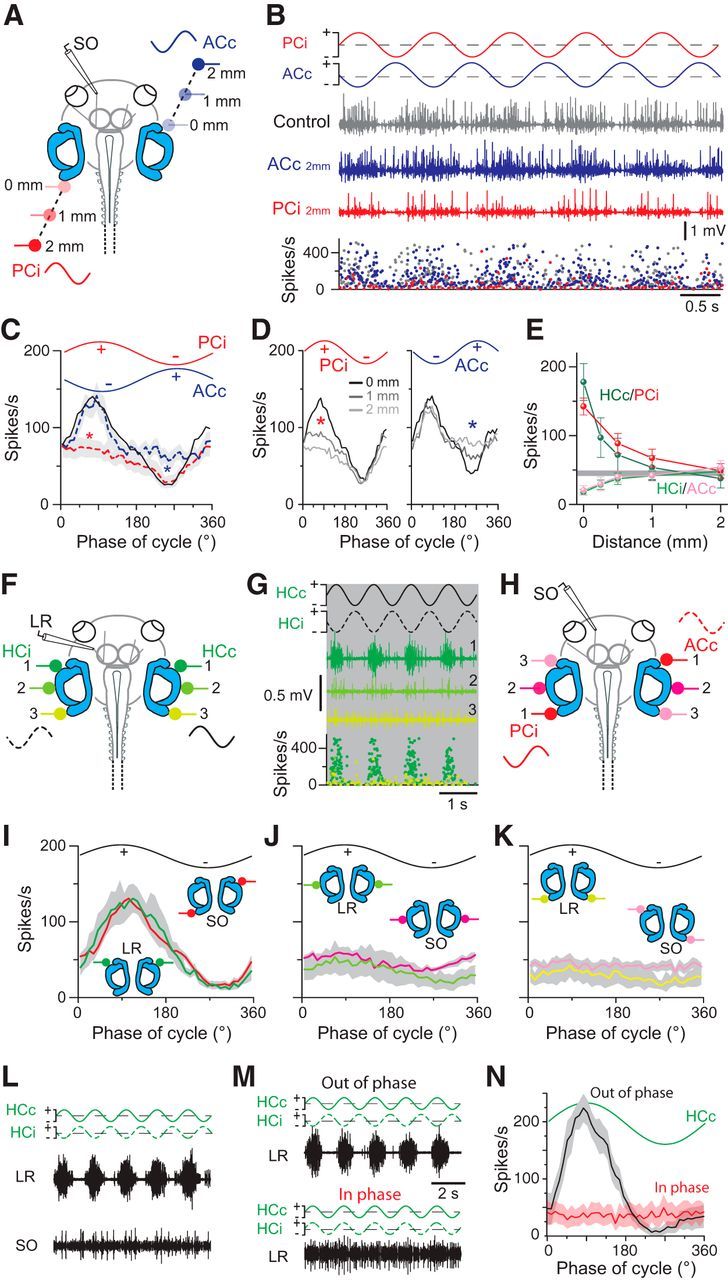
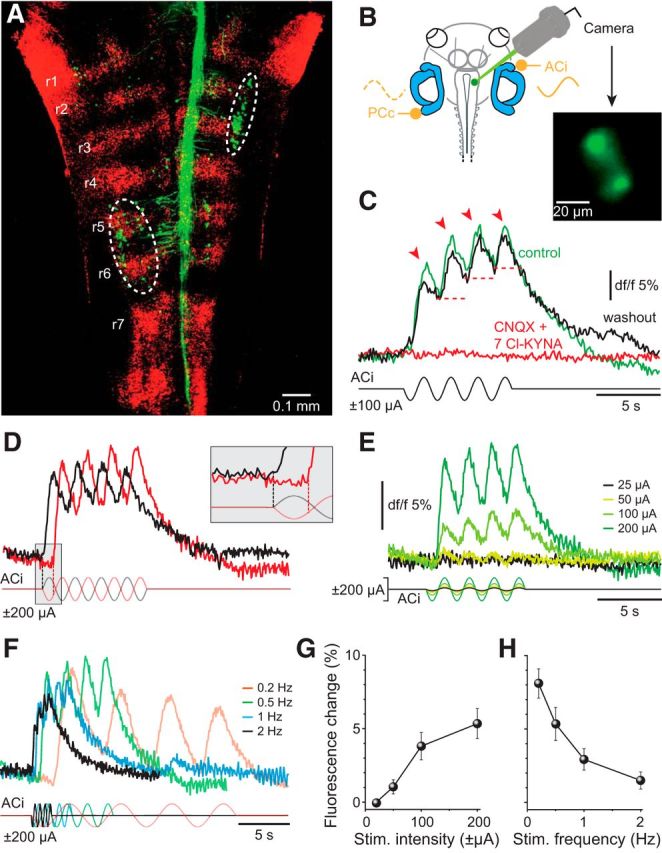
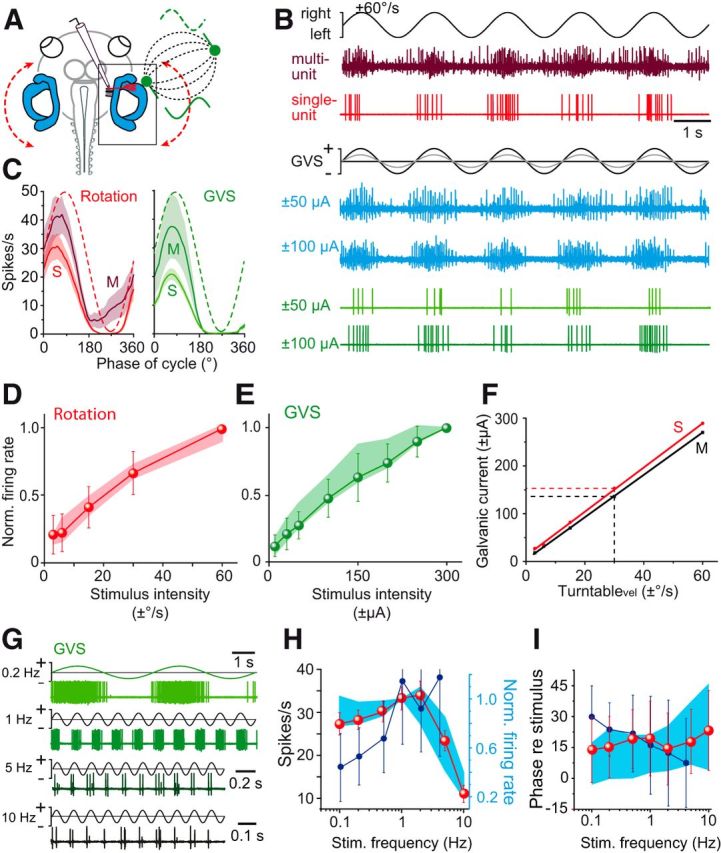
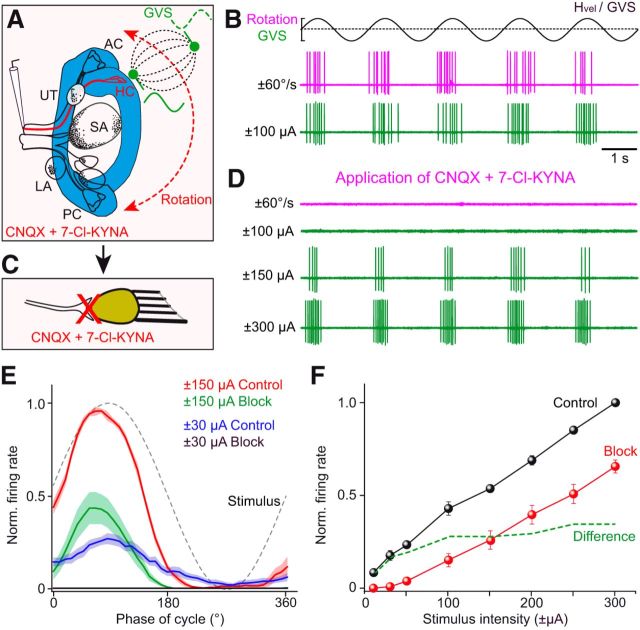
Galvanic vestibular stimulation (GVS) uses modulated currents to evoke neuronal activity in vestibular endorgans in the absence of head motion. GVS is typically used for a characterization of vestibular pathologies; for studies on the vestibular influence of gaze, posture, and locomotion; and for deciphering the sensory-motor transformation underlying these behaviors. At variance with the widespread use of this method, basic aspects such as the activated cellular substrate at the sensory periphery or the comparability to motion-induced neuronal activity patterns are still disputed. Using semi-intact preparations of Xenopus laevis tadpoles, we determined the cellular substrate and the spatiotemporal specificity of GVS-evoked responses and compared sinusoidal GVS-induced activity patterns with motion-induced responses in all neuronal elements along the vestibulo-ocular pathway. As main result, we found that, despite the pharmacological block of glutamatergic hair cell transmission by combined bath-application of NMDA (7-chloro-kynurenic acid) and AMPA (CNQX) receptor blockers, GVS-induced afferent spike activity persisted. However, the amplitude modulation was reduced by ∼30%, suggesting that both hair cells and vestibular afferent fibers are normally recruited by GVS. Systematic alterations of electrode placement with respect to bilateral semicircular canal pairs or alterations of the bipolar stimulus phase timing yielded unique activity patterns in extraocular motor nerves, compatible with a spatially and temporally specific activation of vestibulo-ocular reflexes in distinct planes. Despite the different GVS electrode placement in semi-intact X. laevis preparations and humans and the more global activation of vestibular endorgans by the latter approach, this method is suitable to imitate head/body motion in both circumstances.

Significance statement: Galvanic vestibular stimulation is used frequently in clinical practice to test the functionality of the sense of balance. The outcome of the test that relies on the activation of eye movements by electrical stimulation of vestibular organs in the inner ear helps to dissociate vestibular impairments that cause vertigo and imbalance in patients. This study uses an amphibian model to investigate at the cellular level the underlying mechanism on which this method depends. The outcome of this translational research unequivocally revealed the cellular substrate at the vestibular sensory periphery that is activated by electrical currents, as well as the spatiotemporal specificity of the evoked eye movements, thus facilitating the interpretation of clinical test results.

Keywords: Xenopus laevis; extraocular motor; galvanic stimulation; hair cells; inner ear; vestibular.


Figures

Figure 1.
Figure 1.
Anatomical substrate, electrode positions for extraocular motor nerve recordings, and application of galvanic vestibular current stimuli. A, B, Schematic of a semi-intact X. laevis preparation highlighting the location of the otic capsules (A) and photomicrograph depicting the arrangement of bilateral vestibular endorgans and the location of the semicircular canal epithelia as marker for positioning the electrodes on the outer surface of the otic capsules for bipolar electrical stimulation of the three (red, green, orange) coplanar semicircular canal pairs, exemplarily shown in a stage 50 larva (B). CE, Schematics illustrating the location of the electrodes for LR and SO motor nerve recordings, along with the three basic positions of the stimulus electrodes for activating plane-specific bilateral semicircular canal pairs. FH, Sinusoidally modulated currents with alternating phase relation of the anodal/cathodal (a,c) GVS currents (±100 μA) were applied through bilateral stimulus electrodes (F); amplitude distribution plot of the generated electric field evoked by GVS of the bilateral HCs (G) and the left AC–right PC (H) superimposed on bright-field images of the respective head region; relative amplitude magnitudes are indicated by color code. Cup, Semicircular canal cupula; i,c, ipsilateral, contralateral with respect to the recorded extraocular motor nerve; La, lagena; Sa, saccule; Ut, utricle.
Figure 2.
Figure 2.
Motion- and GVS-induced eye movements. A, Experimental setting for video recordings of eye movements (orange arrow) during horizontal turntable rotation (red dashed arrows) and GVS of the bilateral HC cupulae (green HCc and HCi electrodes). B, Representative example of horizontal positional oscillations of the left eye during head rotation (±10°; red trace) and GVS (±150 μA; green trace) at 0.5 Hz, extracted from video sequences; stimulus waveforms indicate left–right positional oscillations (top gray trace) and current oscillations of the HCc (bottom gray trace). C, D, Averaged responses (±SEM, shaded areas) over a single cycle (from 20 cycles, respectively; n = 9) during horizontal rotation (C) and GVS (D) of the bilateral HCs; stimulus in C is plotted both as position (Tpos; gray trace) and velocity (Tvel; blue trace) of the table motion and in D as current waveform of the HCc electrode; note that responses in C and D were aligned to their respective peak, illustrating that the galvanic stimulus is more closely aligned (dotted line) with Tvel (blue arrowhead) than Tpos (gray arrow). E, F, Dependency of eye position (mean ± SD) on maximal turntable excursion (E) and galvanic current intensity (F). G, Calibration of GVS with respect to turntable positional oscillations based on eye movement magnitudes; imitation of a rotation amplitude of ±10° (at 0.5 Hz) requires a GVS current of ±180 μA (dashed lines).
Figure 3.
Figure 3.
Response parameters of motion-induced extraocular motor activity. A, Multiunit recordings of the LR nerve during horizontal turntable rotation (red dashed arrow). B, C, LR nerve discharge during turntable rotation at a frequency of 0.5 Hz (B, top traces) and three peak velocities (black, blue, red trace); and a peak velocity of ±30°/s (C, top traces) and three stimulus frequencies (black, blue, red trace). D, E, Averaged firing rate modulation (±SEM, shaded areas) over a single cycle (from 10 to 50 cycles, respectively; n = 10) at 0.5 Hz and different peak velocities (color-coded traces in D) and at ±30°/s and different stimulus frequencies (color-coded traces in E); dashed lines in D and E indicate stimulus velocity. F, G, Dependency of response peak amplitude (black symbols in F, G) and phase (red symbols in F, G) of rotation-evoked cyclic LR nerve responses (±SEM; n = 10) with respect to stimulus peak velocity (F) and frequency (G). Inset in G shows data obtained in a separate set of experiments (n = 7) in which the response dynamics at stimulus frequencies between 1 and 5 Hz were explored. Scale bar in C also applies to B.
Figure 4.
Figure 4.
Frequency and intensity dependence of GVS-induced multiple-unit discharge modulation in extraocular motor nerves. A, C, Extracellular recordings of the left LR (A) and SO (C) nerves during GVS of the bilateral HC cupulae (green HCc and HCi) and the left PC (PCi) and right AC (ACc) cupulae, respectively. B, Left LR nerve discharge during 1 Hz sinusoidal GVS of the bilateral HC cupulae (traces in top row) at three current intensities (black, blue, green traces) with peak firing rates (instantaneous rate, bottom plot) that increased with GVS amplitude. D, Left SO nerve discharge (black trace) and instantaneous firing rate (bottom plot) during sinusoidal GVS of the left PC and right AC cupulae (traces in top row). E, F, Averaged LR (E, n = 8) and SO nerve responses (F, n = 8) over a single GVS cycle at 1 Hz (from 16 cycles, ±SEM, gray shaded areas) increased with stimulus amplitude (color-coded responses were evoked by increasing currents: ±10, ±30, ±50, ±100, ±150, ±300 μA in E; ±10, ±30, ±100, ±200 μA in F). G, Dependency of averaged LR and SO nerve peak firing rates on GVS intensity; significance of difference between responses of the two nerves is indicated. *p < 0.05 (Mann–Whitney U test). HJ, LR nerve discharge during sinusoidal GVS (±100 μA) of the bilateral HCs at four different stimulus frequencies (color-coded traces; H); averaged LR/SO nerve responses (from 16 cycles, ±SEM, gray shaded areas) over a single GVS cycle at 0.1, 1, 5, and 10 Hz (color-coded curves) and a stimulus intensity of ±100 μA (n = 8; I) reveal amplitude (black symbols) and phase dependency (red symbols) of the responses on stimulus frequency (J). The stimulus in H indicates polarization of the HCc; numbers in H and I indicate frequency in Hz.
Figure 5.
Figure 5.
Stimulus site dependency of GVS-induced multiunit discharge modulation in extraocular motor nerves. A, Extracellular recordings of the SO nerve during GVS of the left PC (PCi) and right AC (ACc) cupulae at different distances from the sensory epithelia (color-coded stimulus electrodes). B, Left SO nerve discharge (middle traces) and instantaneous firing rate (bottom plot) during sinusoidal GVS of the left PC and right AC cupulae (traces in top row), with both electrodes close to the respective cupula (gray trace) and after independent repositioning of the ACc (blue trace) or PCi electrode (red trace) to a distance of 2 mm from the respective cupulae. C, Averaged responses over a single GVS cycle (from 16 cycles; ±SEM, gray shaded areas; n = 6) with both stimulus electrodes close to the cupulae (black trace) and with the ACc (blue dashed trace) or PCi electrode (red dashed trace) at a distance of 2 mm from the cupula; Note the absence of either the inhibitory (blue asterisk) or the excitatory component (red asterisk) under the latter two stimulus conditions. D, Averaged responses over a single GVS cycle (from 16 cycles in n = 6 preparations) with the PCi or ACc electrode at increasing distances from the epithelium; note the gradual reduction of excitatory (red asterisk) and inhibitory components (blue asterisk), respectively. E, Dependency of HCc/PCi-evoked excitatory and HCi/ACc-evoked inhibitory response components in the LR and SO nerves on electrode position; the horizontal gray bar indicates the mean ± SEM of the LR/SO resting rates. F, H, Recordings of the LR (F) and SO nerve (H) during GVS of the HCc/HCi and the PCi/ACc cupulae and after bilateral electrode repositioning (n = 10; color-coded electrodes 1–3 in F, H). G, Left LR nerve discharge (color-coded traces) and instantaneous rate (bottom plot) during sinusoidal GVS of the HCc/HCi cupulae (traces in top row) at three stimulus electrode positions (1–3, defined in F). IK, Averaged responses of the LR and SO nerves over a single GVS cycle (from 16 cycles, ±SEM, gray shaded areas; n = 10) evoked with both electrodes close to the cupulae (HCc/HCi, PCi/ACc in I) and after bilateral repositioning of the electrodes (J, K; color-coded electrodes also in F, H). L, Simultaneous recordings of the left LR (top trace) and SO (bottom trace) nerve during 0.5 Hz sinusoidal GVS (±50 μA) of the bilateral HC cupulae. M, N, LR nerve discharge during sinusoidal GVS (0.5 Hz; ±100 μA) of the bilateral HC cupulae with sinusoids that polarized the two stimulus electrodes either in phase opposition (out of phase; top traces in M) or in phase alignment (in phase; bottom traces in M); averaged extraocular motor responses (N, n = 7) over a single GVS cycle at 0.5 Hz (from 16 cycles, ±SEM, gray and light red shaded areas) with out-of-phase (black curve) or in-phase (red curve) polarization. Scale bar in M applies also to L.
Figure 6.
Figure 6.
GVS-induced calcium dynamics in vestibulo-ocular neurons. A, Confocal reconstruction of hindbrain whole mounts after application of Alexa Fluor 488 dextran to the right oculomotor nucleus depicting retrogradely labeled vestibulo-ocular projection neurons (green) in ipsilateral r2-3 and contralateral r5-6 (white encircled areas); rhombomeres (red) were visualized with 633 nm illumination. B, Recording of Ca2+ transients in r2-3 vestibulo-ocular neurons (green neurons in inset) during GVS of the ACi and PCc; neurons were retrogradely labeled with the Ca2+-sensor (Calcium Green-1 dextran) from the ipsilateral oculomotor nucleus. C, GVS-induced Ca2+ transients before (green trace, control), during (red trace), and after 30 min of wash-out (black trace) of CNQX (15 μm) and 7-Cl-KYNA (50 μm); arrowheads indicate cyclic phase-timed fluorescence peaks; red dashed lines indicate successively elevated Ca2+ levels. DF, Ca2+ transients induced by GVS with opposite stimulus polarities (red and black stimulus traces, D), increasing current stimulus amplitudes (color-coded traces, E) and increasing stimulus frequency (color-coded traces, F). Inset in D illustrates a half-cycle shift in response onset with inversion of the stimulus polarity. G, H, Dependency of fluorescence peak amplitude (G) and cyclic fluorescence oscillations (H) on stimulus intensity and frequency, respectively. Fluorescence calibration (dF/F) in E also applies to D and F.
Figure 7.
Figure 7.
Dynamics of rotation- and GVS-evoked HC afferent neuronal discharge. A, Extracellular recordings of afferent fibers in the anterior branch of the right VIIIth nerve during horizontal rotation (red dashed curve) and GVS of the right HC cupula (green electrode); note the electric field (black dashed field lines) between the HC and a second electrode in the bath solution (green electrode). B, Multiunit discharge (dark red trace; blue traces) and HC single-unit discharge (light red trace; green traces) during horizontal sinusoidal turntable rotation (0.5 Hz; top traces) and GVS of the HC at two current intensities (bottom traces). C, Averaged multiunit (M; n = 8) and single-unit (S; n = 39) responses over a single rotation and GVS cycle, respectively (from 16 cycles, ±SEM, shaded areas); red and green dashed sinusoids indicate the current stimulus. D, E, Dependency of the normalized multiunit (colored areas, ±SD in D, E; n = 8) and HC/AC single-unit (colored symbols in D, E; n = 34 HC, n = 5 AC afferent fibers) firing rates on rotation (D) and GVS stimulus intensities (E). F, Calibration of the GVS with respect to turntable peak velocity based on corresponding multiunit (M, black line) and single-unit (S, red line) firing rates; imitation of 30°/s turntable peak velocity (at 0.5 Hz) requires GVS currents of ±140 μA and ±155 μA, respectively (dashed lines). G, HC single-unit discharge during sinusoidal GVS (±100 μA) of the HC at 4 stimulus frequencies (n = 5). H, I, Average amplitude (H) and phase (I) of multiunit responses during sinusoidal GVS (blue areas, ±SD in H, I; n = 8) and of HC single-unit responses during sinusoidal GVS (red symbols in H, I; n = 20) and sinusoidal rotation (dark blue symbols in H, I; n = 26) at different stimulus frequencies; note that multiunit firing rates were normalized in H. Scale bar in B applies to all traces; calibration bar in G for 0.2 Hz applies also to 1 Hz.
Figure 8.
Figure 8.
Determination of the cellular substrate underlying GVS-induced spike discharge in vestibular nerve afferents. A, Single-unit recordings of HC afferents during horizontal turntable rotation (red dashed arrow) and GVS of the HC cupula (green stimulus electrode); note that the GVS electric field (dashed field lines) expands between the HC electrode and a distant one in the Ringer's solution. BD, Single HC afferent fiber discharge during horizontal rotation (magenta traces in B, D) and GVS of the HC cupula (green traces in B, D) before (B) and during (D) bath application of CNQX (15 μm) and 7-Cl-KYNA (50 μm) that blocked the synaptic transmission between hair cells and vestibular afferent fibers pharmacologically (C). E, F, Averaged single-unit afferent discharge over one cycle of GVS (from 16 cycles, ±SEM, shaded areas; n = 13) at two stimulus intensities (±30 μA, ±150 μA; E) and dependency of GVS-induced peak afferent firing rate on stimulus intensity (F) before (control, black symbols) and during pharmacological block of the glutamatergic hair cell–afferent synapse (red symbols); green dashed line in F depicts the arithmetic difference between the two conditions, indicating the magnitude of hair cell contribution to the GVS-induced afferent discharge. Scale bar in B applies to all traces in B and D.

References

    1. Angelaki DE, Perachio AA. Contribution of irregular semicircular canal afferents to the horizontal vestibuloocular response during constant velocity rotation. J Neurophysiol. 1993;69:996–999. - PubMed
    1. Aw ST, Todd MJ, Aw GE, Weber KP, Halmagyi GM. Gentamicin vestibulotoxicity impairs human electrically evoked vestibulo-ocular reflex. Neurology. 2008;71:1776–1782. doi: 10.1212/01.wnl.0000335971.43443.d9. - DOI - PubMed
    1. Aw ST, Aw GE, Todd MJ, Halmagyi GM. Enhanced vestibulo-ocular reflex to electrical vestibular stimulation in Meniere's disease. J Assoc Res Otolaryngol. 2013;14:49–59. doi: 10.1007/s10162-012-0362-z. - DOI - PMC - PubMed
    1. Beck JC, Gilland E, Baker R, Tank DW. Instrumentation for measuring oculomotor performance and plasticity in larval organisms. Methods Cell Biol. 2004;76:385–413. doi: 10.1016/S0091-679X(04)76017-3. - DOI - PubMed
    1. Biesdorf S, Malinvaud D, Reichenberger I, Pfanzelt S, Straka H. Differential inhibitory control of semicircular canal nerve afferent-evoked inputs in second-order vestibular neurons by glycinergic and GABAergic circuits. J Neurophysiol. 2008;99:1758–1769. doi: 10.1152/jn.01207.2007. - DOI - PubMed

Publication types

MeSH terms