

Inferring R0 in emerging epidemics-the effect of common population structure is small
- PMID: 27581480
- PMCID: PMC5014060
- DOI: 10.1098/rsif.2016.0288
Inferring R0 in emerging epidemics-the effect of common population structure is small
Abstract
When controlling an emerging outbreak of an infectious disease, it is essential to know the key epidemiological parameters, such as the basic reproduction number R0 and the control effort required to prevent a large outbreak. These parameters are estimated from the observed incidence of new cases and information about the infectious contact structures of the population in which the disease spreads. However, the relevant infectious contact structures for new, emerging infections are often unknown or hard to obtain. Here, we show that, for many common true underlying heterogeneous contact structures, the simplification to neglect such structures and instead assume that all contacts are made homogeneously in the whole population results in conservative estimates for R0 and the required control effort. This means that robust control policies can be planned during the early stages of an outbreak, using such conservative estimates of the required control effort.
Keywords: R0; emerging epidemics; infectious disease modelling; population structure; real-time spread.
© 2016 The Authors.
Figures


 for
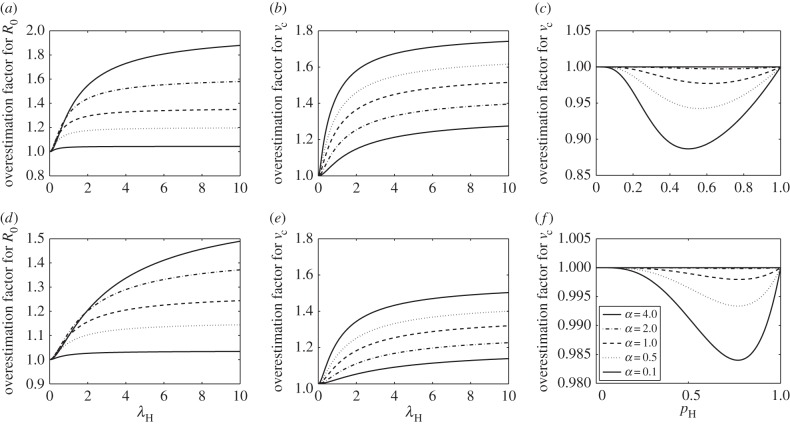
for  mi is the fraction of the households with size i. For (d–f), the Swedish household size distribution in 2013 taken from [30] is used and is given by


 . The global infectivity is chosen, so that the epidemic growth rate α is kept constant while the within-household transmission varies. Homogeneous mixing corresponds to
  , in which case
  . Note that the order of the graphs is different in (b) and (e) from that in (a,c,d,f).
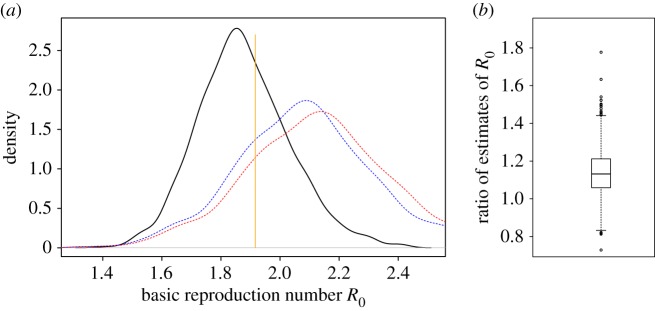
 . In (a), the black solid line provides the density of estimates based on full observation of who infected whom, the blue dashed line denotes the density of estimates based on the estimated epidemic growth rate α and the assumption that the network is a configuration model with known κ, whereas the red dotted line denotes the density of estimates based on α and the homogeneous mixing assumption. (The modes of these three densities are in increasing order.) The orange vertical line segment denotes the estimate of R0 based only on the infection parameters and κ, assuming that the network is a configuration model (see equation (2.12) in the electronic supplementary material). We excluded the 50 simulations with highest estimated α and the 50 simulations with lowest estimated α. In (b), a box plot of the ratios of the two R0 estimates (the estimate based on the homogeneous mixing assumption divided by the estimate based on the real infection process for each of the 250 simulation runs) is provided. (Online version in colour.)
References
MeSH terms
LinkOut - more resources
Full Text Sources
Other Literature Sources