. 2016 Sep 1:7:12649.
doi: 10.1038/ncomms12649.

Proteome-wide association studies identify biochemical modules associated with a wing-size phenotype in Drosophila melanogaster

Affiliations

Proteome-wide association studies identify biochemical modules associated with a wing-size phenotype in Drosophila melanogaster

Hirokazu Okada et al. Nat Commun. .

Abstract

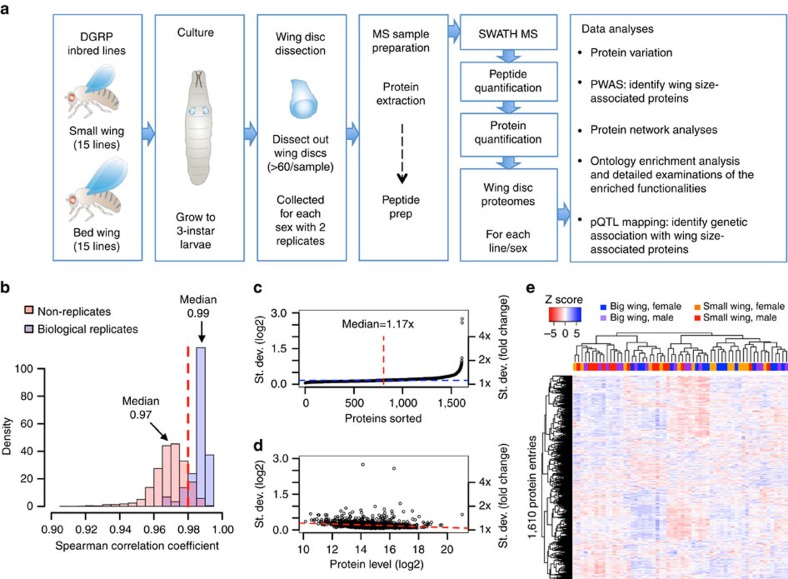
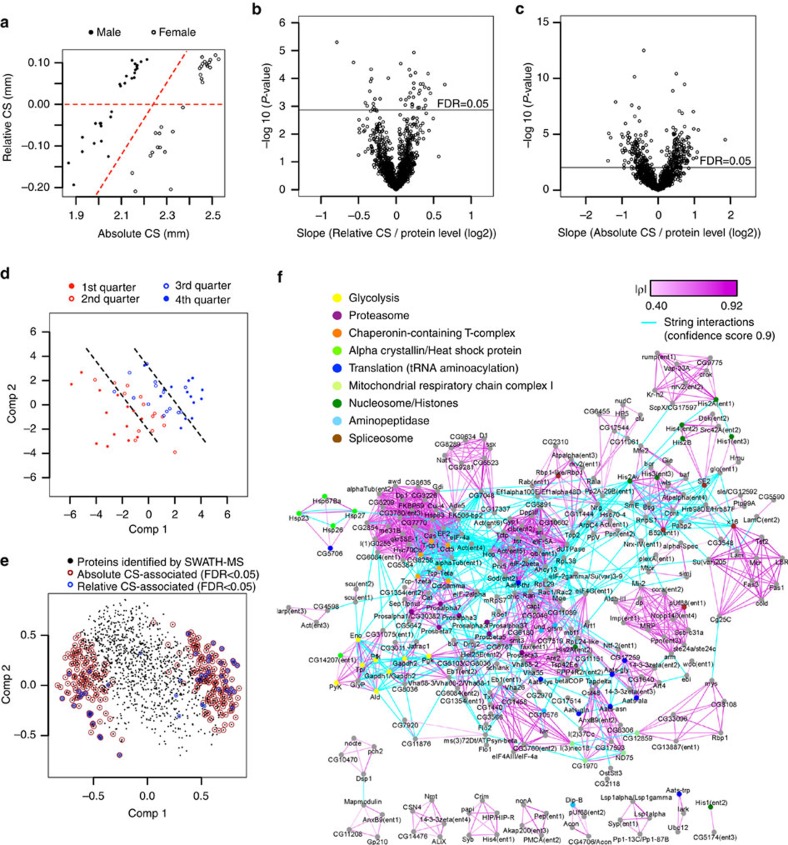
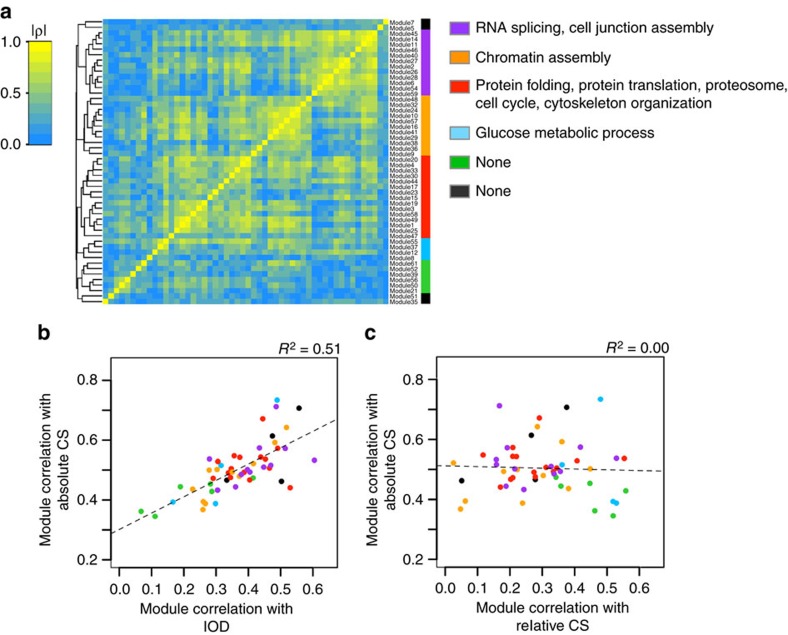
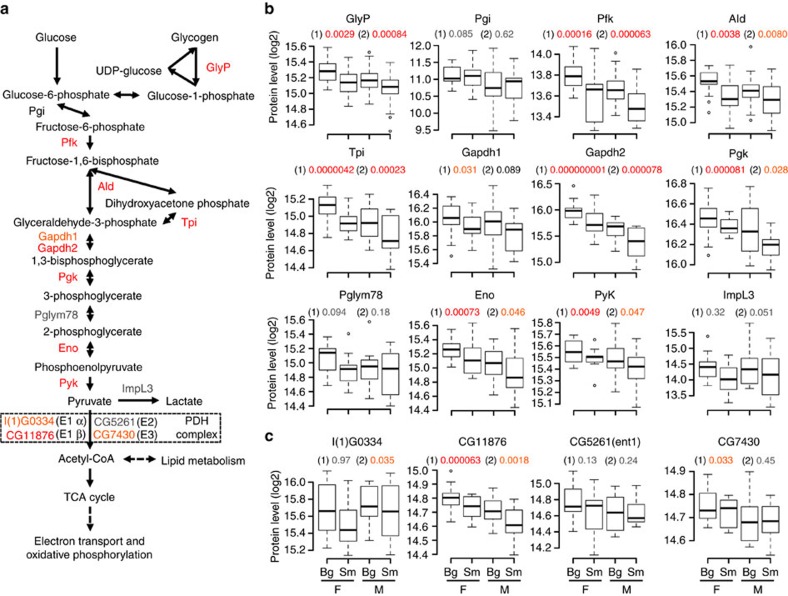
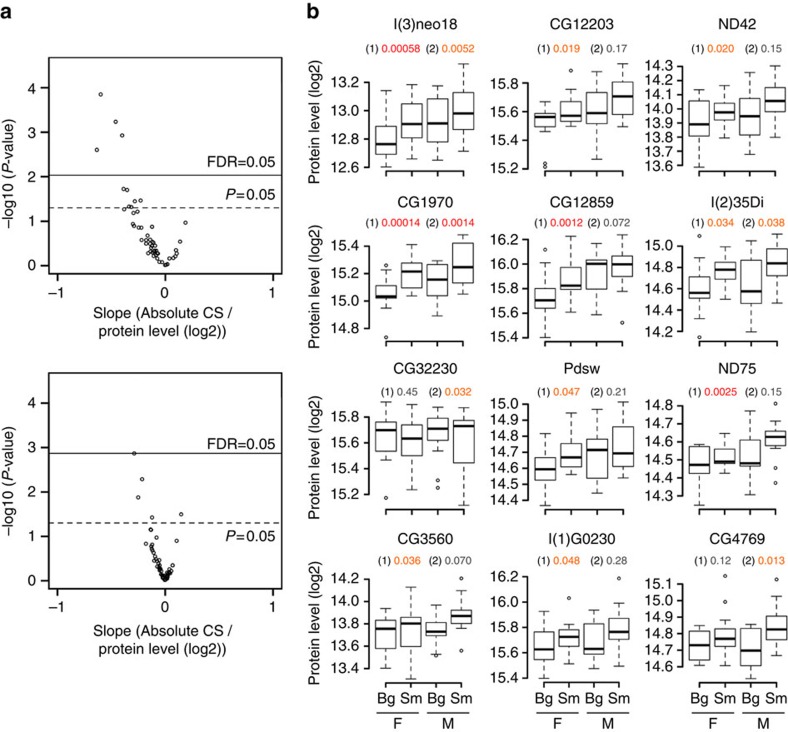
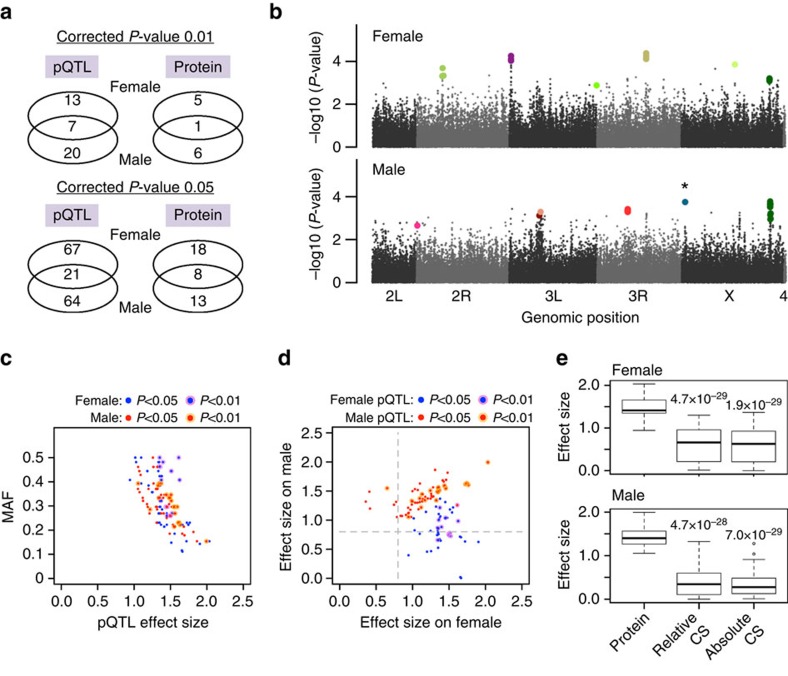
The manner by which genetic diversity within a population generates individual phenotypes is a fundamental question of biology. To advance the understanding of the genotype-phenotype relationships towards the level of biochemical processes, we perform a proteome-wide association study (PWAS) of a complex quantitative phenotype. We quantify the variation of wing imaginal disc proteomes in Drosophila genetic reference panel (DGRP) lines using SWATH mass spectrometry. In spite of the very large genetic variation (1/36 bp) between the lines, proteome variability is surprisingly small, indicating strong molecular resilience of protein expression patterns. Proteins associated with adult wing size form tight co-variation clusters that are enriched in fundamental biochemical processes. Wing size correlates with some basic metabolic functions, positively with glucose metabolism but negatively with mitochondrial respiration and not with ribosome biogenesis. Our study highlights the power of PWAS to filter functional variants from the large genetic variability in natural populations.


Figures

Figure 1
Figure 1. Experimental scheme and variation of wing disc proteins.
(a) Flow of the experiments. Wing discs from wing-size-extreme Drosophila inbred lines were dissected and collected. SWATH-MS quantified wing disc proteomes for each line/sex, which were analysed to identify/characterize wing-size-associated proteins. (b) Reproducibility of the experiment. Pairwise Spearman's rank correlation coefficients between peptide levels showed higher correlations among biological replicates than among non-replicates. (c) Variation of protein levels; s.d. is plotted in an increasing manner. (d) Relationship between protein variation and protein abundance. Less abundant proteins show larger variations. (e) Cluster analysis of the proteome data matrix. Proteins (1,610 entries) and samples (30 lines × 2 sexes) are hierarchically clustered based on Spearman's correlations.
Figure 2
Figure 2. Protein network of wing-size-associated proteins.
(a) CS of wings at adult age. Absolute CS and relative CS (adjusted for body size) were used as explanatory variables in PWAS. (b,c) Association of proteins with relative and absolute CSs, respectively. P-values are plotted against the slope of the fitted line. The horizontal line indicates 5% FDR threshold. (d) Score plot against the first two PLS components. Samples sorted by wing size into four groups are aligned along the components in an increasing manner. (e) Correlation loadings plot. Correlation between proteins and the PLS components are plotted. The wing-size-associated proteins are marked as indicated. (f) Protein network and functionality of the wing-size-associated proteins. Protein covariation modules were identified based on absolute Spearman's correlation (|ρ|>0.4, equivalent to P-value <0.001). Strength of connection is indicated by the tone of purple colour. Protein interactions (cyan edges) based on STRING database at the highest confidence (Score=0.9) were combined to construct a large wing-size-associated protein network. Enriched functionalities identified by David are indicated by node colours as indicated.
Figure 3
Figure 3. Protein module connectivity and correlation with size traits.
(a) Higher-order clustering of protein modules. The modules were hierarchically clustered based on Spearman correlation (|ρ|) between the principal components of the individual modules. Functionalities enriched for the higher-order module clusters are shown. The significance for the enrichment was determined (<0.05) by Benjamin–Hochberg method. (b) Relationship between module correlations with absolute CS and IOD. Spearman's correlation between the principal components of the modules and size traits are plotted. The fitted line and the r2 from linear regression are shown. (c) Relationship between module correlations with absolute and relative CSs.
Figure 4
Figure 4. Systemic association of glucose metabolism with wing size.
(a) Pathway map for glucose metabolism. Proteins detected by SWATH-MS are shown. Proteins in red indicates association with either of absolute or relative CS at 5% FDR. Proteins in orange indicates association at nominal P-value <0.05. (b) Glycolytic protein levels plotted against wing size for each sex. P-values are shown for association with absolute CS (1) and relative CS (2). Significance levels of association are indicated by colour of P-values as in a. Bg, big wing samples; F, female; M, male; Sm, small wing samples. (c) Subunit proteins from pyruvate dehydrogenase (PDH) complex are plotted against wing size for each sex.
Figure 5
Figure 5. System-level negative association of mitochondrial respiration with wing size.
(a) Negatively biased slope distribution of mitochondrial respiratory chain complex proteins. The P-values obtained in PWAS for absolute and relative CSs are plotted against slopes fitted in the model. The horizontal lines indicate significance thresholds as indicated. (b) Levels of mitochondrial respiratory chain complex proteins associated with wing size are plotted against wing size for each sex. P-values are shown for association with absolute CS (1) and relative CS (2). Significance levels of association are indicated by colour of P-values as in Fig. 4b. Bg, big wing samples; F, female; M, male; Sm, small wing samples.
Figure 6
Figure 6. Genetic association of wing-size-associated proteins.
(a) cis-pQTL mapping for the wing-size-associated proteins. The numbers of pQTLs and protein entries identified for each sex at different significance thresholds are depicted using Venn diagrams. (b) Manhattan plots. P-values for protein/cis-SNP association tests are plotted with black dots along the genetic coordinates. pQTLs at a corrected P-value threshold of 0.01 are shown as coloured dots, which cis-associate to 6 (7) protein entries in female (male). *A pQTL shared by two protein entries. (c) Distribution of effect size and minor allele frequency (MAF) for pQTLs. Effect size is measured by the standardized difference in the two means between genotypes. The sex and significance threshold of pQTLs are indicated. (d) Effect size of pQTLs on the protein of the opposite sex is plotted. The dashed lines indicate effect size at 0.8. Values >0.8 are classified as large by Cohen's criteria. (e) Comparison of effect sizes between on protein and on wing size. The statistical significance was evaluated using Wilcoxon rank-sum test.

References

    1. Oldham S., Bohni R., Stocker H., Brogiolo W. & Hafen E. Genetic control of size in Drosophila. Philos. Trans. R. Soc. Lond. B Biol. Sci. 355, 945–952 (2000). - PMC - PubMed
    1. Tumaneng K., Russell R. C. & Guan K. L. Organ size control by Hippo and TOR pathways. Curr. Biol. 22, R368–R379 (2012). - PMC - PubMed
    1. Lander A. D. Pattern, growth, and control. Cell 144, 955–969 (2011). - PMC - PubMed
    1. Laplante M. & Sabatini D. M. mTOR signaling in growth control and disease. Cell 149, 274–293 (2012). - PMC - PubMed
    1. Edgar B. A. How flies get their size: genetics meets physiology. Nat. Rev. Genet. 7, 907–916 (2006). - PubMed

Publication types

MeSH terms

LinkOut - more resources