. 2016 Nov 1;311(5):F1025-F1034.
doi: 10.1152/ajprenal.00362.2016. Epub 2016 Aug 31.

Nrf2-AKT interactions regulate heme oxygenase 1 expression in kidney epithelia during hypoxia and hypoxia-reoxygenation

Affiliations

Nrf2-AKT interactions regulate heme oxygenase 1 expression in kidney epithelia during hypoxia and hypoxia-reoxygenation

Haranatha R Potteti et al. Am J Physiol Renal Physiol. .

Abstract

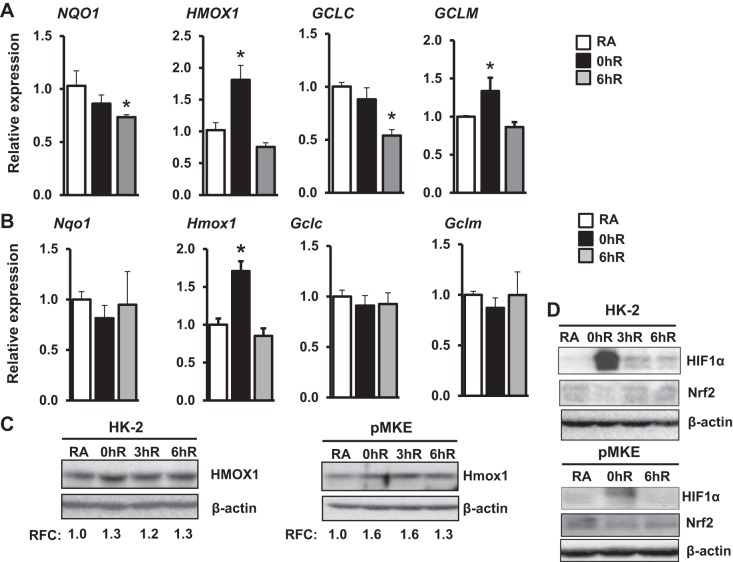
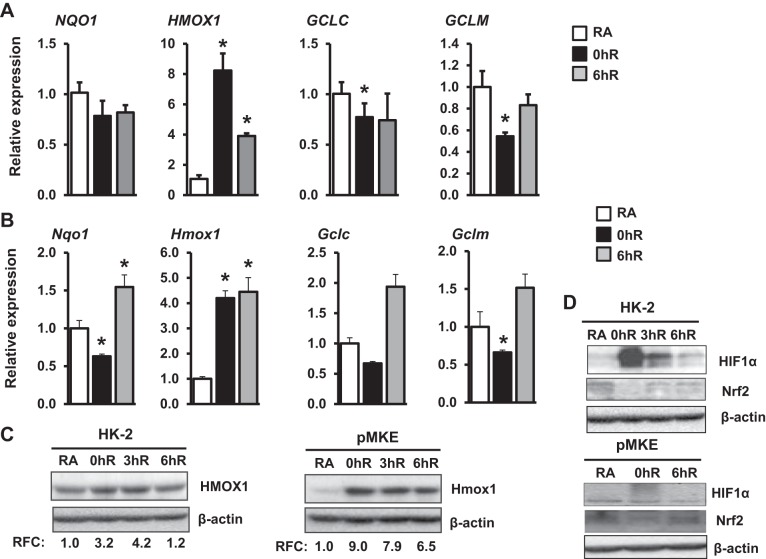
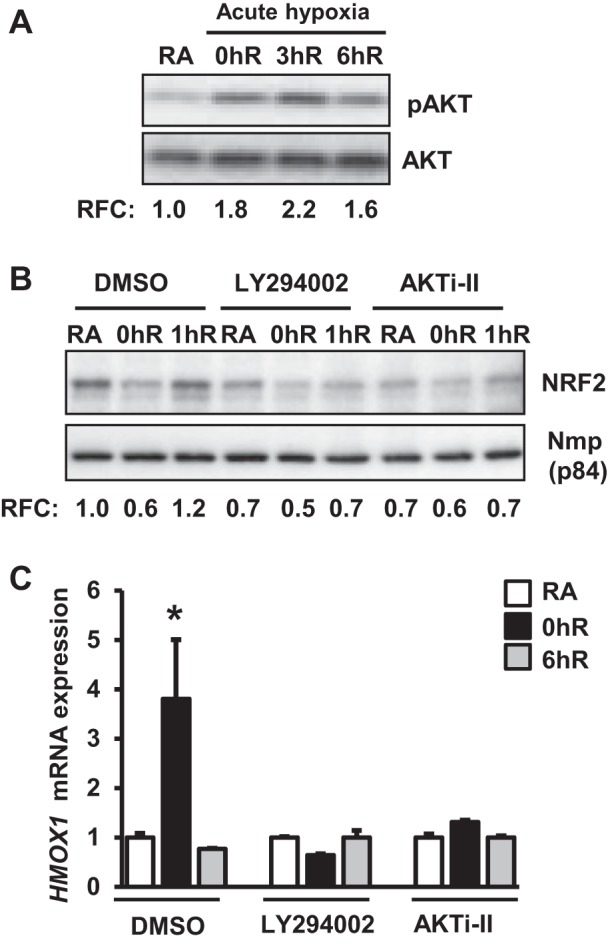
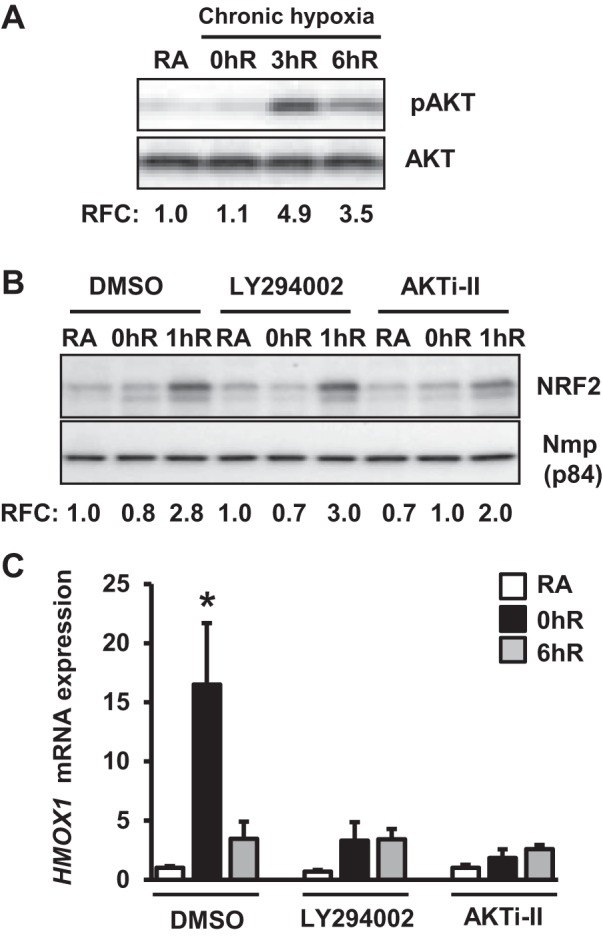
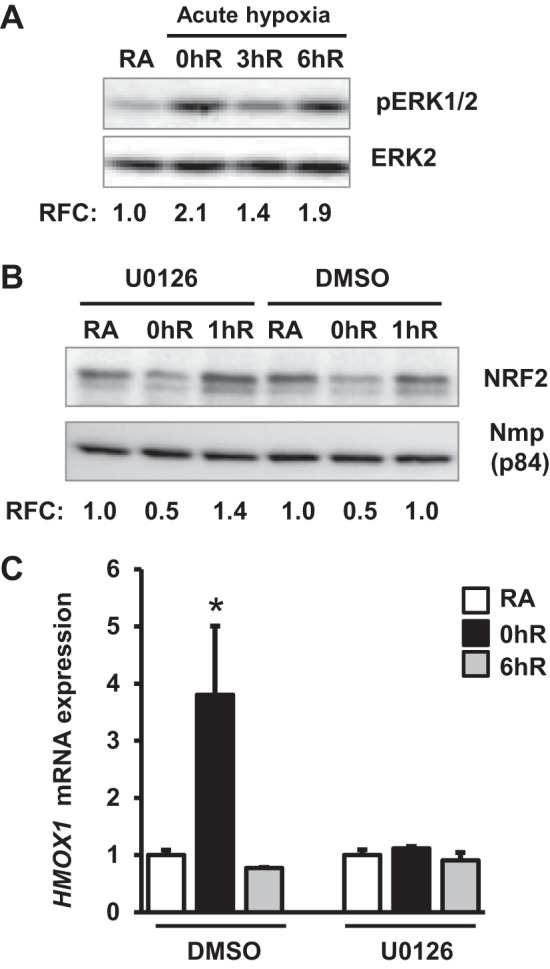
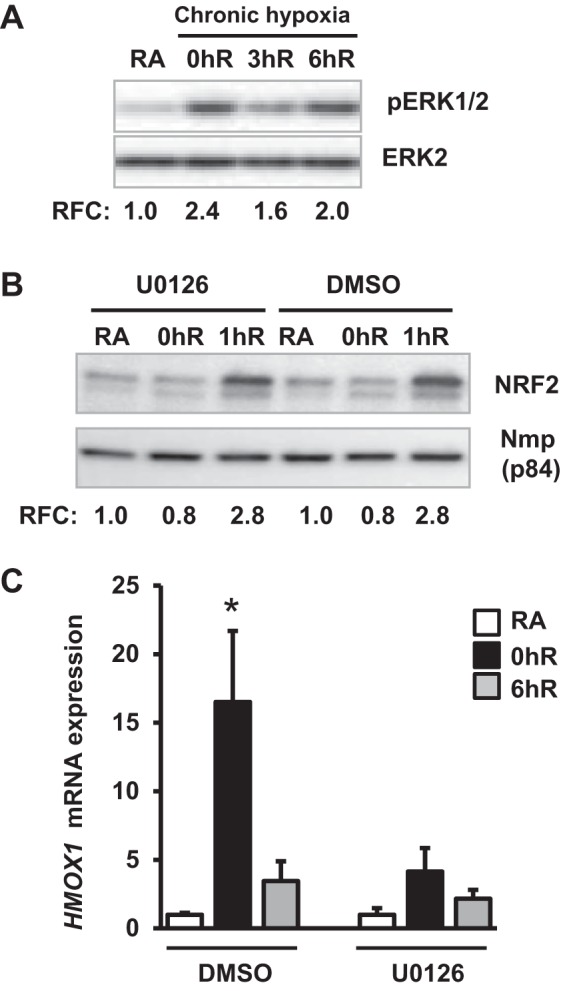
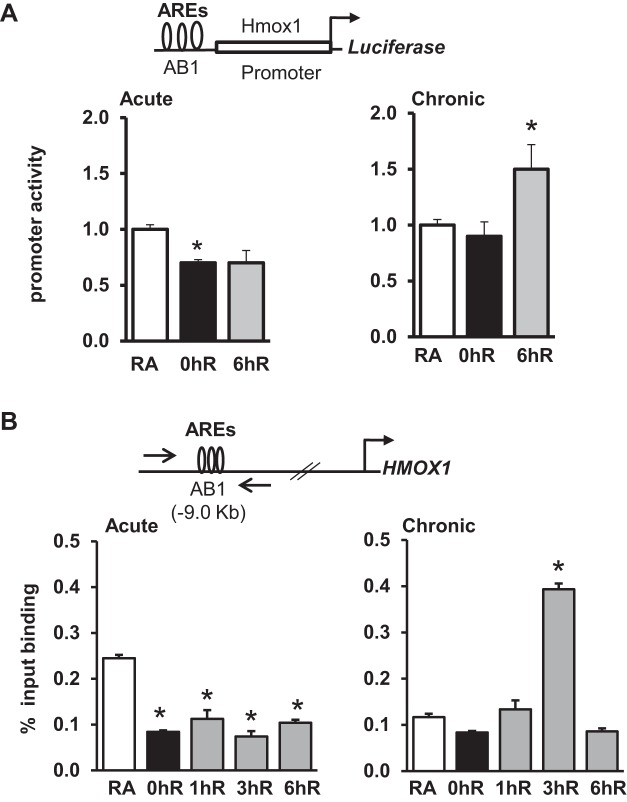
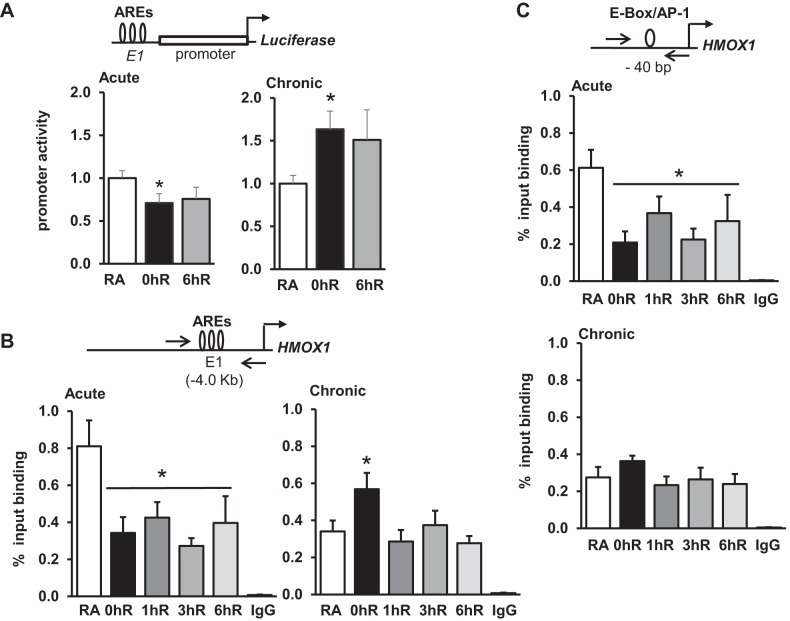
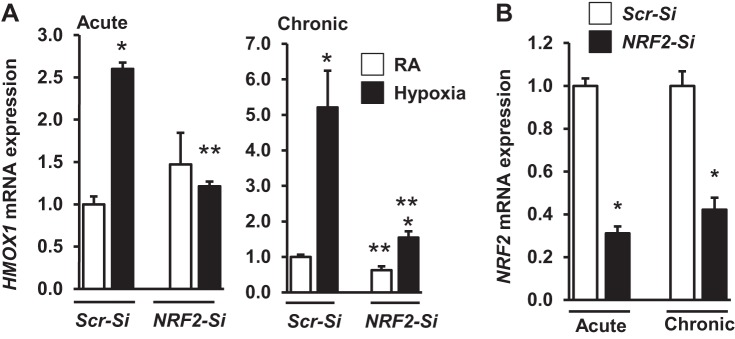
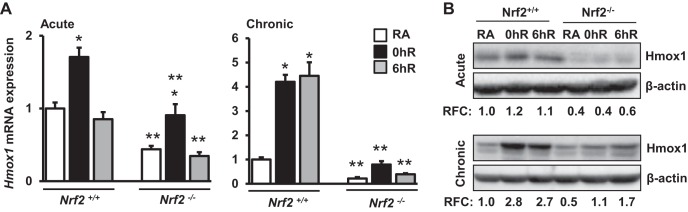
Ischemia-reperfusion (IR)-induced kidney injury is a major clinical problem, but its underlying mechanisms remain unclear. The transcription factor known as nuclear factor, erythroid 2-like 2 (NFE2L2 or Nrf2) is crucial for protection against oxidative stress generated by pro-oxidant insults. We have previously shown that Nrf2 deficiency enhances susceptibility to IR-induced kidney injury in mice and that its upregulation is protective. Here, we examined Nrf2 target antioxidant gene expression and the mechanisms of its activation in both human and murine kidney epithelia following acute (2 h) and chronic (12 h) hypoxia and reoxygenation conditions. We found that acute hypoxia modestly stimulates and chronic hypoxia strongly stimulates Nrf2 putative target HMOX1 expression, but not that of other antioxidant genes. Inhibition of AKT1/2 or ERK1/2 signaling blocked this induction; AKT1/2 but not ERK1/2 inhibition affected Nrf2 levels in basal and acute hypoxia-reoxygenation states. Unexpectedly, chromatin immunoprecipitation assays revealed reduced levels of Nrf2 binding at the distal AB1 and SX2 enhancers and proximal promoter of HMOX1 in acute hypoxia, accompanied by diminished levels of nuclear Nrf2. In contrast, Nrf2 binding at the AB1 and SX2 enhancers significantly but differentially increased during chronic hypoxia and reoxygenation, with reaccumulation of nuclear Nrf2 levels. Small interfering-RNA-mediated Nrf2 depletion attenuated acute and chronic hypoxia-inducible HMOX1 expression, and primary Nrf2-null kidney epithelia showed reduced levels of HMOX1 induction in response to both acute and chronic hypoxia. Collectively, our data demonstrate that Nrf2 upregulates HMOX1 expression in kidney epithelia through a distinct mechanism during acute and chronic hypoxia reoxygenation, and that both AKT1/2 and ERK1/2 signaling are required for this process.

Keywords: AKT1/2; ERK1/2; NRF2; acute kidney injury; antioxidant genes; ischemia-reperfusion.


Figures

Fig. 1.
Fig. 1.
Effects of acute hypoxia on Nrf2-regulated antioxidant gene expression in kidney epithelia. HK-2 (A) and primary murine kidney epithelial (pMKE) (B) cells were exposed to room air (RA), 1% hypoxia for 2 h (0hR), or hypoxia-reoxygenation for 6 h (6hR). RNA was isolated and Nrf2 target gene expression was analyzed by quantitative RT-PCR (qRT-PCR). Data are presented as means ± SE (n = 3–4). *RA vs. hypoxia or hypoxia-reoxygenation. C: immunoblot analysis of HMOX1 levels in HK-2 (left) and pMKE (right) cells exposed to hypoxia and hypoxia-reoxygenation. The band intensity was quantitated using β-actin as a reference, and the value of RA controls was considered as one unit. Relative fold change (RFC) shown is from a representative blot of three independent samples (n = 3). D: immunoblot analysis of hypoxia-inducible factor 1α (HIF1α) and Nrf2 expression in HK-2 and pMKE cells exposed to hypoxia and hypoxia-reoxygenation. A representative blot of two independent experiments is shown.
Fig. 2.
Fig. 2.
Effects of chronic hypoxia on Nrf2-regulated antioxidant gene expression in kidney epithelia. HK-2 (A) and pMKE (B) cells were exposed to RA, 1% hypoxia for 12 h (0hR), or hypoxia-reoxygenation for 6 h (6hR), RNA was then isolated and subjected to qRT-PCR. Data are presented as means ± SE (n = 3–4). *RA vs. hypoxia or hypoxia-reoxygenation. C: immunoblot analysis of HMOX1 expression in HK-2 (left) and pMKE (right) cells exposed to hypoxia and reoxygenation. The band intensity was quantitated using β-actin and shown from a representative blot (n = 3). D: HIF1α and Nrf2 expression was analyzed by Western blot analysis in HK-2 and pMKE cells exposed to chronic hypoxia and hypoxia-reoxygenation. A representative blot of two independent experiments is shown.
Fig. 3.
Fig. 3.
AKT1/2 signaling regulates Nrf2 levels and acute hypoxia-inducible HMOX1 expression. A: HK-2 cells were exposed to hypoxia (0hR) and then reoxygenated for 3 h (3hR) or 6 h (6hR), lysed, and immunoblotted with the phospho-specific AKT (pAKT) or total AKT antibodies. pAKT levels were quantified and expressed relative to RA controls. pAKT levels were quantitated using total AKT as reference and values from a representative blot are shown (n = 3). B: cells pretreated with DMSO, LY294002 (10 μM), or AKTi-II (an AKT1/2-specific inhibitor, 10 μM) for 60 min were exposed to hypoxia and hypoxia-reoxygenation for 1 h (1hR). Nuclear extracts (∼15 g) were separated on an SDS-PAGE membrane, and probed with Nrf2 or Nmp-p84 antibodies. Nrf2 band intensity was quantified using Nmp-p84 as a reference and expressed to relative to RA controls. Values shown are from a representative blot (n = 3). C: cells were pretreated with DMSO or AKTi-II and then exposed to RA, 1% hypoxia for 2 h (0hR), or hypoxia-reoxygenation for 6 h (6hR). HMOX1 mRNA expression was analyzed by qRT-PCR. Data are presented as means ± SE (n = 3). *RA vs. hypoxia or hypoxia-reoxygenation.
Fig. 4.
Fig. 4.
AKT1/2 signaling regulates chronic hypoxia-inducible HMOX1 expression but does not affect Nrf2 levels. A: HK-2 cells were exposed to chronic hypoxia and then reoxygenated for 3 h (3hR) or 6 h (6hR), and pAKT/AKT levels were analyzed as in Fig. 3A. Band intensities shown are from a representative blot (n = 3). B: cells were treated with DMSO, 10 μM LY 294002, or 10 μM AKTi-II for 60 min and then exposed to RA, 1% hypoxia for 12 h (0hR), or hypoxia-reoxygenation for 1 h (1hR). Nuclear extracts were isolated and immunoblotted with anti-Nrf2 or Nmp-p84 antibodies, and Nrf2 levels were quantified as descried above. Band intensity values shown are from a representative blot (n = 3). C: HMOX1 mRNA expression in cells exposed to RA, chronic hypoxia, or hypoxia-reoxygenation in the presence and absence of AKTi-II. Data are presented as means ± SE (n = 2–3). *RA vs. hypoxia or hypoxia-reoxygenation.
Fig. 5.
Fig. 5.
ERK1/2 signaling regulates acute hypoxia-inducible HMOX1 expression without affecting Nrf2 levels. HK-2 cells were exposed to hypoxia (0hR) and then reoxygenated for 3 h (3hR) or 6 h (6hR), lysed, and immunoblotted with pERK1/2 and ERK2 antibodies. pERK1/2 levels were quantitated using total ERK2 as reference, and values from a representative blot are shown (n = 3). ERK1/2 activation was analyzed as described in Fig. 3A. B: cells were treated with DMSO or 10 μM U0126 (an ERK/1/2 inhibitor) for 60 min and exposed to RA, hypoxia for 2 h (0hR), and hypoxia-reoxygenation for 1 h (1hR). Nuclear extracts were isolated and immunoblotted with Nrf2 or Nmp-p84 antibodies. Values from a representative blot are shown (n = 3). C: HMOX1 mRNA expression in cells exposed to RA, hypoxia (0hR), or allowed to recover at room air for 1 h (6hR) in the presence of DMSO or U0126. Data are presented as means ± SE (n = 2–3). *RA vs. exposure.
Fig. 6.
Fig. 6.
Effects of ERK1/2 inhibition on chronic hypoxia-inducible HMOX1 expression. HK-2 cells were exposed to chronic hypoxia and reoxygenation conditions in the presence and absence of U0126 (10 μM). Levels of ERK1/2 phosphorylation (A, n = 3), nuclear Nrf2 (B, n = 3), and HMOX1 gene expression (C, n = 3–4) were analyzed as described in Fig. 5.
Fig. 7.
Fig. 7.
HMOX1 promoter activity and Nrf2 binding to the antioxidant response elements (AREs) in HK-2 cells exposed to hypoxia and hypoxia-reoxygenation. A: HMOX1 promoter reporter construct (100 ng) with pRL-TK plasmid (5 ng) were transfected into cells, exposed to hypoxia (0hR) and hypoxia-reoxygenation for 6 h (6hR). Luciferase activity was analyzed and expressed related to RA-exposed cells. *RA vs. exposure (n = 3). B: Chromatin immunoprecipitation (ChIP) analysis of Nrf2 binding to the functional AREs of the HMOX1 promoter. HK-2 cells were exposed to RA, hypoxia, or hypoxia-reoxygenation, and chromatin was cross-linked and immunoprecipitated with IgG or anti-Nrf2 antibodies. Immunoprecipitated DNA was subjected to qRT-PCR using SYBR primers. Top: positions of the ARE sites and forward (F) and reverse (R) primers of the HMOX1 enhancer used in ChIP assays. Nrf2 binding to the HMOX1 promoter in cells exposed to acute (left) or chronic (right) hypoxia and hypoxia-reoxygenation. Data are presented as means ± SE (n = 3). *RA vs. exposure.
Fig. 8.
Fig. 8.
Promoter activity and Nrf2 binding of the E1 (or SX2) enhancer following acute and chronic hypoxia and reoxygenation. A: cells were transfected with Hmox1 promoter reporter bearing E1 (formerly known as SX2) enhancer, but lacking the −9.0 kb AB1 enhancer elements (100 ng). pRL-TK plasmid (5 ng) was used as an internal reference to monitor transfection efficiency. Cells were exposed to acute (2 h) or chronic (12 h) hypoxia and hypoxia-reoxygenation for 6 h, and luciferase activity was determined as described in Fig. 7. B: ChIP analysis of Nrf2 binding to the E1 enhancer. Chromatin immunoprecipitated with IgG or Nrf2 antibodies was subjected to qRT-PCR using forward (F) and reverse (R) primers encompassing AREs located at −4.0 kb. C: ChIP analysis of Nrf2 binding to the proximal promoter (−44 bp) region. Data are presented as means ± SE (n = 3). *RA vs. exposure. Arrows indicate position of the primers.
Fig. 9.
Fig. 9.
Effects of Nrf2 knockdown on hypoxia stimulated HMOX1 expression. qRT-PCR analysis of HMOX1 (A) and Nrf2 (B) mRNA expression in HK-2 cells transfected with either scrambled (Scr)-silent interfering (si) RNA or Nrf2-siRNA and subsequently exposed to acute or chronic hypoxia. Values from the Scr-siRNA transfected cells are considered as 1. *RA vs. hypoxia; **Scr-siRNA vs. Nrf2-SiRNA (n = 3).
Fig. 10.
Fig. 10.
Hypoxia-inducible Hmox1 expression is blunted in Nrf2-deficient kidney epithelia. Primary kidney epithelial cells from Nrf2+/+ or Nrf2−/− mice were isolated and then exposed to RA, acute or chronic hypoxia, and hypoxia-reoxygenation conditions. Cells were lysed for RNA and protein extractions. A: Hmox1 expression analyzed by qRT-PCR analysis. *RA vs. hypoxia; **Nrf2+/+ vs. Nrf2−/−. Data are presented as means ± SE (n = 4). B: Hmox1 levels were analyzed by immunoblot analysis and quantified as detailed above. Values from a representative blot (n = 2) are shown.

Similar articles

Cited by

References

    1. Agarwal A, Nick HS. Renal response to tissue injury: lessons from heme oxygenase-1 GeneAblation and expression. J Am Soc Nephrol 11: 965–973, 2000. - PubMed
    1. Alam J, Cook JL. How many transcription factors does it take to turn on the heme oxygenase-1 gene? Am J Respir Cell Mol Biol 36: 166–174, 2007. - PubMed
    1. Bell CL, Tenenhouse HS, Scriver CR. Initiation and characterization of primary mouse kidney epithelial cultures. In Vitro Cell Dev Biol 24: 683–695, 1988. - PubMed
    1. Chen X, Wei SY, Li JS, Zhang QF, Wang YX, Zhao SL, Yu J, Wang C, Qin Y, Wei QJ, Lv GX, Li B. Overexpression of heme oxygenase-1 prevents renal interstitial inflammation and fibrosis induced by unilateral ureter obstruction. PLoS One 11: e0147084, 2016. - PMC - PubMed
    1. Cornblatt BS, Ye L, Dinkova-Kostova AT, Erb M, Fahey JW, Singh NK, Chen MS, Stierer T, Garrett-Mayer E, Argani P, Davidson NE, Talalay P, Kensler TW, Visvanathan K. Preclinical and clinical evaluation of sulforaphane for chemoprevention in the breast. Carcinogenesis 28: 1485–1490, 2007. - PubMed

Publication types

MeSH terms

LinkOut - more resources