

Functional changes in Becker muscular dystrophy: implications for clinical trials in dystrophinopathies
- PMID: 27582364
- PMCID: PMC5007528
- DOI: 10.1038/srep32439
Functional changes in Becker muscular dystrophy: implications for clinical trials in dystrophinopathies
Abstract
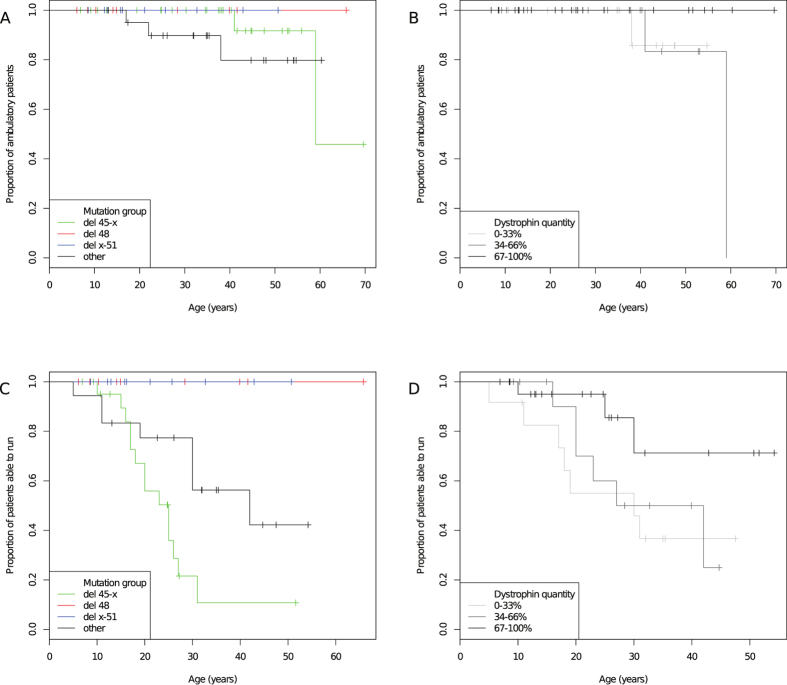
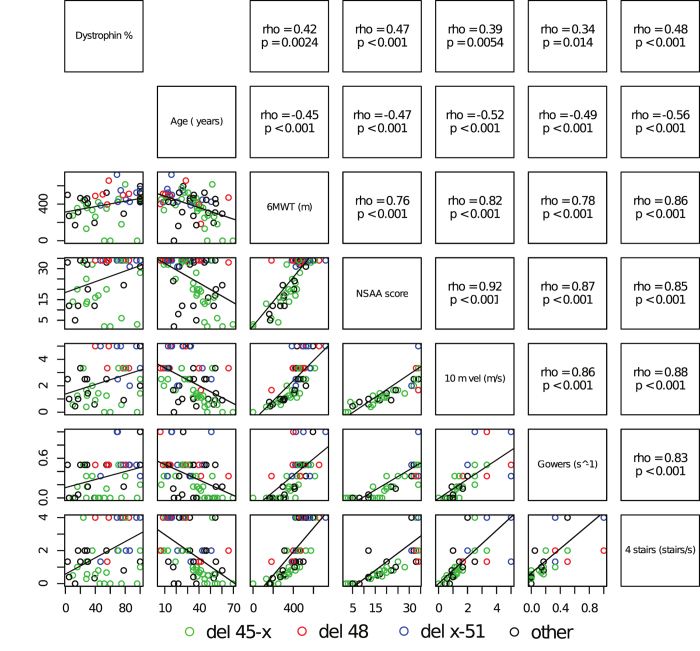
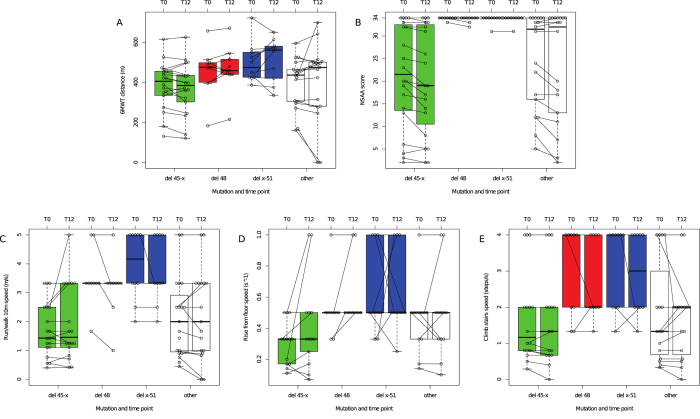
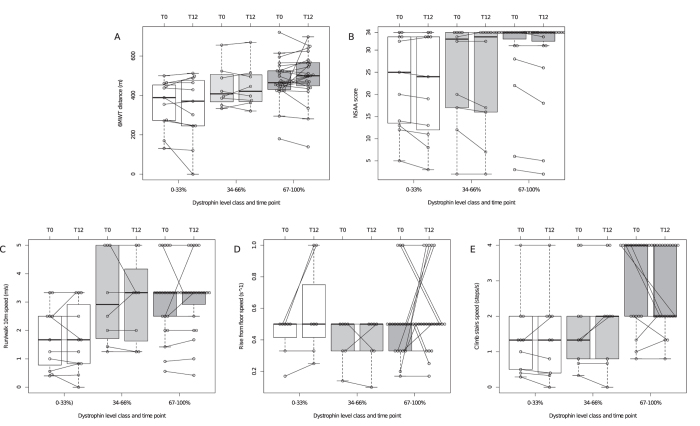
We performed a 1-year longitudinal study of Six Minute Walk Test (6MWT), North Star Ambulatory Assessment (NSAA), and timed function tests in Becker muscular dystrophy (BMD). Skeletal muscle dystrophin was quantified by immunoblot. We grouped deletions ending on exon 45 ("del 45-x", n = 28) or 51 ("del x-51", n = 10); isolated exon 48 deletion ("del 48", n = 10); and other mutations (n = 21). Only patients in the "del 45-x" or "other" groups became non-ambulatory (n = 5, log-rank p = n.s.) or unable to run (n = 22, p < 0.001). All measures correlated positively with dystrophin quantity and negatively with age, and were significantly more impaired in the "del 45-x" and "other" groups. After one year, NSAA score decreased significantly (-0.9 ± 1.6, p < 0.001); in the "del 45-x" group, both NSAA (-1.3 ± 1.7, p = 0.001) and 6MWT (-12 ± 31 m, p = 0.059) decreased. We conclude that patients with "del x-51" or "del 48" mutations have mild or asymptomatic BMD, while "del 45-x" mutations cause comparatively severe weakness, and functional deterioration in 1 year. Furthermore, exon 51 skipping could be more effective than exon 45 skipping in Duchenne muscular dystrophy.
Conflict of interest statement
L.B., P.C., A.B., M.F., C.S., G.S., L.C., C.C. and C.A. report no disclosures. E.P. reports personal fees from Genzyme and PTC Pharmaceuticals, outside the submitted work.
Figures
Similar articles
-
Dystrophin quantification and clinical correlations in Becker muscular dystrophy: implications for clinical trials.Brain. 2011 Dec;134(Pt 12):3547-59. doi: 10.1093/brain/awr291. Epub 2011 Nov 18. Brain. 2011. PMID: 22102647 Free PMC article.
-
[Clinical features of patients with Becker muscular dystrophy and deletions of the rod domain of dystrophin gene].Zhonghua Yi Xue Yi Chuan Xue Za Zhi. 2018 Feb 10;35(1):14-17. doi: 10.3760/cma.j.issn.1003-9406.2018.01.003. Zhonghua Yi Xue Yi Chuan Xue Za Zhi. 2018. PMID: 29419852 Chinese.
-
Muscle MRI and functional outcome measures in Becker muscular dystrophy.Sci Rep. 2017 Nov 22;7(1):16060. doi: 10.1038/s41598-017-16170-2. Sci Rep. 2017. PMID: 29167533 Free PMC article.
-
Cardiac phenotype of Duchenne Muscular Dystrophy: insights from cellular studies.J Mol Cell Cardiol. 2013 May;58:217-24. doi: 10.1016/j.yjmcc.2012.12.009. Epub 2012 Dec 20. J Mol Cell Cardiol. 2013. PMID: 23261966 Free PMC article. Review.
-
Duchenne and Becker muscular dystrophies.Neurol Clin. 2014 Aug;32(3):671-88, viii. doi: 10.1016/j.ncl.2014.05.002. Neurol Clin. 2014. PMID: 25037084 Review.
Cited by
-
Low dystrophin variability between muscles and stable expression over time in Becker muscular dystrophy using capillary Western immunoassay.Sci Rep. 2021 Mar 15;11(1):5952. doi: 10.1038/s41598-021-84863-w. Sci Rep. 2021. PMID: 33723284 Free PMC article.
-
Duchenne muscular dystrophy.Nat Rev Dis Primers. 2021 Feb 18;7(1):13. doi: 10.1038/s41572-021-00248-3. Nat Rev Dis Primers. 2021. PMID: 33602943 Free PMC article. Review.
-
Platelet Derived Growth Factor-AA Correlates With Muscle Function Tests and Quantitative Muscle Magnetic Resonance in Dystrophinopathies.Front Neurol. 2021 Jun 11;12:659922. doi: 10.3389/fneur.2021.659922. eCollection 2021. Front Neurol. 2021. PMID: 34177765 Free PMC article.
-
Findings from the Longitudinal CINRG Becker Natural History Study.J Neuromuscul Dis. 2024;11(1):201-212. doi: 10.3233/JND-230178. J Neuromuscul Dis. 2024. PMID: 37980682 Free PMC article.
-
An 11-month-old boy with transaminitis.Paediatr Child Health. 2019 Dec 24;26(1):16-18. doi: 10.1093/pch/pxz173. eCollection 2021 Feb. Paediatr Child Health. 2019. PMID: 33542770 Free PMC article. No abstract available.
References
-
- Hoffman E. P. et al. Improved diagnosis of Becker muscular dystrophy by dystrophin testing. Neurology. 39, 1011–1017 (1989). - PubMed
-
- Darras B. T., Miller. D. T. & Urion D. K. Dystrophinopathies in GeneReviews® (ed Pagon R. A. et al.). Internet. Seattle (WA): University of Washington, 1993–2015. Available from http://www.ncbi.nlm.nih.gov/books/NBK1119/. - PubMed
-
- Angelini C. et al. Clinical-molecular correlation in 104 mild X-linked muscular dystrophy patients: characterization of sub-clinical phenotypes. Neuromuscul. Disord. 4, 349–358 (1994). - PubMed
-
- Hoffman E. P. et al. Is the carboxyl-terminus of dystrophin required for membrane association? A novel, severe case of Duchenne muscular dystrophy. Ann. Neurol. 30, 605–610 (1991). - PubMed
-
- Aartsma-Rus A. et al. Entries in the Leiden Duchenne muscular dystrophy mutation database: an overview of mutation types and paradoxical cases that confirm the reading-frame rule. Muscle Nerve. 34, 135–144 (2006). - PubMed
Publication types
MeSH terms
Substances
LinkOut - more resources
Full Text Sources
Other Literature Sources
Miscellaneous
