. 2016 Nov 7;27(22):3627-3636.
doi: 10.1091/mbc.E16-07-0478. Epub 2016 Aug 31.

Clus-DoC: a combined cluster detection and colocalization analysis for single-molecule localization microscopy data

Affiliations

Clus-DoC: a combined cluster detection and colocalization analysis for single-molecule localization microscopy data

Sophie V Pageon et al. Mol Biol Cell. .

Abstract

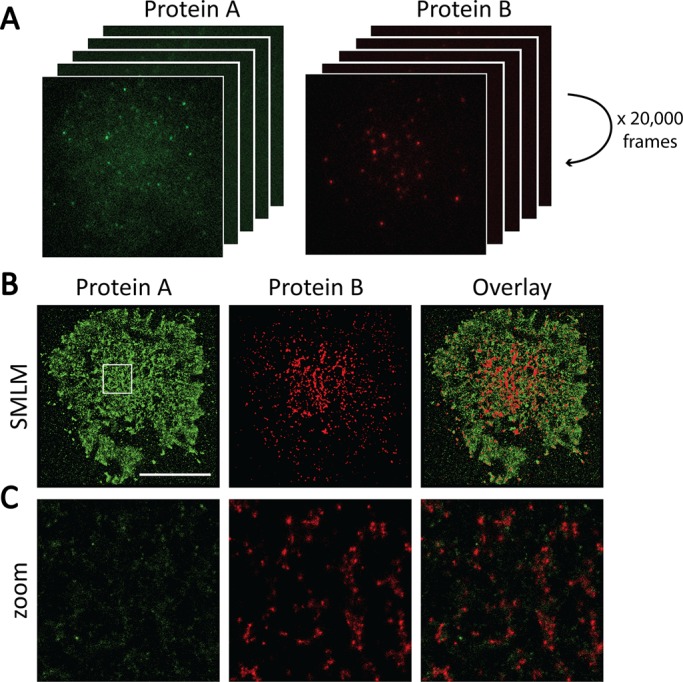
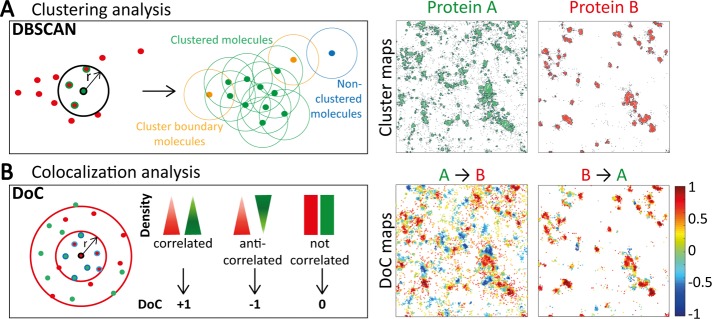
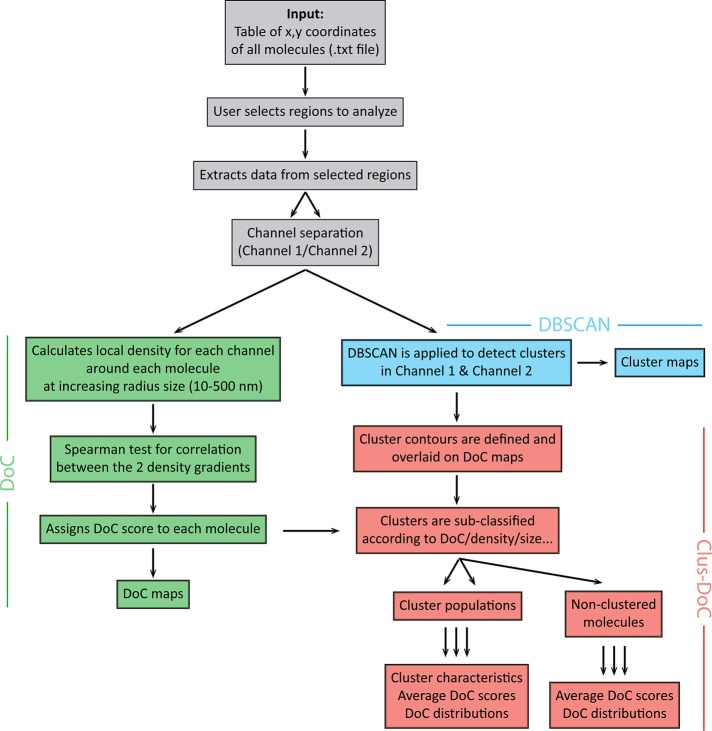
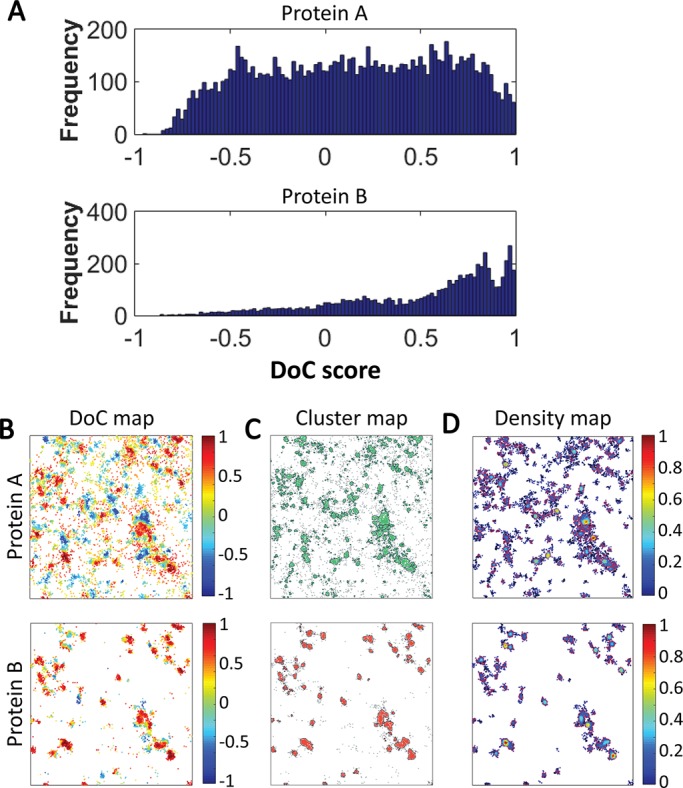
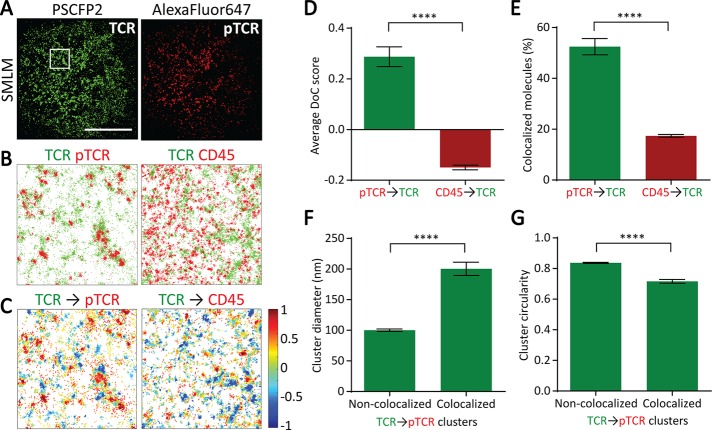
Advances in fluorescence microscopy are providing increasing evidence that the spatial organization of proteins in cell membranes may facilitate signal initiation and integration for appropriate cellular responses. Our understanding of how changes in spatial organization are linked to function has been hampered by the inability to directly measure signaling activity or protein association at the level of individual proteins in intact cells. Here we solve this measurement challenge by developing Clus-DoC, an analysis strategy that quantifies both the spatial distribution of a protein and its colocalization status. We apply this approach to the triggering of the T-cell receptor during T-cell activation, as well as to the functionality of focal adhesions in fibroblasts, thereby demonstrating an experimental and analytical workflow that can be used to quantify signaling activity and protein colocalization at the level of individual proteins.


Figures

FIGURE 1:
FIGURE 1:
SMLM acquisition and image reconstruction. (A) For SMLM, a large number of frames are acquired for each cell. In each frame, only sparse subsets of molecules are fluorescent and can be accurately localized. If sufficient frames are collected (e.g., 20,000 frames in our example), a superresolved image of the sample can be reconstructed from the localizations of all molecules detected during the acquisition. (B) Reconstructed images of a two-color SMLM acquisition. Scale bar, 10 μm. (C) Enlargement of the 4 μm × 4 μm region highlighted in white in B. Each individual dot represents one detected molecule.
FIGURE 2:
FIGURE 2:
Principles underlying DBSCAN and DoC analysis methods. (A) DBSCAN is a propagative cluster detection method in which connectivity between molecules is established if the number of neighbors is above a certain threshold (e.g., 3 in the diagram) within a radius r (e.g., 20 nm). The connection is propagated if the parameters are fulfilled (green dots) and stops when the parameters are no longer fulfilled (yellow dots). This method can also identify isolated points and noise (blue dots). This analysis yields cluster maps (4 μm × 4 μm) in which molecules in clusters are colored green or red and molecules outside clusters are in gray. Cluster contours are highlighted with black lines. (B) The DoC analysis is a coordinate-based colocalization analysis. From the molecular coordinates of both channels, the local density of each channel is calculated at increasing radius sizes around each molecule, providing density gradients for both channels. The two gradients of density are tested for correlation, resulting in a DoC score for each molecule. DoC scores range from −1 to +1, with −1 indicating segregation, 0 indicating random distribution, and +1 indicating colocalization. This analysis yields colocalization maps (4 μm × 4 μm) for both proteins in which each molecule is color coded according to its DoC score.
FIGURE 3:
FIGURE 3:
Analysis workflow for Clus-DoC. The input for the analysis consists in table(s) of x, y-coordinates of all molecules. The DoC module (green) assigns DoC scores to each molecule. The DBSCAN module (blue) detects clusters and defines cluster contours. Finally, the Clus-DoC module (red) links the two previous modules by merging the information on cluster detection and DoC to subsequently distinguish subpopulations of clusters or nonclustered molecules. The outputs include several maps (colocalization, cluster, and density maps). Clustering and colocalization parameters are also extracted, providing parameterized information on the organization of proteins in the sample.
FIGURE 4:
FIGURE 4:
Output data from Clus-DoC analysis. (A) Frequency distributions of DoC scores of all molecules for protein A (top) and protein B (bottom). (B) Colocalization maps for both channels in which molecules are color coded according to their DoC scores. (C) Cluster maps for both channels in which clustered molecules are green or red and nonclustered molecules are gray. Cluster contours are in black. (D) Density maps for both channels in which the color scale represents normalized relative density. All maps are 4 μm × 4 μm.
FIGURE 5:
FIGURE 5:
GUI for Clus-DoC analysis. Image of the GUI for the Clus-DoC analysis, which can be used to load data sets and then run a global clustering analysis (Ripley’s K), cluster detection (DBSCAN), or Clus-DoC analysis. Here the two-color data of one cell are displayed (in green and red), and one ROI is selected (blue square). The number of points from each channel within that ROI and the dimensions of the ROI (in nanometers) are displayed at the top.
FIGURE 6:
FIGURE 6:
Clus-DoC analysis applied to T-cell receptor triggering. (A) Reconstructed SMLM images of TCR (green) and phosphorylated TCR (pTCR; red) in activated Jurkat cells. Scale bar, 10 μm. (B) Left, TCR (green) and pTCR (red) localizations from 4 μm × 4 μm region highlighted in white in A. Right, TCR (green) and CD45 (red) localizations in a representative 4 μm × 4 μm region. (C) Colocalization maps for TCR relative to pTCR (left) and CD45 (right). TCR molecules are color coded according to their DoC scores. (D) Average DoC scores for pTCR and CD45 relative to TCR. (E) Percentage of colocalized pTCR and CD45 molecules relative to TCR. (F) Average cluster diameter for noncolocalized and colocalized TCR clusters relative to pTCR. (G) Average cluster circularity for noncolocalized and colocalized TCR clusters relative to pTCR. Circularity is measured as the ratio of perimeter to area, such that a perfect circle has a circularity score of 1. ****p < 0.0001 (unpaired t test for D and E and paired t test for F and G).
FIGURE 7:
FIGURE 7:
Clus-DoC analysis applied to focal adhesions. (A) Two-color TIRF image of paxillin (green) and phosphorylated paxillin (p-paxillin; red) in MEF cells on fibronectin. Scale bar, 10 μm. (B) SMLM data of paxillin (green) and p-paxillin (red) from 6 μm × 6 μm region highlighted in white in A. (C) Zoom of 1 μm × 1 μm region highlighted in black in B. (D) Frequency distributions of DoC scores of all molecules for paxillin (top) and p-paxillin (bottom), with mean DoC scores indicated. (E) Percentage of paxillin molecules colocalized with p-paxillin and percentage of p-paxillin molecules colocalized with paxillin. (F) Relative density of paxillin molecules in paxillin nanoclusters that are or are not colocalized with p-paxillin. *p ≤ 0.05 (paired t test).

References

    1. Andronov L, Orlov I, Lutz Y, Vonesch J-L, Klaholz BP. ClusterViSu, a method for clustering of protein complexes by Voronoi tessellation in super-resolution microscopy. Sci Rep. 2016;6:24084. - PMC - PubMed
    1. Ankerst M, Breunig MM, Kriegel H-P, Sander J. OPTICS: ordering points to identify the clustering structure. ACM SIGMOD Record. 1999;28:49–60.
    1. Annibale P, Scarselli M, Kodiyan A, Radenovic A. Photoactivatable fluorescent protein mEos2 displays repeated photoactivation after a long-lived dark state in the red photoconverted form. J Phys Chem Lett. 2010;1:1506–1510.
    1. Annibale P, Vanni S, Scarselli M, Rothlisberger U, Radenovic A. Identification of clustering artifacts in photoactivated localization microscopy. Nat Methods. 2011;8:527–528. - PubMed
    1. Betzig E, Patterson GH, Sougrat R, Lindwasser OW, Olenych S, Bonifacino JS, Davidson MW, Lippincott-Schwartz J, Hess HF. Imaging intracellular fluorescent proteins at nanometer resolution. Science. 2006;313:1642–1645. - PubMed

Substances