. 2017 Jan;158(1):34-47.
doi: 10.1097/j.pain.0000000000000707.

Towards a neurophysiological signature for fibromyalgia

Affiliations

Towards a neurophysiological signature for fibromyalgia

Marina López-Solà et al. Pain. 2017 Jan.

Abstract

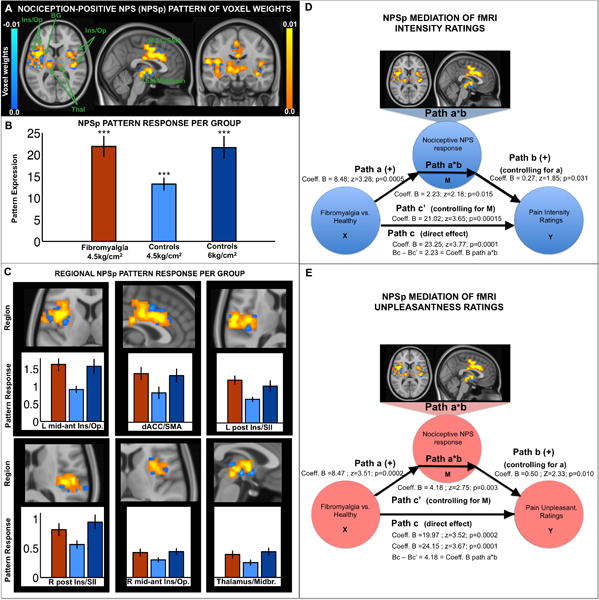
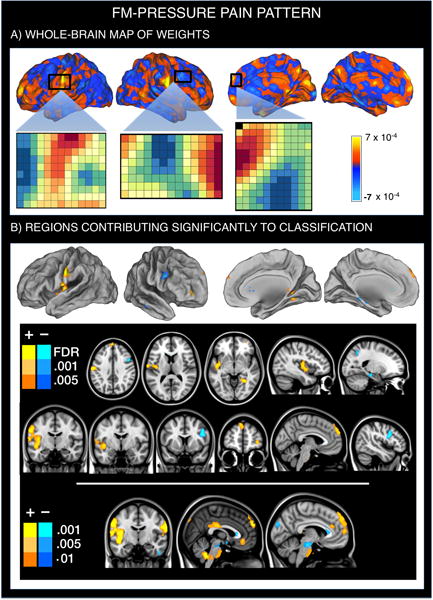
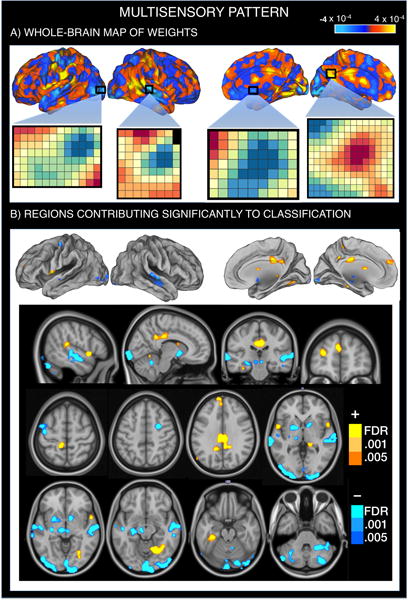
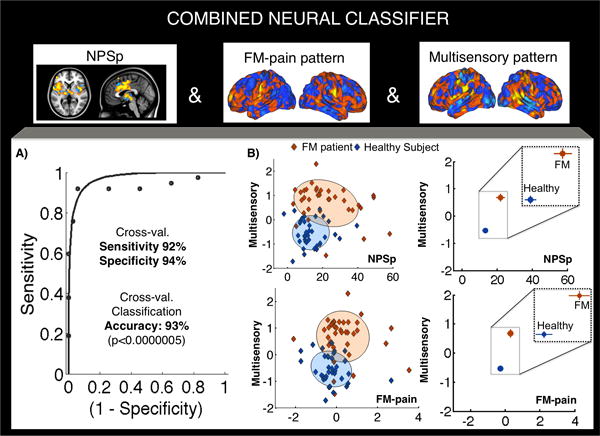
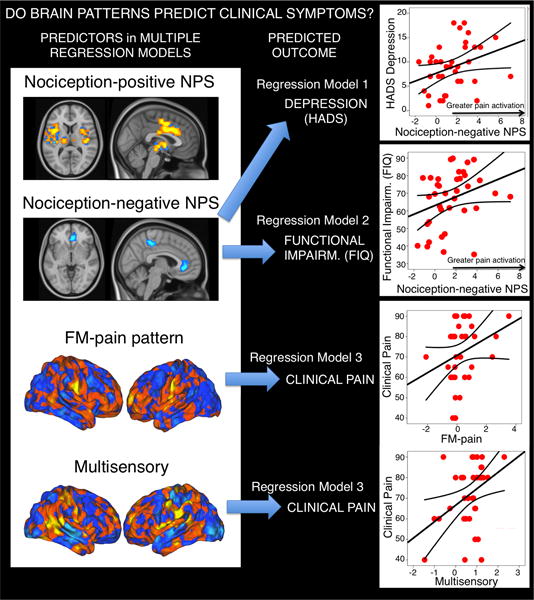
Patients with fibromyalgia (FM) show characteristically enhanced unpleasantness to painful and nonpainful sensations accompanied by altered neural responses. The diagnostic potential of such neural alterations, including their sensitivity and specificity to FM (vs healthy controls) is unknown. We identify a brain signature that characterizes FM central pathophysiology at the neural systems level. We included 37 patients with FM and 35 matched healthy controls, and analyzed functional magnetic resonance imaging responses to (1) painful pressure and (2) nonpainful multisensory (visual-auditory-tactile) stimulation. We used machine-learning techniques to identify a brain-based FM signature. When exposed to the same painful stimuli, patients with FM showed greater neurologic pain signature (NPS; Wager et al., 2013. An fMRI-based neurologic signature of physical pain. N Engl J Med 2013;368:1388-97) responses. In addition, a new pain-related classifier ("FM-pain") revealed augmented responses in sensory integration (insula/operculum) and self-referential (eg, medial prefrontal) regions in FM and reduced responses in the lateral frontal cortex. A "multisensory" classifier trained on nonpainful sensory stimulation revealed augmented responses in the insula/operculum, posterior cingulate, and medial prefrontal regions and reduced responses in the primary/secondary sensory cortices, basal ganglia, and cerebellum. Combined activity in the NPS, FM pain, and multisensory patterns classified patients vs controls with 92% sensitivity and 94% specificity in out-of-sample individuals. Enhanced NPS responses partly mediated mechanical hypersensitivity and correlated with depression and disability (Puncorrected < 0.05); FM-pain and multisensory responses correlated with clinical pain (Puncorrected < 0.05). The study provides initial characterization of individual patients with FM based on pathophysiological, symptom-related brain features. If replicated, these brain features may constitute objective neural targets for therapeutic interventions. The results establish a framework for assessing therapeutic mechanisms and predicting treatment response at the individual level.


Conflict of interest statement

The authors declare no conflict of interests.

Figures

Figure 1
Figure 1
Nociception-positive NPS (NPSp) map of voxel weights (A); pattern response per group (B); and contiguous regions (C). Ins/Op, insula and operculum; BG, basal ganglia; Thal, thalamus. dACC/SMA, dorsal anterior cingulate cortex and supplementary motor area. L, left, R, right. Midbr, midbrain. Error bars represent standard errors of the mean. ***, p<0.0001. Responses to low intensity stimulation in Figure 1B were 21.87 ± 14.00 (t=9.5, p<0.0001) in FM patients and 13.21± 8.02 in healthy participants (t=9.74, p<0.0001). Responses to high intensity stimulation were 21.62 ± 13.31 in healthy participants (t=9.74, p<0.0001). NPSp pattern response significantly mediates (partial mediation) the relationship between clinical category (FM diagnosis present vs. absent) and Pain Intensity (D), and Pain Unpleasantness (E) ratings in response to 4.5kg/cm2 painful pressure. All coefficients in the mediation models have been tested for significance using 10,000 bootstrap tests. One-tail p-values are reported as we had directional a priori hypotheses (FM patients will show greater NPS responses; and, the greater the NPS response the higher the pain ratings).
Figure 2
Figure 2
Multivariate brain pattern that predicts fibromyalgia status on the basis of brain activation during painful (pressure) stimulation. Positive weight values reflect higher pain-evoked activation in FM patients relative to healthy participants, whereas negative weight values reflect reduced pain-evoked activation in FM patients. A. SVM pattern of whole-brain voxel weights that optimizes classification of FM patients and healthy participants. We provide the voxel-by-voxel weights for three representative regions (anterior SII, right dorsolateral and dorsomedial PFC) to illustrate the concept of weighted pattern. B. Regions whose voxel weights contributed most reliably to the prediction of FM status (q<0.05 FDR-corrected for the first two rows; p-uncorrected<0.001 to further illustrate the findings).
Figure 3
Figure 3
Multivariate brain pattern that predicts fibromyalgia status on the basis of brain activation during multisensory stimulation. Positive weight values reflect higher multisensory-evoked activation in FM patients relative to healthy participants, whereas negative weight values reflect reduced multisensory-evoked activation in FM patients. A. SVM pattern of whole-brain voxel weights that optimizes classification of FM patients and healthy participants. We provide the voxel-by-voxel weights for four representative regions (visual cortex, auditory cortex, basal ganglia and PCC) to illustrate the concept of weighted pattern. B. Regions whose voxel weights contributed most reliably to the prediction of FM status (FDR-corrected). The top row matches the view of Figure 3A, showing that the most reliably predicting voxels correspond to those showing the highest and lowest weights. The last three rows represent sagittal, coronal and axial views showing all predictive voxel clusters.
Figure 4
Figure 4
Sensitivity and specificity of the combined neural classifier including NPSp, FM-pain and Multisensory responses (cross-validated) for each subject. Figure 4A shows the receiver-operating characteristic (ROC) plot displaying sensitivity and specificity properties for the combined classifier. Figure 4B (left panels) shows the individual subjects’ data in the join space of NPSp and Multisensory or FM-pain and Multisensory pattern responses. The shadowed areas represent 95% confidence regions for each group. The coefficients of correlation between pattern expression scores for healthy participants are: Multisensory and NPSp, r = 0.17 (p = 0.92), Multisensory and FM-pain, r = −0.26 (p=0.12), NPSp and FM-pain, r = 0.015 (p=0.93). And, for FM patients: Multisensory and NPSp, r = −0.24 (p=0.14), Multisensory and FM-pain, r = −0.09 (p=0.59), NPSp and FM-pain, r = 0.39 (p=0.017). Figure 4B (right panels) represent the group means (and SE) in the same spaces. Outlier tests were performed (≥ 3.5 SDs from the mean of the subject’s group). Only one control showed a value more similar to the Fibromyalgia group than to the Healthy Control group (z=3.93), for the FM-pain pattern.
Figure 5
Figure 5
Prediction of symptom severity using brain patterns (NPSp, NPSn, FM-pain and Multisensory) in multiple regression models. The blue arrows indicate statistically significant predictors for each multiple regression analysis model described in the main text. The straight lines in the plots are the standard linear fit lines for each regression model, and the two additional lines in each plot correspond to the confidence intervals for the mean. Of note, the correlation findings reported here are preliminary and need further replication in multiple samples. The right top panel illustrates the correlation between NPSn pattern responses and HADS depression scores in patients (r=0.333, p=0.044); the next panel illustrates the correlation between NPSn pattern responses and functional impairment scores (r=0.309, p=0.063, two-tailed); lastly, FM-pain and Multisensory responses jointly and significantly contributed to the prediction of clinical pain (main text). Here we present the raw correlations between clinical pain and FM-pain pattern responses (r=0.279, p=0.094) and clinical pain and Multisensory pattern responses (r=0.393, p=0.015). To minimize the influence of potential extreme values while retaining the full sample (which is important for evaluating person-level ‘signatures’), we also conducted Spearman rank-correlation tests, which revealed the same pattern of results.

References

    1. Alanoglu E, Ulas UH, Ozdag F, Odabasi Z, Cakci A, Vural O. Auditory event-related brain potentials in fibromyalgia syndrome. Rheumatol Int. 2005;25(5):345–349. - PubMed
    1. Albuquerque RJ, de Leeuw R, Carlson CR, Okeson JP, Miller CS, Andersen AH. Cerebral activation during thermal stimulation of patients who have burning mouth disorder: an fMRI study. Pain. 2006;122(3):223–234. - PubMed
    1. Aparicio VA, Segura-Jimenez V, Alvarez-Gallardo IC, Soriano-Maldonado A, Castro-Pinero J, Delgado-Fernandez M, Carbonell-Baeza A. Fitness Testing in the Fibromyalgia Diagnosis: the al-Andalus Project. Med Sci Sports Exerc. 2014 - PubMed
    1. Baciu MV, Bonaz BL, Papillon E, Bost RA, Le Bas JF, Fournet J, Segebarth CM. Central processing of rectal pain: a functional MR imaging study. AJNR American journal of neuroradiology. 1999;20(10):1920–1924. - PMC - PubMed
    1. Baliki MN, Baria AT, Apkarian AV. The cortical rhythms of chronic back pain. The Journal of neuroscience: the official journal of the Society for Neuroscience. 2011;31(39):13981–13990. - PMC - PubMed

Publication types

MeSH terms