. 2017 Mar;56(3):1182-1188.
doi: 10.1002/mc.22550. Epub 2016 Sep 22.

Targeting proprotein convertases in furin-rich lung cancer cells results in decreased in vitro and in vivo growth

Affiliations

Targeting proprotein convertases in furin-rich lung cancer cells results in decreased in vitro and in vivo growth

Daniel E Bassi et al. Mol Carcinog. 2017 Mar.

Abstract

Proprotein convertases (PCs) are serine proteases with an active role in the post-translational processing of numerous inactive proteins to active proteins including many substrates of paramount importance in cancer development and progression. Furin (PCSKC3), a well-studied member of this family, is overexpressed in numerous human and experimental malignancies. In the present communication, we treated two furin-overexpressing non-small cell carcinoma (NSCLC) cell lines (Calu-6 and HOP-62) with the PC inhibitor CMK (Decanoyl-Arg-Val-Lys-Arg-chloromethylketone). This resulted in a diminished IGF-1R processing and a simultaneous decrease in cell proliferation of two NSCLC lines. Similarly, growth of subcutaneous xenografts of both cell lines, were partially inhibited by an in vivo treatment with the same drug. These observations point to a potential role of PC inhibitors in cancer therapy. © 2016 Wiley Periodicals, Inc.

Keywords: IGF-1R; PCSKC3; furin; lung cancer; proprotein convertases; tumor development.


Figures

Figure 1:
Figure 1:
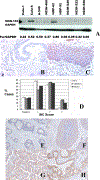
A: Western analysis of human lung cancer cell lines. MON-152 detects the expression of furin, GAPDH represents the loading control. Densitometric evaluation of the blots are expressed as ratios under each lane. This panel illustrates that Calu-6 and HOP-62 cells have very high levels of furin expression, especially when compared with A459, NCI-H460 and H-522 cells that show relatively less furin expression and especially with lines Calu-1 HOP-92, H-520 and H-526 that show minimal expression. Immunohistochemistry of furin innormal (B), and a preneoplastic lesion(C), from bronchial specimens show negative immunohistochemical stain in the normal bronchial epithelium and positive stain in the precursor lesion. The bar graph (D) shows the distribution of furin staining intensity, i.e., negative, 1 plus, 2 plus and 3 plus in IHC stained lung tumors (y axis: % tumors; white columns: squamous cell carcinomas (SCC), grey columns: adenocarcinomas (AdCA) and black columns: all non-small cell lung carcinomas (NSCLC). Example of scoring scale are depicted in panels E to H. Panel E: negative, Panel F; 1 plus, Panel G: 2 plus and Panel H: 3 plus. Furin IHC & hematoxylin counterstain.
Figure 2:
Figure 2:
Furin expression was knocked down with siRNA (A) using Calu-6 cells, levels of furin RNA were determined by real time PCR (Histogram) and Western analysis (lower panel A). IGF-1R processing was detected by Western blotting (B) and the effects on cell proliferation by [3H] thymidine incorporation (C).
Figure 3:
Figure 3:
Calu-6 (A and B) or HOP-62 cells (C and D) cells were treated with two concentrations of the furin inhibitor CMK. The inhibition of IGF-1R processing was dosedependent (A, C). Also the proliferation rates decreased after overnight treatment with CMK (B, D).
Figure 4:
Figure 4:
Calu-6 and HOP-62 (xenografts were injected intratumorally daily either with 200 μM CMK or with vehicle alone. Tumors were measured every two or three days. Volume changes of both types of xenografts showed a reduction of volume after CMK treatment (A &B) (P=0.04 and 0.06). Solid line (control), dotted line (CMK treatment). Better levels of significance (P=0.001 and 0.01 for Calu-6 and HOP-62 respectively) were seen when the mitotic index (evaluated as labeling index of p-Histone 3) in paraffin sections at the last time point of treatment (control versus CMK treated tumors) were compared. Values are expressed in the y axis as mean number of positively stained nuclei/microscopic field ± SEM (C). Panels D to E show the immunohistochemical detection of p-Histone 3 in Calu- 6 control xenografts (D), Calu-6 xenografts treated with CMK (E), HOP-62 xenografts control (F) and HOP-62 xenograft treated with CMK (G). The latter four panels were stained with p-Histone 3 IHC, counterstained with hematoxylin and digitally photographed at X200.

References

    1. Bassi DE, Fu J, Lopez de Cicco R and Klein-Szanto AJP Proprotein convertases: “Master Switches” in the regulation of tumor growth and progression. Molec. Carcinogenesis 2005; 44:151–161. - PubMed
    1. Seidah NG, Sadr MS, Chrétien M, Mbikay M. The multifaceted proprotein convertases: Their unique, redundant, complementary, and opposite functions. J Biol Chem 2013; 288:21473–21481. - PMC - PubMed
    1. Scamuffa N, Calvo F, Chretien M, et al. Proprotein convertases: lessons from knockouts. Faseb J 2006; 20:1954–1963. - PubMed
    1. Yana I and Weiss SJ. Regulation of membrane type-1 matrix metalloproteinase activation by proprotein convertases. Mol Biol Cell 2000; 11:2387–2401. - PMC - PubMed
    1. Taylor NA, Van De Ven WJ, and Creemers JW. Curbing activation: proprotein convertases in homeostasis and pathology. Faseb J 2003; 17:1215–1227. - PubMed

Publication types

MeSH terms