

Precommitment low-level Neurog3 expression defines a long-lived mitotic endocrine-biased progenitor pool that drives production of endocrine-committed cells
- PMID: 27585590
- PMCID: PMC5024683
- DOI: 10.1101/gad.284729.116
Precommitment low-level Neurog3 expression defines a long-lived mitotic endocrine-biased progenitor pool that drives production of endocrine-committed cells
Abstract
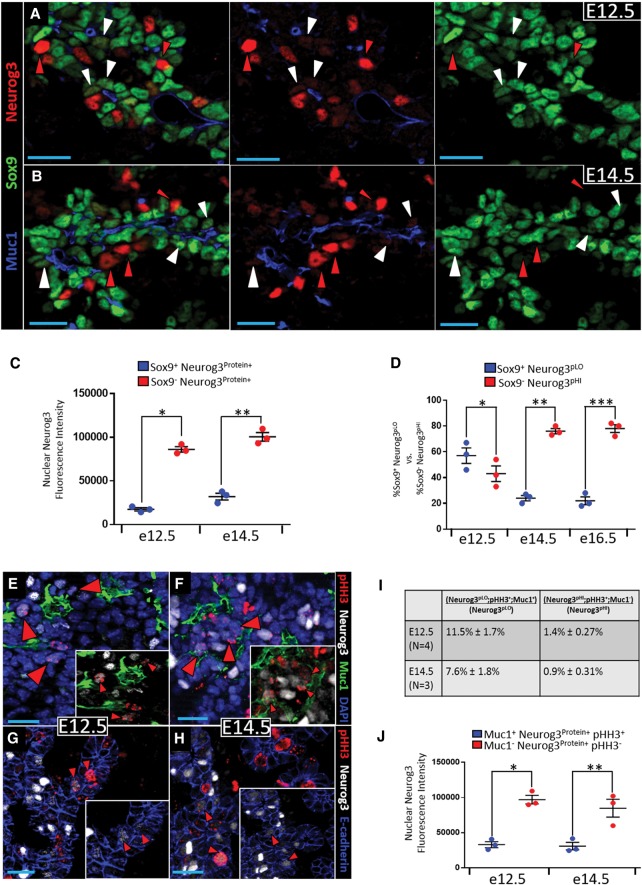
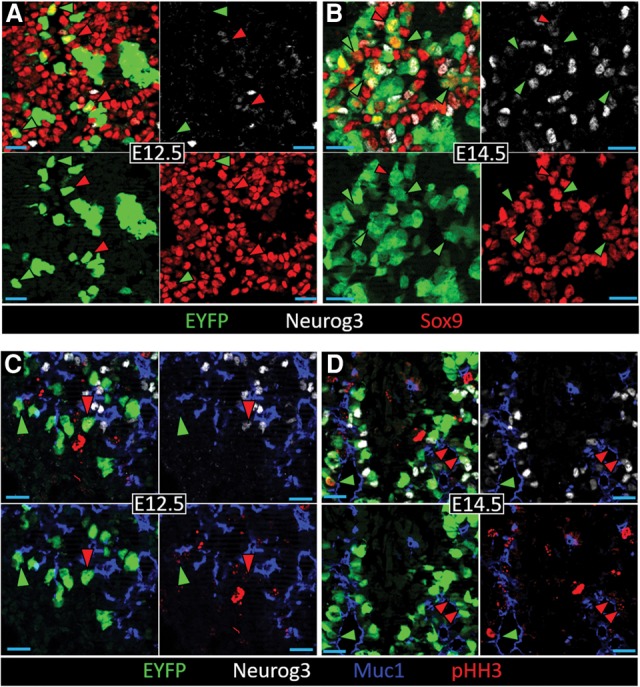
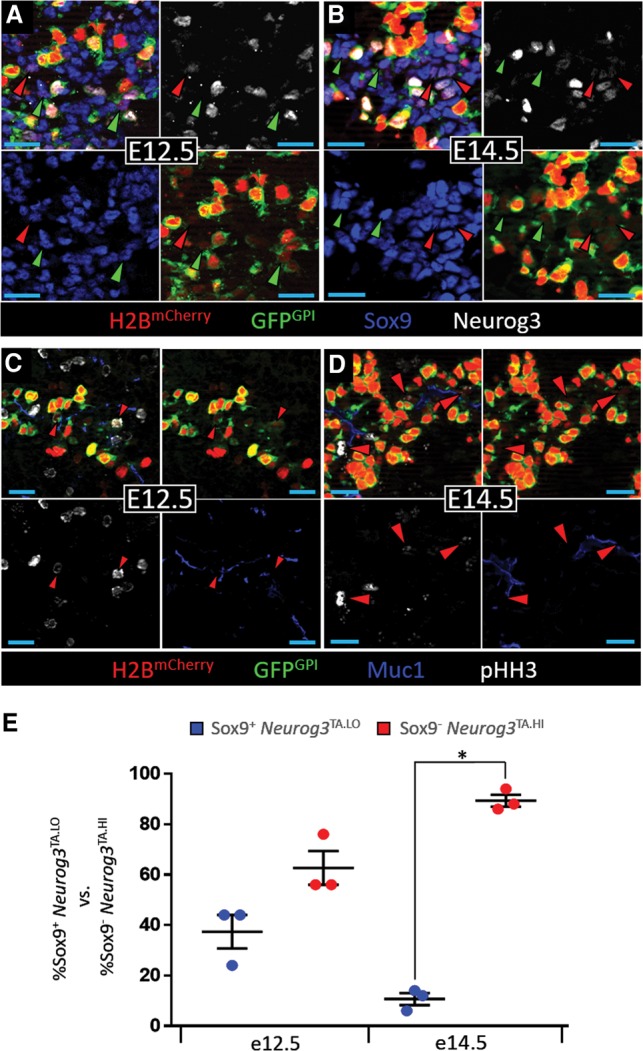
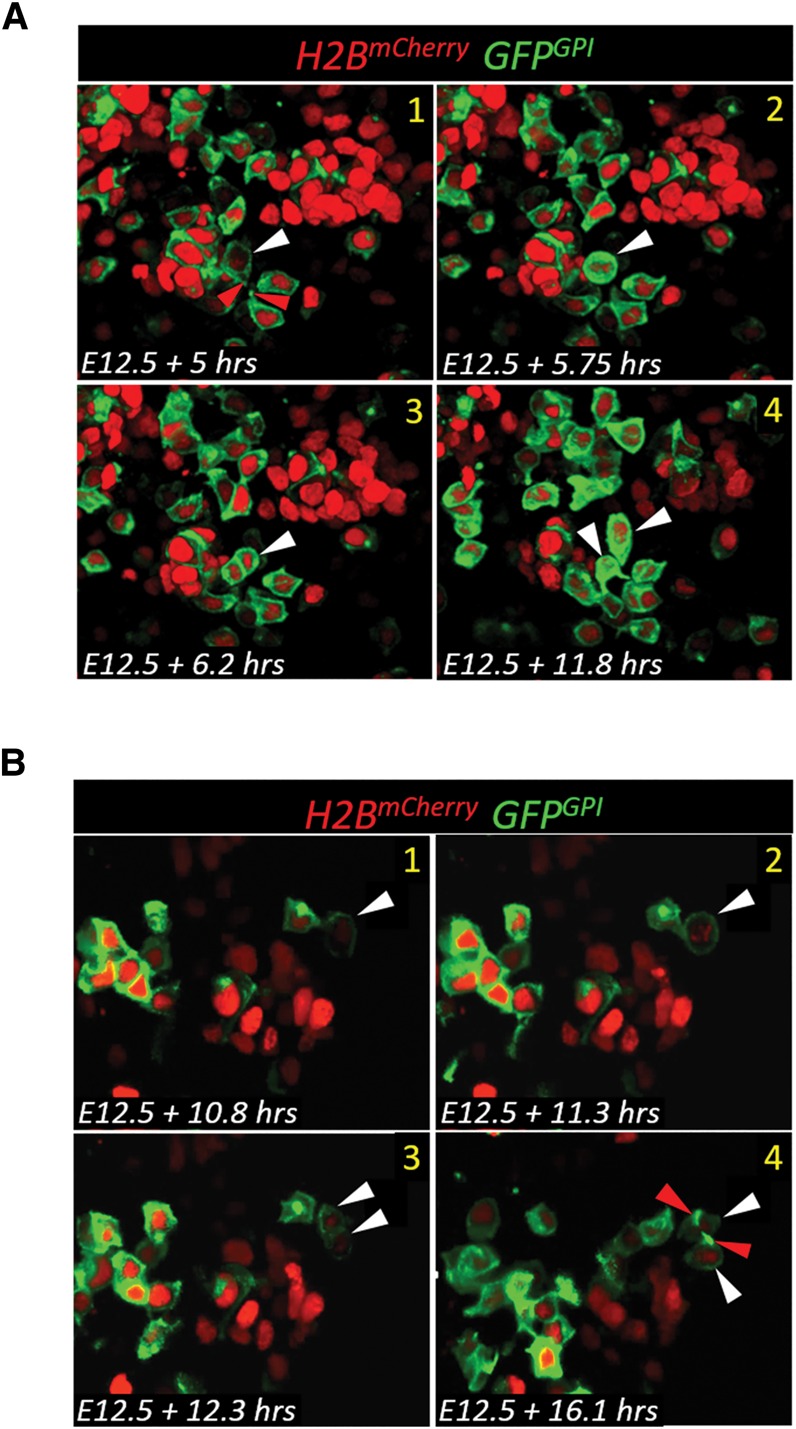
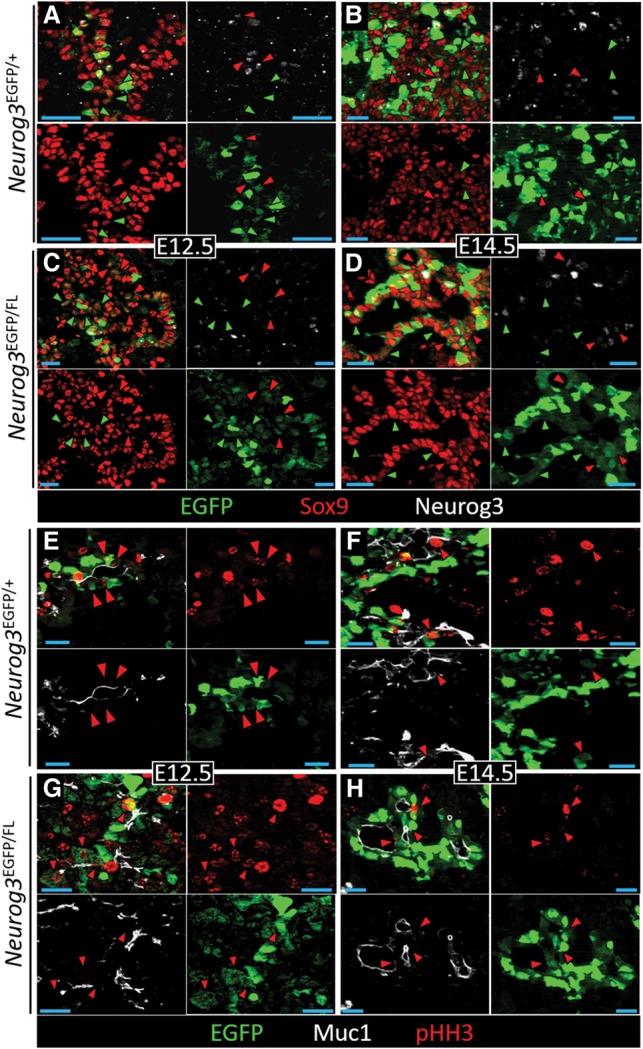
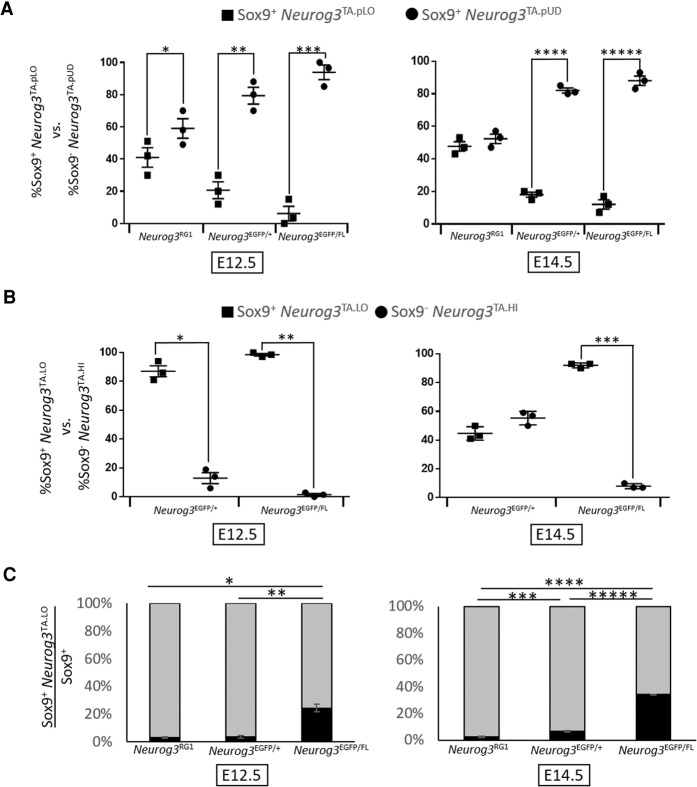
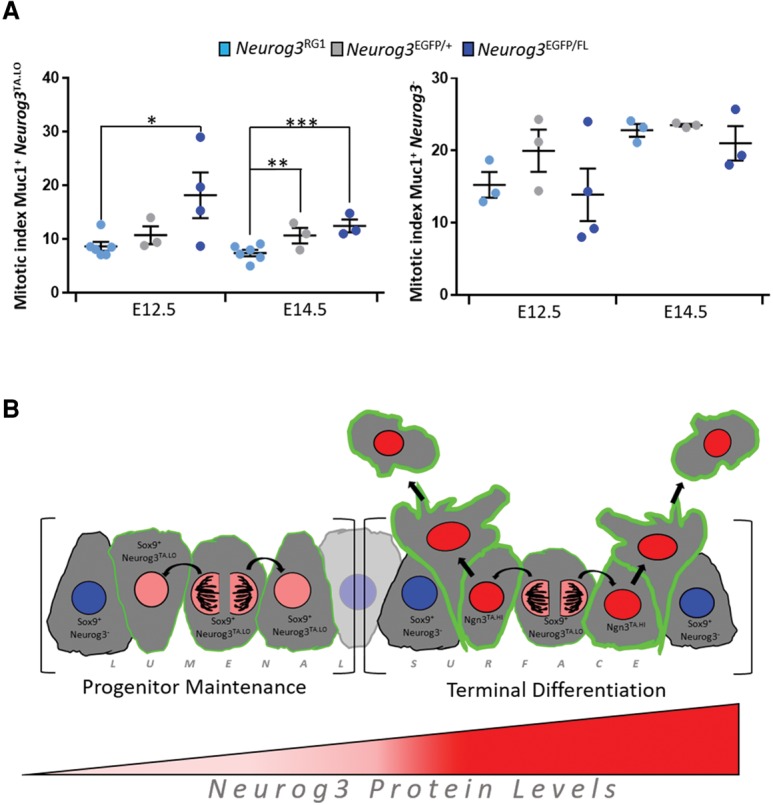
The current model for endocrine cell specification in the pancreas invokes high-level production of the transcription factor Neurogenin 3 (Neurog3) in Sox9(+) bipotent epithelial cells as the trigger for endocrine commitment, cell cycle exit, and rapid delamination toward proto-islet clusters. This model posits a transient Neurog3 expression state and short epithelial residence period. We show, however, that a Neurog3(TA.LO) cell population, defined as Neurog3 transcriptionally active and Sox9(+) and often containing nonimmunodetectable Neurog3 protein, has a relatively high mitotic index and prolonged epithelial residency. We propose that this endocrine-biased mitotic progenitor state is functionally separated from a pro-ductal pool and endows them with long-term capacity to make endocrine fate-directed progeny. A novel BAC transgenic Neurog3 reporter detected two types of mitotic behavior in Sox9(+) Neurog3(TA.LO) progenitors, associated with progenitor pool maintenance or derivation of endocrine-committed Neurog3(HI) cells, respectively. Moreover, limiting Neurog3 expression dramatically increased the proportional representation of Sox9(+) Neurog3(TA.LO) progenitors, with a doubling of its mitotic index relative to normal Neurog3 expression, suggesting that low Neurog3 expression is a defining feature of this cycling endocrine-biased state. We propose that Sox9(+) Neurog3(TA.LO) endocrine-biased progenitors feed production of Neurog3(HI) endocrine-committed cells during pancreas organogenesis.
Keywords: Neurog3; endocrine-biased; mitotic; progenitor.
© 2016 Bechard et al.; Published by Cold Spring Harbor Laboratory Press.
Figures
Similar articles
-
ROCK-nmMyoII, Notch and Neurog3 gene-dosage link epithelial morphogenesis with cell fate in the pancreatic endocrine-progenitor niche.Development. 2018 Sep 21;145(18):dev162115. doi: 10.1242/dev.162115. Development. 2018. PMID: 30126902 Free PMC article.
-
FUCCI tracking shows cell-cycle-dependent Neurog3 variation in pancreatic progenitors.Genesis. 2017 Sep;55(9):10.1002/dvg.23050. doi: 10.1002/dvg.23050. Genesis. 2017. PMID: 28772022 Free PMC article.
-
Phosphorylation of NEUROG3 Links Endocrine Differentiation to the Cell Cycle in Pancreatic Progenitors.Dev Cell. 2017 Apr 24;41(2):129-142.e6. doi: 10.1016/j.devcel.2017.02.006. Dev Cell. 2017. PMID: 28441528 Free PMC article.
-
Revisiting the immunocytochemical detection of Neurogenin 3 expression in mouse and man.Diabetes Obes Metab. 2016 Sep;18 Suppl 1:10-22. doi: 10.1111/dom.12718. Diabetes Obes Metab. 2016. PMID: 27615127 Review.
-
Neurogenin3: a master regulator of pancreatic islet differentiation and regeneration.Islets. 2009 Nov-Dec;1(3):177-84. doi: 10.4161/isl.1.3.9877. Islets. 2009. PMID: 21099270 Review.
Cited by
-
ROCK-nmMyoII, Notch and Neurog3 gene-dosage link epithelial morphogenesis with cell fate in the pancreatic endocrine-progenitor niche.Development. 2018 Sep 21;145(18):dev162115. doi: 10.1242/dev.162115. Development. 2018. PMID: 30126902 Free PMC article.
-
Establishment of a high-resolution 3D modeling system for studying pancreatic epithelial cell biology in vitro.Mol Metab. 2019 Dec;30:16-29. doi: 10.1016/j.molmet.2019.09.005. Epub 2019 Sep 24. Mol Metab. 2019. PMID: 31767167 Free PMC article.
-
Stem Cells, Self-Renewal, and Lineage Commitment in the Endocrine System.Front Endocrinol (Lausanne). 2019 Nov 8;10:772. doi: 10.3389/fendo.2019.00772. eCollection 2019. Front Endocrinol (Lausanne). 2019. PMID: 31781041 Free PMC article. Review.
-
DeepVelo: Single-cell transcriptomic deep velocity field learning with neural ordinary differential equations.Sci Adv. 2022 Dec 2;8(48):eabq3745. doi: 10.1126/sciadv.abq3745. Epub 2022 Nov 30. Sci Adv. 2022. PMID: 36449617 Free PMC article.
-
Pancreatic β-Cell Development and Regeneration.Cold Spring Harb Perspect Biol. 2022 May 27;14(5):a040741. doi: 10.1101/cshperspect.a040741. Cold Spring Harb Perspect Biol. 2022. PMID: 34580120 Free PMC article. Review.
References
-
- Bradford JA, Clarke ST. 2011. Dual-pulse labeling using 5-ethynyl-2′-deoxyuridine (Edu) and 5-bromo-2′-deoxyuridine (BrdU) in flow cytometry. Curr Protoc Cytom 55: 7.38.1–7.38.15. - PubMed
Publication types
MeSH terms
Substances
Grants and funding
LinkOut - more resources
Full Text Sources
Other Literature Sources
Medical
Molecular Biology Databases
Research Materials