

The Antioxidant Effects of Thymoquinone in Activated BV-2 Murine Microglial Cells
- PMID: 27585756
- PMCID: PMC5116410
- DOI: 10.1007/s11064-016-2047-1
The Antioxidant Effects of Thymoquinone in Activated BV-2 Murine Microglial Cells
Abstract
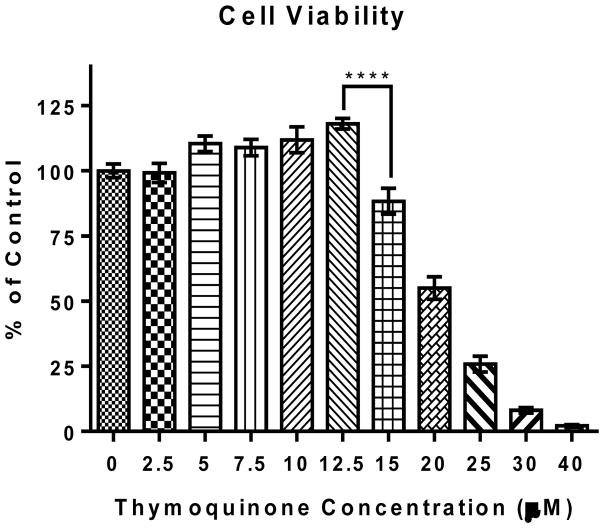
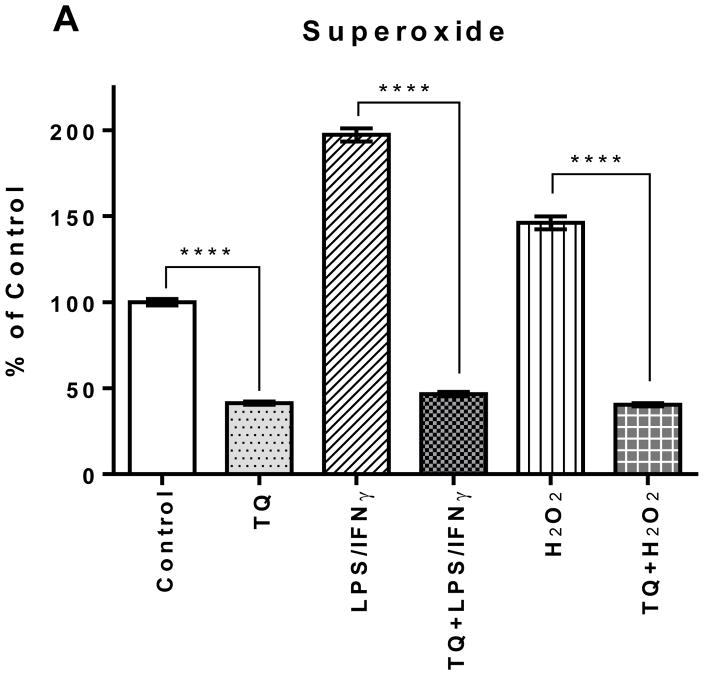
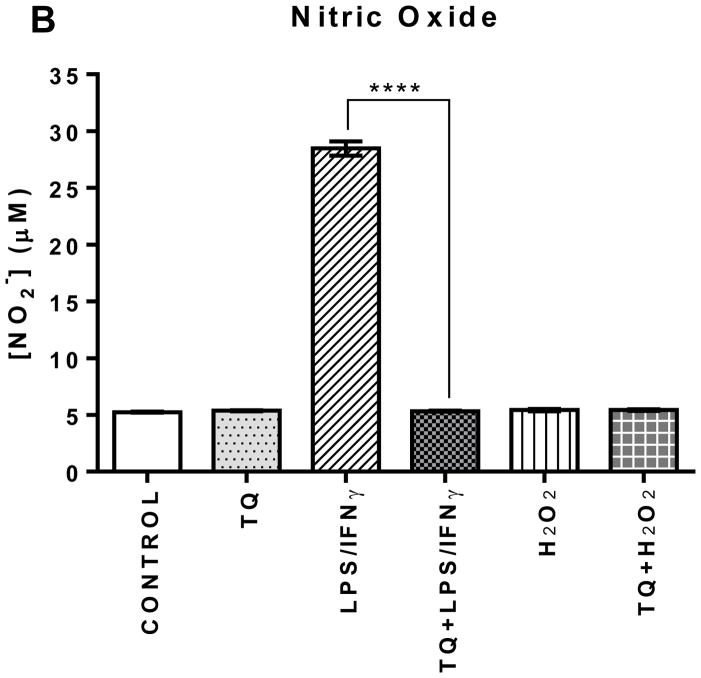
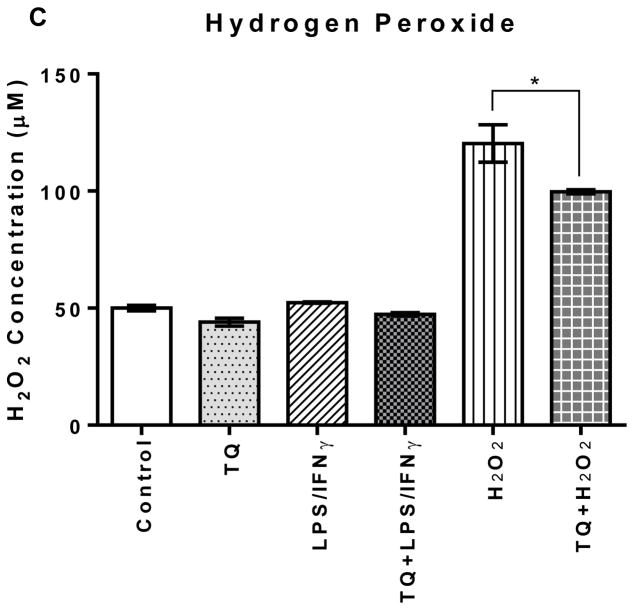
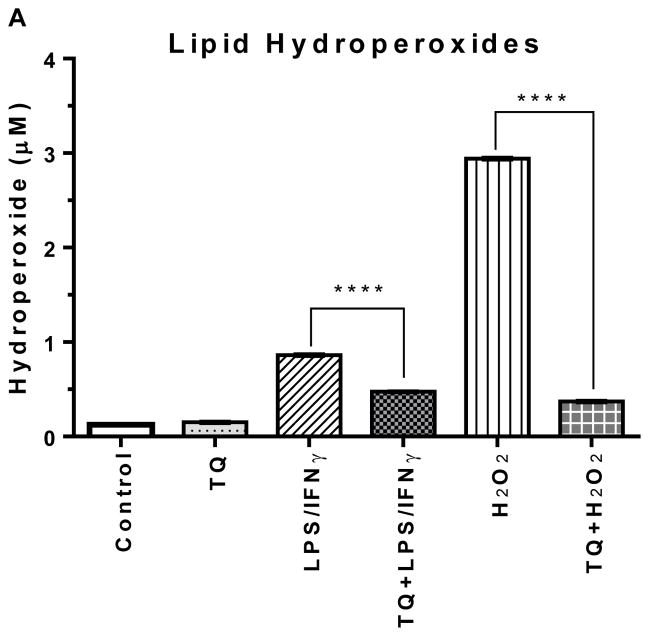
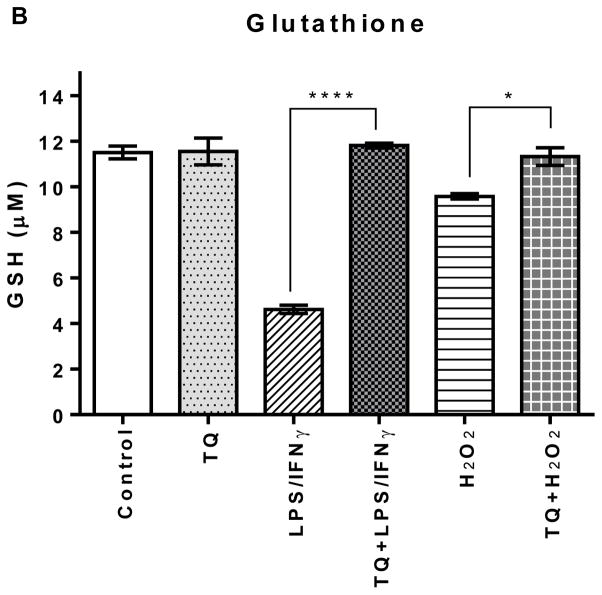
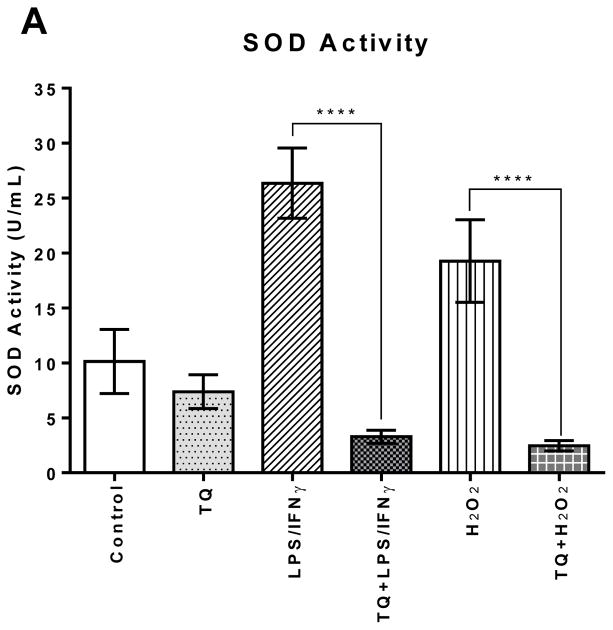
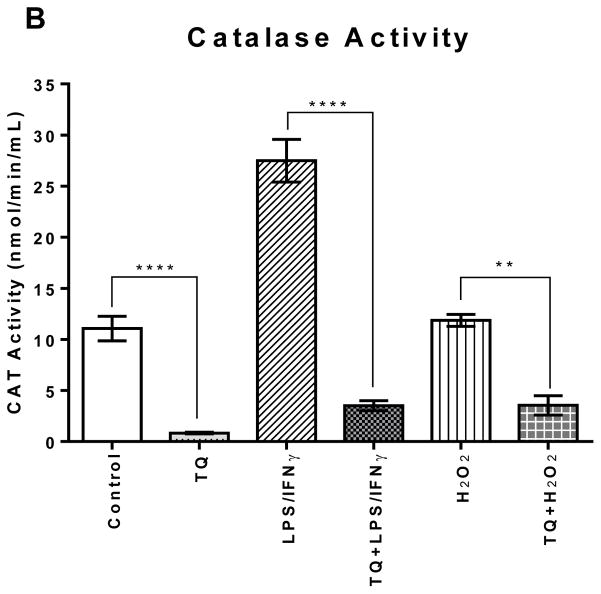
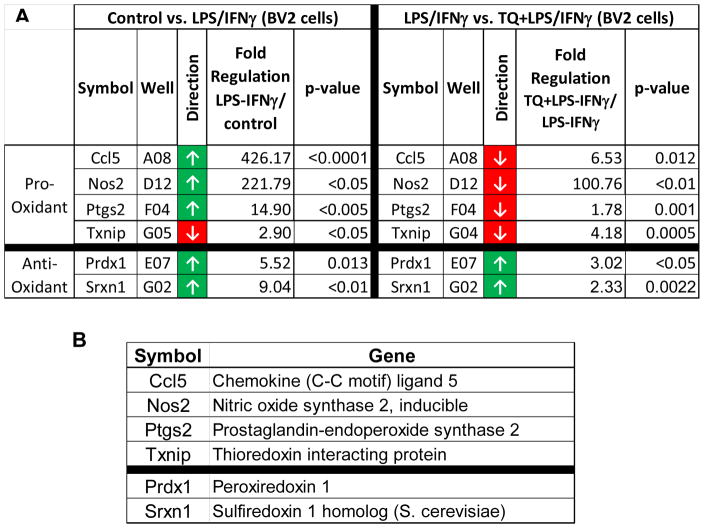
Both neuroinflammation and microglial activation are pathological markers of a number of central nervous system (CNS) diseases. During chronic activation of the microglial cells, the induced release of excessive amounts of reactive oxygen species (ROS) and pro-inflammatory cytokines have been implicated in several neurodegenerative diseases such as Alzheimer's disease. Thymoquinone (TQ), a major bioactive compound of the natural product Nigella sativa seed, has been shown to be effective against numerous oxidative stress-induced and inflammatory disorders as well as possess neuroprotective properties. In this study, we investigated the antioxidant effects of TQ on LPS/IFNγ or H2O2-activated BV-2 microglia by assessing the levels of specific oxidative stress markers, the activities of selected antioxidant enzymes, as well as profiling 84 key genes related to oxidative stress via real-time reverse transcription (RT2) PCR array. Our results showed that in the LPS/IFNγ-activated microglia TQ significantly decreased the cellular production of both superoxide and nitric oxide fourfold (p < 0.0001) and sixfold (p < 0.0001), respectfully. In the H2O2-activated microglia, TQ also significantly decreased the cellular production of superoxide threefold (p < 0.0001) and significantly decreased hydrogen peroxide levels ~20 % (p < 0.05). Moreover, ΤQ treatment significantly decreased the levels oxidative stress in the activated BV-2 as evidenced by the assessed levels of lipid hydroperoxides and glutathione. TQ significantly decreased the levels of lipid hydroperoxides twofold (p < 0.0001) and significantly increased the levels of antioxidant glutathione 2.5-fold (p < 0.0001) in the LPS/IFNγ-activated BV-2 cells. In the H2O2-activated microglia, TQ significantly decreased lipid hydroperoxides eightfold (p < 0.0001) and significantly increased glutathione 15 % (p < 0.05). Activities of antioxidant enzymes, superoxide dismutase (SOD) and catalase (CAT), in the TQ-treated microglial cells also reflected a reduced oxidative stress status in the cellular environment. SOD and CAT activities were sixfold (p < 0.0001) and fivefold (p < 0.0001) lower, respectfully, for the LPS/INFγ-activated microglia treated with TQ in comparison to those that were not. For the H2O2-activated microglia treated with TQ, SOD and CAT activities were fivefold (p < 0.0001) and threefold (p < 0.01) lower, respectfully, compared to the untreated. Furthermore, RT2 PCR array profiling of the selected 84 genes related to oxidative stress confirmed that TQ treatment in the LPS/IFNγ-activated microglia downregulates specific pro-oxidant genes, upregulates specific anti-oxidant genes, and enhances the up- or downregulation of specific genes related to the cells' natural antioxidant defense against LPS/IFNγ activation. These findings suggest that TQ may be utilized as an effective therapeutic agent for delaying the onset and/or slowing/preventing the progression of microglia-derived neurodegeneration propagated by excessive oxidative stress in the CNS.
Keywords: Microglia; Neurodegenerative disease; Oxidative stress; Thymoquinone.
Figures
Similar articles
-
Thymoquinone increases the expression of neuroprotective proteins while decreasing the expression of pro-inflammatory cytokines and the gene expression NFκB pathway signaling targets in LPS/IFNγ -activated BV-2 microglia cells.J Neuroimmunol. 2018 Jul 15;320:87-97. doi: 10.1016/j.jneuroim.2018.04.018. Epub 2018 May 4. J Neuroimmunol. 2018. PMID: 29759145 Free PMC article.
-
Anti-inflammatory effects of thymoquinone in activated BV-2 microglial cells.J Neuroimmunol. 2015 Sep 15;286:5-12. doi: 10.1016/j.jneuroim.2015.06.011. Epub 2015 Jun 27. J Neuroimmunol. 2015. PMID: 26298318 Free PMC article.
-
Anti-inflammatory mechanisms of N-adamantyl-4-methylthiazol-2-amine in lipopolysaccharide-stimulated BV-2 microglial cells.Int Immunopharmacol. 2014 Sep;22(1):73-83. doi: 10.1016/j.intimp.2014.06.022. Epub 2014 Jun 25. Int Immunopharmacol. 2014. PMID: 24975832
-
Several lines of antioxidant defense against oxidative stress: antioxidant enzymes, nanomaterials with multiple enzyme-mimicking activities, and low-molecular-weight antioxidants.Arch Toxicol. 2024 May;98(5):1323-1367. doi: 10.1007/s00204-024-03696-4. Epub 2024 Mar 14. Arch Toxicol. 2024. PMID: 38483584 Free PMC article. Review.
-
Nigella sativa L. and Its Bioactive Constituents as Hepatoprotectant: A Review.Curr Pharm Biotechnol. 2018;19(1):43-67. doi: 10.2174/1389201019666180427110007. Curr Pharm Biotechnol. 2018. PMID: 29701149 Review.
Cited by
-
Biochemical Characterization of Ethiopian Black Cumin (Nigella sativa L.).Int J Food Sci. 2024 Aug 16;2024:2746560. doi: 10.1155/2024/2746560. eCollection 2024. Int J Food Sci. 2024. PMID: 39185325 Free PMC article.
-
Nigella sativa L. and its bioactive and nutraceutical components in the management of diabetic peripheral neuropathy.Inflammopharmacology. 2024 Oct;32(5):2897-2920. doi: 10.1007/s10787-024-01528-6. Epub 2024 Aug 14. Inflammopharmacology. 2024. PMID: 39143432 Review.
-
The Neuroprotective Effects of Thymoquinone: A Review.Dose Response. 2018 Apr 11;16(2):1559325818761455. doi: 10.1177/1559325818761455. eCollection 2018 Apr-Jun. Dose Response. 2018. PMID: 29662431 Free PMC article.
-
Effect of Poria cocos Terpenes: Verifying Modes of Action Using Molecular Docking, Drug-Induced Transcriptomes, and Diffusion Network Analyses.Int J Mol Sci. 2024 Apr 24;25(9):4636. doi: 10.3390/ijms25094636. Int J Mol Sci. 2024. PMID: 38731856 Free PMC article.
-
Role of Oxidative Stress, MAPKinase and Apoptosis Pathways in the Protective Effects of Thymoquinone Against Acrylamide-Induced Central Nervous System Toxicity in Rat.Neurochem Res. 2020 Feb;45(2):254-267. doi: 10.1007/s11064-019-02908-z. Epub 2019 Nov 14. Neurochem Res. 2020. Retraction in: Neurochem Res. 2025 Jul 23;50(4):247. doi: 10.1007/s11064-025-04493-w. PMID: 31728856 Retracted.
References
-
- Kreutzberg GW. Microglia: a sensor for pathological events in the CNS. Trends in neurosciences. 1996;19(8):312–318. - PubMed
-
- Gonzalez-Scarano F, Baltuch G. Microglia as mediators of inflammatory and degenerative diseases. Annual review of neuroscience. 1999;22:219–240. - PubMed
-
- Block ML, Zecca L, Hong JS. Microglia-mediated neurotoxicity: uncovering the molecular mechanisms. Nature reviews Neuroscience. 2007;8(1):57–69. - PubMed
-
- Schwab JM, Schluesener HJ. Microglia rules: Insights into microglial-neuronal signaling. Cell death and differentiation. 2004;11(12):1245–1246. - PubMed
MeSH terms
Substances
Grants and funding
LinkOut - more resources
Full Text Sources
Other Literature Sources
Medical
Miscellaneous
