. 2016 Aug 31;17 Suppl 5(Suppl 5):498.
doi: 10.1186/s12864-016-2827-7.

Bioinformatic analysis of genotype by sequencing (GBS) data with NGSEP

Affiliations

Bioinformatic analysis of genotype by sequencing (GBS) data with NGSEP

Claudia Perea et al. BMC Genomics. .

Abstract

Background: Therecent development and availability of different genotype by sequencing (GBS) protocols provided a cost-effective approach to perform high-resolution genomic analysis of entire populations in different species. The central component of all these protocols is the digestion of the initial DNA with known restriction enzymes, to generate sequencing fragments at predictable and reproducible sites. This allows to genotype thousands of genetic markers on populations with hundreds of individuals. Because GBS protocols achieve parallel genotyping through high throughput sequencing (HTS), every GBS protocol must include a bioinformatics pipeline for analysis of HTS data. Our bioinformatics group recently developed the Next Generation Sequencing Eclipse Plugin (NGSEP) for accurate, efficient, and user-friendly analysis of HTS data.

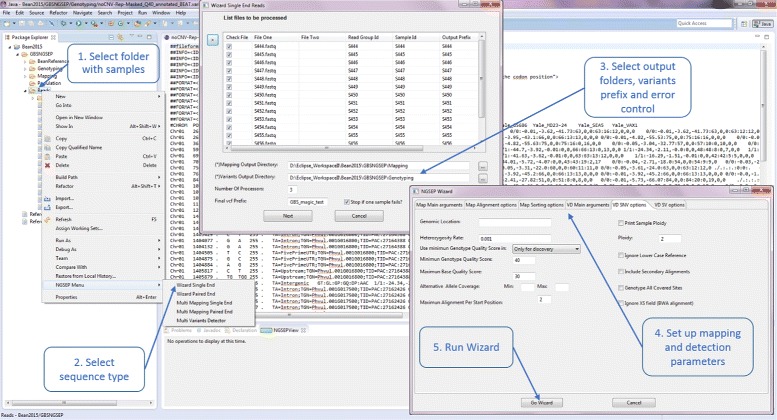
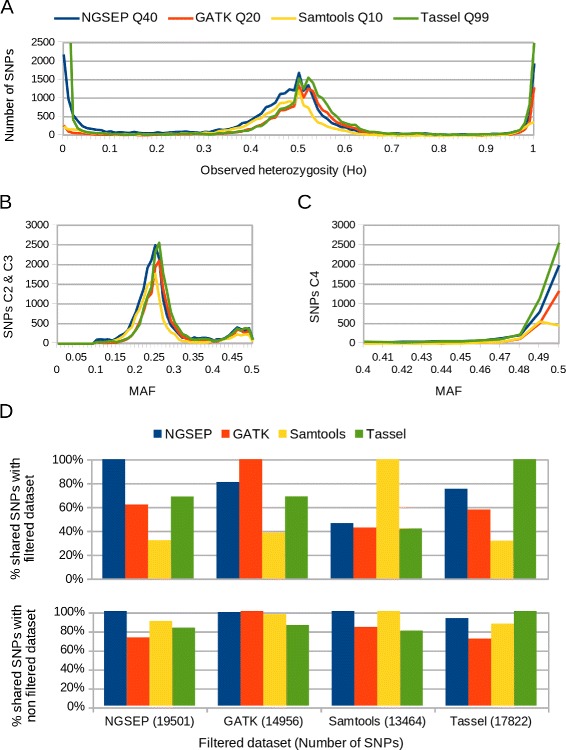
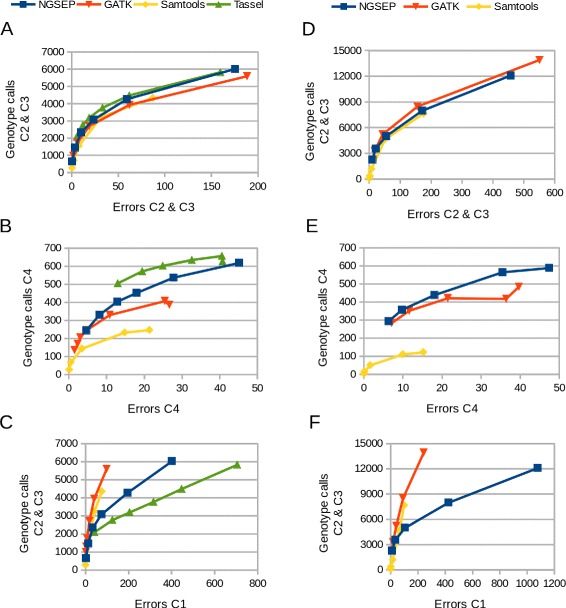
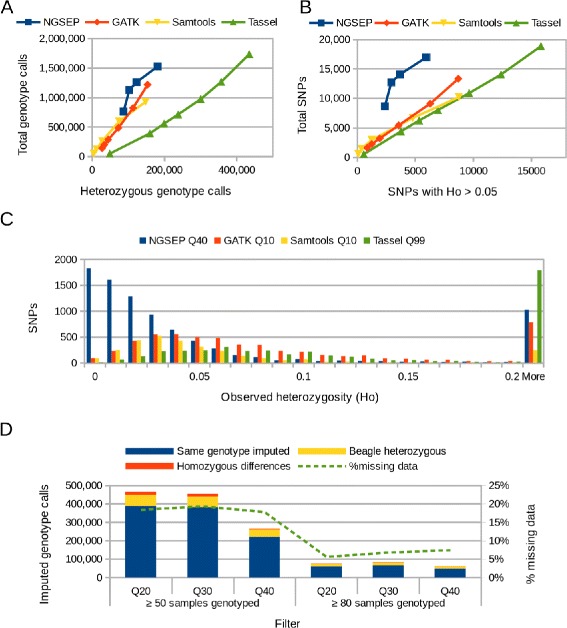
Results: Here we present the latest functionalities implemented in NGSEP in the context of the analysis of GBS data. We implemented a one step wizard to perform parallel read alignment, variants identification and genotyping from HTS reads sequenced from entire populations. We added different filters for variants, samples and genotype calls as well as calculation of summary statistics overall and per sample, and diversity statistics per site. NGSEP includes a module to translate genotype calls to some of the most widely used input formats for integration with several tools to perform downstream analyses such as population structure analysis, construction of genetic maps, genetic mapping of complex traits and phenotype prediction for genomic selection. We assessed the accuracy of NGSEP on two highly heterozygous F1 cassava populations and on an inbred common bean population, and we showed that NGSEP provides similar or better accuracy compared to other widely used software packages for variants detection such as GATK, Samtools and Tassel.

Conclusions: NGSEP is a powerful, accurate and efficient bioinformatics software tool for analysis of HTS data, and also one of the best bioinformatic packages to facilitate the analysis and to maximize the genomic variability information that can be obtained from GBS experiments for population genomics.

Keywords: Bioinformatics; GBS; NGSEP; SNP calling; Sequencing.


Figures

Fig. 1
Fig. 1
NGSEP wizard. One step wizard to obtain population variability datasets
Fig. 2
Fig. 2
MAF and H o distributions. Statistics on filtered SNPs obtained running the four discovery pipelines compared in this study on the K family GBS data. a Distribution of observed heterozygosity b MAF distribution in SNPs useful to build a genetic map (categories 2 and 3, see Methods for details), c MAF Distribution on highly heterozygous SNPs (category 4), and d Percentage of filtered SNPs useful to build a genetic map that appear at the filtered (upper chart), and unfiltered (lower chart) datasets obtained running each method
Fig. 3
Fig. 3
Quality assessment for cassava F1 families. Top figures: Number of genotype calls in SNPs classified in the categories that are useful to build a genetic map (C2 and C3, see Methods for details) contrasted with the number of segregation errors identified in such categories in a the K family and d the NxA family. Middle figures: Number of genotype calls in SNPs segregating the two parents (C4) contrasted with the number of (false) homozygous genotypes called in SNPs catalogued in this category in b the K family and e the NxA family. Bottom figures: Number of genotype calls in SNPs classified in the categories C2 and C3 contrasted with the number of genotyping errors identified in SNPs predicted to be monomorphic in c the K family and f the NxA family. For each pipeline the dots represent datapoints obtained filtering genotype calls at different minimum quality scores. Values in all figures are thousands of genotype calls
Fig. 4
Fig. 4
Quality assessment for the bean MAGIC population. a Total number of genotype calls obtained from sequencing data for the bean MAGIC population contrasted with the number of heterozygous genotype calls. For each pipeline the dots represent datapoints obtained filtering genotype calls at different minimum quality scores. b Total number of SNPs obtained in the same experiments as a function of the number of SNPs with observed heterozygosity larger than 0.05. c Distribution of observed heterozygosity for datasets obtained with the four pipelines compared in this study. d Distribution of imputed genotype calls for different datasets obtained with NGSEP and imputed with NGSEP and with Beagle. The green line represents the percentage of the total dataset that imputed genotype calls represent for each dataset

References

    1. Crossa J, Beyene Y, Kassa S, Pérez P, Hickey JM, Chen C, et al. Genomic prediction in maize breeding populations with genotyping-by-sequencing. G3. 2013;3(11):1903–26. doi: 10.1534/g3.113.008227. - DOI - PMC - PubMed
    1. Morris GP, Ramu P, Deshpande SP, Hash CT, Shah T, Upadhyaya HD, et al. Population genomic and genome-wide association studies of agroclimatic traits in sorghum. Proc Natl Acad Sci. 2013;110(2):453–8. doi: 10.1073/pnas.1215985110. - DOI - PMC - PubMed
    1. Romay MC, Millard MJ, Glaubitz JC, Peiffer Ja, Swarts KL, Casstevens TM, et al. Comprehensive genotyping of the USA national maize inbred seed bank. Genome Biol. 2013;14(6):55. doi: 10.1186/gb-2013-14-6-r55. - DOI - PMC - PubMed
    1. Soto JC, Ortiz JF, Perlaza-Jiménez L, Vásquez AX, Lopez-Lavalle LAB, Mathew B, et al. A genetic map of cassava (Manihot esculenta Crantz) with integrated physical mapping of immunity-related genes. BMC Genomics. 2015;16:190. doi: 10.1186/s12864-015-1397-4. - DOI - PMC - PubMed
    1. Spindel J, Begum H, Akdemir D, Virk P, Collard B, Redoña E, et al. Genomic selection and association mapping in rice (Oryza sativa): effect of trait genetic architecture, training population composition, marker number and statistical model on accuracy of rice genomic selection in elite, tropical rice breeding lines. PLoS Genet. 2015;11(2):e1004982. doi: 10.1371/journal.pgen.1004982. - DOI - PMC - PubMed

Publication types

LinkOut - more resources