. 2016 Sep 1;16(1):200.
doi: 10.1186/s12866-016-0811-7.

A novel method for investigating Burkholderia cenocepacia infections in patients with cystic fibrosis and other chronic diseases of the airways

Affiliations

A novel method for investigating Burkholderia cenocepacia infections in patients with cystic fibrosis and other chronic diseases of the airways

Christiaan D M Wijers et al. BMC Microbiol. .

Abstract

Background: Burkholderia cenocepacia is a Gram-negative, opportunistic pathogen that is a cause of morbidity and mortality in patients with cystic fibrosis (CF). Research efforts over the past few decades contributed to our understanding of these infections by identifying virulence factors. However, little is known about how this pathogen adapts to the harsh environment found inside the CF airways, which is characterized by a unique mucus containing high concentrations of inflammatory markers. The current study developed a novel model to further investigate this phenomenon.

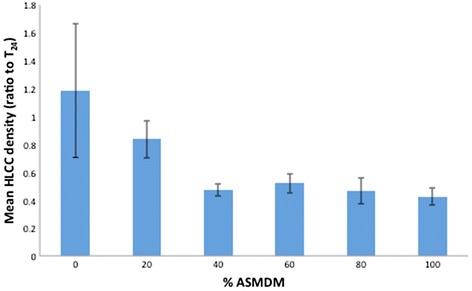
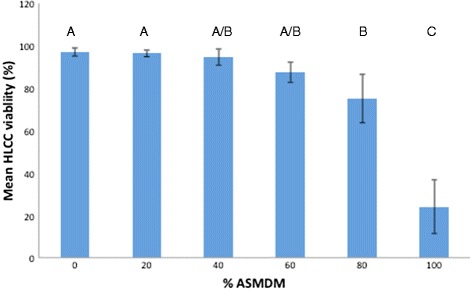
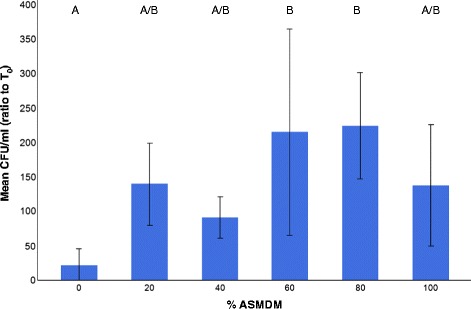
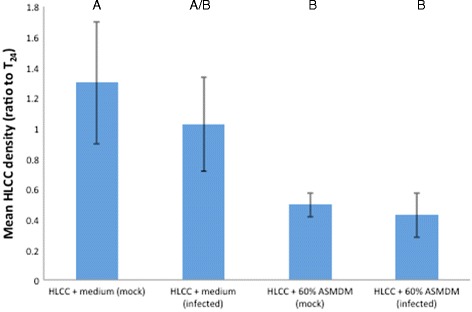
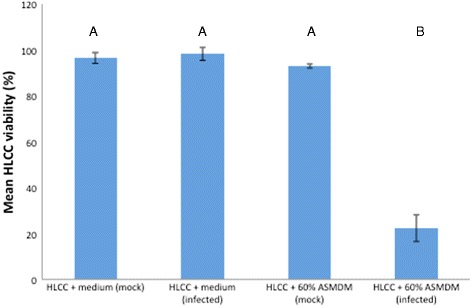
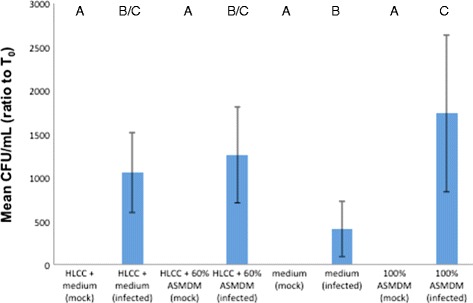
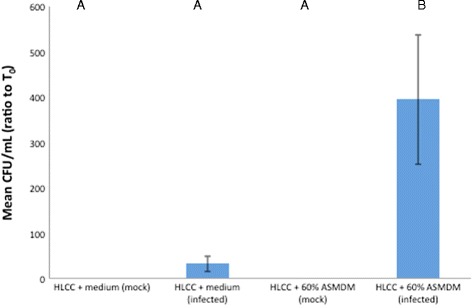
Results: Monolayers of human A549 lung carcinoma cells (HLCCs) were exposed to a mixture of artificial CF sputum medium (ASMDM) in tissue culture growth medium, and subsequently infected with B. cenocepacia K56-2 for 24 h. The data showed that this model supported B. cenocepacia growth. In addition, consistent with similar studies using current models such as CF airway tissue samples, HLCC viability was reduced by more than 70 % when grown in 60 % ASMDM and infected with B. cenocepacia compared to mock-infected controls and medium alone. Furthermore, the amount of B. cenocepacia cells associated with the HLCC monolayer was more than 10 times greater in 60 % ASMDM when compared to medium controls.

Conclusions: These findings suggest that HLCC monolayers in 60 % ASMDM serve as a valid alternative to study B. cenocepacia infections in patients with CF, and possibly other chronic diseases of the airways. Furthermore, the results obtained in this study suggest an important role for CF sputum in B. cenocepacia pathogenesis.

Keywords: Burkholderia; CF sputum; Model; PCD sputum; Tissue culture; cenocepacia.


Figures

Fig. 1
Fig. 1
Effect of ASMDM on the density of human lung carcinoma cells A549 (HLCCs). Confluent HLCCs grown in gas permeable 24-well plates were exposed to varying concentrations of ASMDM in Ham’s F-12 complete medium. After 24 h, the cell density (cells/mL) of HLCCs was compared to the cell density of T24 control HLCCs. T24 control consisted of HLCC monolayers in Ham’s F-12 complete medium that were not manipulated (i.e. not washed, and medium was not replaced) for the duration of the experiment. There are no statistically significant differences between any of the different combinations (oneway ANOVA, p = 0.07). Values are averages from four independent experiments each with duplicate wells. Bars show standard deviation
Fig. 2
Fig. 2
The effect of ASMDM on the viability of HLCCs. Confluent HLCCs grown in gas permeable 24-well plates were exposed to varying concentrations of ASMDM in Ham’s F-12 complete medium. After 24 h, mean viability was determined using Trypan blue staining. There are statistically significant differences in mean cell viability between the different combinations (ANOVA, p < 0.0001). A Tukey-HSD post-hoc test indicated that the mean cell viability in 100 % ASMDM is statistically different from the 0, 20, 40, 60, or 80 % ASMDM (p < 0.0001 for all), and that the mean cell viability in 80 % ASMDM is statistically different than the 0 or 20 % ASMDM (p = 0.0336 and p = 0.0404, respectively). Values are averages of four independent experiments with duplicate or triplicate wells. Bars show standard deviation. Variables with different letters are statistically different (oneway ANOVA, p < 0.05)
Fig. 3
Fig. 3
The effect of ASMDM on B. cenocepacia growth. B. cenocepacia was added to non-gas permeable 24-well plates containing ASMDM diluted in Ham’s F-12 complete medium and incubated at 37 °C (7 % CO2). After 24 h, mean CFU/mL of B. cenocepacia in each well was compared to the starting culture of B. cenocepacia (T0). There are statistically significant differences in mean CFU/mL ratio between 0 and 60–80 % (oneway ANOVA, p = 0.03). Values are averages of four independent experiments with duplicate or triplicate wells. Bars show standard deviation. Variables with different letters are statistically different (oneway ANOVA, p < 0.05)
Fig. 4
Fig. 4
The effect of B. cenocepacia infection on the integrity of HLCC monolayers. Confluent HLCCs were subjected to Ham’s F-12 complete medium (a and b) or 60 % ASMDM (c and d), infected with B. cenocepacia at MOI 0.3-5 (b and d) or mock-infected with saline (a and c), and incubated at 37 °C (7 % CO2). After 24 h, HLCC monolayers were assessed for damage with an inverted Zeiss axiovert 40 CFL microscope (1000X magnification). HLCC monolayers in both mock-infected wells are confluent with no damage (a and c). HLCC monolayer in Ham’s F-12 complete medium with B. cenocepacia shows no sign of damage, although a dense mass is floating in the well. Because this is seen in infected wells only, we think the aggregations are clouds of bacterial cells floating in the supernatant (arrows) (b). HLCC monolayer in 60 % ASMDM with B. cenocepacia shows damage as indicated by gaps in the monolayer (black stars). Clouds of bacterial cells can be seen as well (arrows) (d)
Fig. 5
Fig. 5
The effect of B. cenocepacia on HLCC density in 60 % ASMDM. Confluent HLCCs were exposed to 60 % ASMDM diluted in Ham’s F-12 complete medium, infected with B. cenocepacia at MOI 0.3-5 or mock-infected with saline, and incubated at 37 °C (7 % CO2). After 24 h, the cell density (cells/mL) of each well was compared to the cell density of T24 control HLCCs. T24 control consisted of HLCCs in Ham’s F-12 complete medium that were not manipulated (i.e. not washed, and medium not replaced) for the duration of the experiment. There are statistically significant differences in mean cell density ratio between the different treatments (ANOVA, p = 0.0037). A Tukey-HSD post-hoc test indicated that the mean cell density ratio in infected HLCCs + 60 % ASMDM is significantly different than in mock-infected HLCCs + Ham’s F-12 complete medium (p = 0.0055). The mean cell density ratio in mock-infected HLCCs + 60 % ASMDM is significantly different than in mock-infected HLCCs + Ham’s F-12 complete medium (p = 0.0135). Values are averages of three independent experiments with single wells. Bars show standard deviation. Variables with different letters are statistically different (oneway ANOVA, p < 0.05)
Fig. 6
Fig. 6
The effect of B. cenocepacia on HLCC viability in 60 % ASMDM. Confluent HLCCs were exposed to 60 % ASMDM diluted in Ham’s F-12 complete medium, infected with B. cenocepacia at MOI 5 or mock-infected with saline, and incubated at 37 °C (7 % CO2). After 24 h, HLCC viability was determined using Trypan blue staining. There are statistically significant differences in mean cell viability between the different treatments (ANOVA, p < 0.0001). A Tukey-HSD post-hoc test indicated that the mean cell viability of infected HLCCs + 60 % ASMDM is significantly different than mock-infected HLCCs + Ham’s F-12 complete medium, infected HLCCs + Ham’s F-12 complete medium, and mock-infected HLCCs + 60 % ASMDM (p < 0.0001 for all). Values are averages of three independent experiments with single wells. Bars show standard deviation. Variables with different letters are statistically different (oneway ANOVA, p < 0.05)
Fig. 7
Fig. 7
The effect of 60 % ASMDM and HLCC monolayers on B. cenocepacia growth. Confluent HLCCs or wells without HLCCs were exposed to 60 % ASMDM diluted in Ham’s F-12 complete medium, infected with B. cenocepacia at MOI 5 or mock-infected with saline, and incubated at 37 °C (7 % CO2). After 24 h, the bacterial density (CFU/mL) of each well was compared to the starting bacterial density (T0). There are statistically significant differences in mean CFU/mL ratio between the different treatments (ANOVA, p = 0.0003). A Tukey-HSD post-hoc test showed the mean CFU/mL ratio in infected 100 % ASMDM is significantly different than mock-infected HLCCs + medium, mock-infected HLCCs + 60 % ASMDM, infected or mock-infected medium, and mock-infected 100 % ASMDM (p = 0.0024 for all). The mean CFU/mL ratio in infected HLCCs + 60 % ASMDM is significantly different than mock-infected HLCCs + medium, mock-infected HLCCs + 60 % ASMDM, mock-infected medium, and mock-infected 100 % ASMDM (p = 0.0354). Values are averages of three independent experiments with duplicate wells. Bars show standard deviation. Variables with different letters are statistically different (oneway ANOVA, p < 0.05)
Fig. 8
Fig. 8
The effect of 60 % ASMDM on the ability of B. cenocepacia to invade the HLCC monolayer. Confluent HLCCs were exposed to 60 % ASMDM diluted in Ham’s F-12 complete medium, infected with B. cenocepacia at MOI 5 or mock-infected with saline, and incubated at 37 °C (7 % CO2). After 24 h, HLCCs were washed and then lysed with sterile dH2O. The bacterial density (CFU/mL) in each lysate was compared to the starting bacterial density at T0. Differences in mean ratio of CFU/mL were significantly different as indicated by oneway ANOVA (p = 0.0004). A Tukey-HSD post-hoc test indicated that the mean ratio CFU/mL in infected HLCCs + 60 % ASMDM is significantly different than in infected or mock-infected HLCCs + medium and in mock-infected HLCCs + 60 % ASMDM (p = 0.0007, p = 0.0007, and p = 0.0013, respectively). Values are averages of three independent experiments with single wells. Bars show standard deviation. Variables with different letters are statistically different (oneway ANOVA, p < 0.05)

Similar articles

Cited by

References

    1. Bush A, Payne D, Pike S, Jenkins G, Henke MO, Rubin BK. Mucus properties in children with primary ciliary dyskinesia: comparison with cystic fibrosis. Chest. 2006;129:118–23. doi: 10.1378/chest.129.1.118. - DOI - PubMed
    1. Noone PG, Leigh MW, Sannuti A, Minnix SL, Carson JL, Hazucha M, Zariwala MA, Knowles MR. Primary ciliary dyskinesia: diagnostic and phenotypic features. Amer J Respir Crit Care Med. 2004;169:459–67. doi: 10.1164/rccm.200303-365OC. - DOI - PubMed
    1. Afzelius BA. A human syndrome caused by immotile cilia. Science. 1976;193:317–9. doi: 10.1126/science.1084576. - DOI - PubMed
    1. Mahenthiralingam E, Urban TA, Goldber JB. The multifarious, multireplicon Burkholderia cepacia complex. Nat Rev Microbiol. 2005;3:144–56. doi: 10.1038/nrmicro1085. - DOI - PubMed
    1. LiPuma JJ. Burkholderia cepacia: management issues and new insights. Clin Chest Med. 1998;19:473–86. doi: 10.1016/S0272-5231(05)70094-0. - DOI - PubMed

Publication types

MeSH terms